Orange City, FL (Florida) Houses and Residents
| Orange City: | $242,256 |
| Florida: | $354,100 |
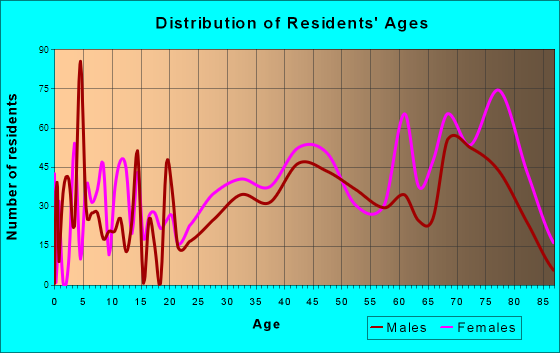
Total population: 11,056 (Urban population: 6,397, Rural population: 42 (all nonfarm))
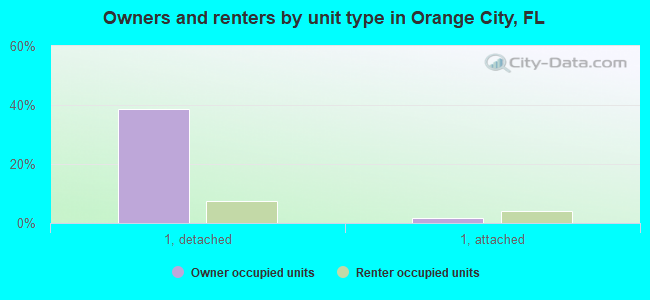
Houses: 6,967 (6,209 occupied: 3,404 owner occupied, 2,858 renter occupied)
| % of renters here: | 46% |
| State: | 33% |
Housing density: 1,151 houses/condos per square mile
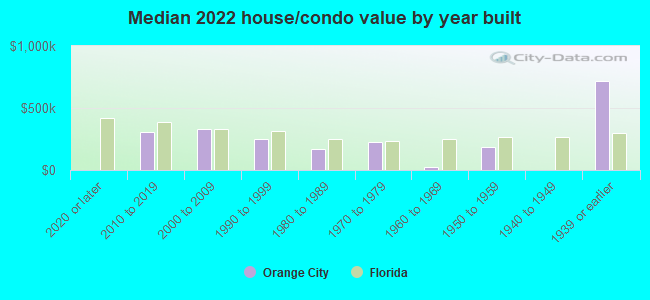
Median price asked for vacant for-sale houses and condos in 2022: $209,846.
Median contract rent in 2022: $1,489 (lower quartile is $966, upper quartile is over $2,000)
Median rent asked for vacant for-rent units in 2022: $2,857
Median gross rent in Orange City, FL in 2022: $1,615
Housing units in Orange City with a mortgage: 1,848 (38 second mortgage, 0 home equity loan, 27 both second mortgage and home equity loan)
Houses without a mortgage: 12
Median household income for houses/condos with a mortgage: $101,707
Median household income for apartments without a mortgage: $40,163
Median monthly housing costs: $1,236
Compare current foreclosures in Orange City, FL:
| Photo | Address | Area | Beds / Baths | Price | Details |
|---|---|---|---|---|---|

|
#1
Miller Rd
Orange City, FL 32763
|
2,738 sq. feet
|
3 baths 4 beds |
show details | |

|
#2
Highland Dr
Orange City, FL 32763
|
1,771 sq. feet
|
3 baths 3 beds |
show details | |

|
#3
W Graves Ave
Orange City, FL 32763
|
920 sq. feet
|
1 baths 2 beds |
show details | |

|
#4
E New York Ave
Orange City, FL 32763
|
2,327 sq. feet
|
4 baths 3 beds |
show details | |

|
#5
N Sparkman Ave
Orange City, FL 32763
|
1,050 sq. feet
|
1 baths 3 beds |
show details | |

|
#6
Blue Springs Ct
Orange City, FL 32763
|
1,050 sq. feet
|
2 baths 3 beds |
show details | |

|
#7
Dixson St
Orange City, FL 32763
|
1,177 sq. feet
|
3 baths 3 beds |
show details | |

|
#8
Walnut Ave
Orange City, FL 32763
|
1,308 sq. feet
|
3 baths 3 beds |
show details | |

|
#9
19th St
Orange City, FL 32763
|
1,290 sq. feet
|
2 baths 3 beds |
show details | |

|
#10
White Birch Ct
Orange City, FL 32763
|
1,758 sq. feet
|
2 baths 4 beds |
show details |
| Photo | Address | Area | Beds / Baths | Price | Details |
|---|---|---|---|---|---|

|
#11
Howard Ave
Orange City, FL 32763
|
1,136 sq. feet
|
1 baths 2 beds |
show details | |

|
#12
E Holly Dr
Orange City, FL 32763
|
1,304 sq. feet
|
3 baths 3 beds |
show details | |

|
#13
E Wisconsin Ave
Orange City, FL 32763
|
1,517 sq. feet
|
3 baths 4 beds |
show details | |

|
#14
Almond St
Orange City, FL 32763
|
1,218 sq. feet
|
2 baths 2 beds |
show details | |

|
#15
Montrose Ave
Orange City, FL 32763
|
988 sq. feet
|
1 baths 3 beds |
show details | |

|
#16
Racine Rd
Orange City, FL 32763
|
2,500 sq. feet
|
2 baths 3 beds |
show details | |

|
#17
N Sparkman Ave
Orange City, FL 32763
|
1,050 sq. feet
|
1 baths 3 beds |
show details | |

|
#18
Shady Ln
Orange City, FL 32763
|
2,886 sq. feet
|
3 baths 3 beds |
show details | |

|
#19
Tangelo Ave
Orange City, FL 32763
|
1,353 sq. feet
|
3 baths 2 beds |
show details | |

|
#20
Gilmore Stage Rd
Orange City, FL 32763
|
1,816 sq. feet
|
- baths 3 beds |
show details |
| Photo | Address | Area | Beds / Baths | Price | Details |
|---|---|---|---|---|---|

|
#21
Golf View Estates Dr
Orange City, FL 32763
|
2,748 sq. feet
|
- baths 5 beds |
show details | |

|
#22
13th St
Orange City, FL 32763
|
1,346 sq. feet
|
- baths 3 beds |
show details | |

|
#23
Grand Plaza Dr Apt K4
Orange City, FL 32763
|
- sq. feet
|
- baths - beds |
show details | |

|
#24
Glazebrook Loop
Orange City, FL 32763
|
- sq. feet
|
- baths - beds |
show details | |

|
#25
E Graves Ave
Orange City, FL 32763
|
- sq. feet
|
- baths - beds |
show details | |

|
#26
Banyan St
Orange City, FL 32763
|
- sq. feet
|
- baths - beds |
show details | |

|
#27
19th St
Orange City, FL 32763
|
- sq. feet
|
- baths - beds |
show details | |

|
#28
Skyline Loop, Apt 102
Orange City, FL 32763
|
- sq. feet
|
- baths - beds |
show details | |

|
#29
Navel Orange Dr
Orange City, FL 32763
|
- sq. feet
|
- baths - beds |
show details | |

|
#30
Grand Plaza Dr Apt Q2
Orange City, FL 32763
|
- sq. feet
|
- baths - beds |
show details |
| Photo | Address | Area | Beds / Baths | Price | Details |
|---|---|---|---|---|---|

|
#31
E Graves Ave Lot 162
Orange City, FL 32763
|
- sq. feet
|
- baths - beds |
show details | |

|
#32
N Leavitt Ave
Orange City, FL 32763
|
- sq. feet
|
- baths - beds |
show details | |

|
#33
W New York Ave
Orange City, FL 32763
|
- sq. feet
|
- baths - beds |
show details | |

|
#34
Hickory Ave
Orange City, FL 32763
|
- sq. feet
|
- baths - beds |
show details | |

|
#35
Lady Bird Ln
Orange City, FL 32763
|
- sq. feet
|
- baths - beds |
show details | |

|
#36
Voyageurs Ave
Orange City, FL 32763
|
- sq. feet
|
- baths - beds |
show details | |

|
Check over 1 million property listings on Foreclosure.com!
|
browse all offers | |||


 | Orange City Home Inspector (0 replies) |
| Thoughts on Poinciana? (12 replies) |
| Recommendations for quiet suburban like towns (18 replies) |
| Home Maker Eviction (6 replies) |
| Sanford...Seminole Pointe Apartments? (5 replies) |
| Should we steer clear of Deltona? (16 replies) |
Median year apartment built: 1996
Household type by relationship:
Households: 13,744- Male householders: 3,113 (963 living alone), Female householders: 3,134 (1,333 living alone)
2,777 spouses (2,777 opposite-sex spouses), 354 unmarried partners, (320 opposite-sex unmarried partners), 3,402 children (3,292 natural, 19 adopted, 90 stepchildren), 109 grandchildren, 19 brothers or sisters, 87 parents, 15 foster children, 145 other relatives, 158 non-relatives
- In group quarters: 426
Size of family households: 1,885 2-persons, 959 3-persons, 324 4-persons, 226 5-persons, 109 6-persons.
Size of nonfamily households: 2,336 1-person, 375 2-persons, 17 3-persons, 11 5-persons.
1,117 married couples with children.
1,539 single-parent households (134 men, 1,405 women).
86.2% of residents of Orange City speak English at home.
12.6% of residents speak Spanish at home (78% speak English very well, 18% speak English well, 4% speak English not well).
0.9% of residents speak other Indo-European language at home (50% speak English very well, 50% speak English well).
0.6% of residents speak Asian or Pacific Island language at home (38% speak English very well, 35% speak English well, 27% speak English not well).
Foreign born population: 748 (5.4%)
(85.0% of them are naturalized citizens)
| Here: | 5.5 |
| State: | 5.9 |
| Here: | 3.8 |
| State: | 4.2 |
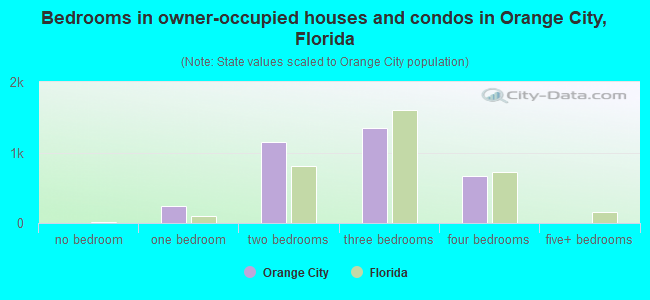
- Bedrooms in owner-occupied houses and condos in Orange City, Florida
- 0no bedroom
- 2371 bedroom
- 1,1422 bedrooms
- 1,3503 bedrooms
- 6684 bedrooms
- 65+ bedrooms
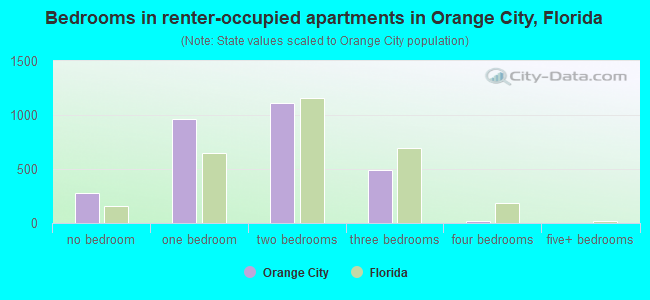
- Bedrooms in renter-occupied apartments in Orange City, Florida
- 279no bedroom
- 9631 bedroom
- 1,1142 bedrooms
- 4873 bedrooms
- 174 bedrooms
- 05+ bedrooms
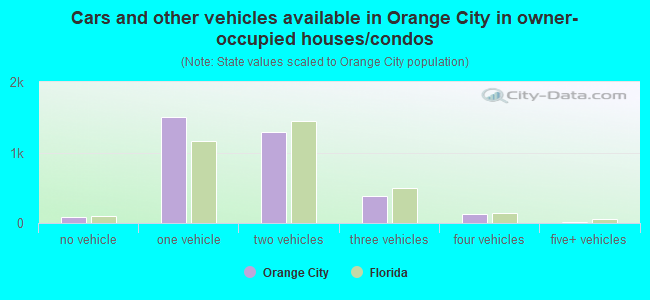
- Cars and other vehicles available in Orange City in owner-occupied houses/condos
- 91no vehicle
- 1,5021 vehicle
- 1,2862 vehicles
- 3853 vehicles
- 1224 vehicles
- 195+ vehicles
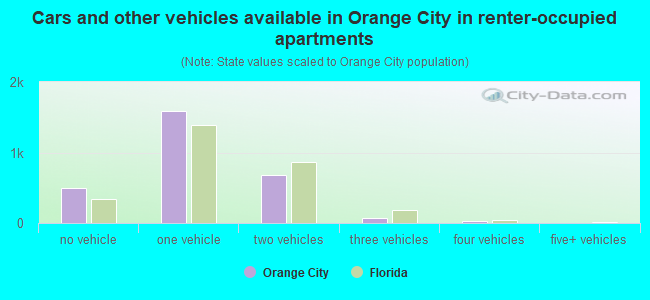
- Cars and other vehicles available in Orange City in renter-occupied apartments
- 491no vehicle
- 1,5931 vehicle
- 6792 vehicles
- 713 vehicles
- 264 vehicles
- 05+ vehicles
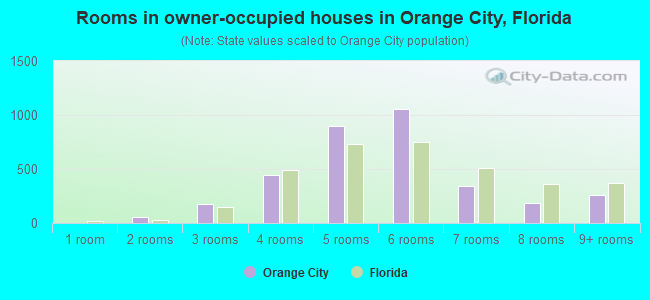
- Rooms in owner-occupied houses in Orange City, Florida
- 01 room
- 512 rooms
- 1733 rooms
- 4434 rooms
- 8985 rooms
- 1,0536 rooms
- 3417 rooms
- 1838 rooms
- 2639+ rooms
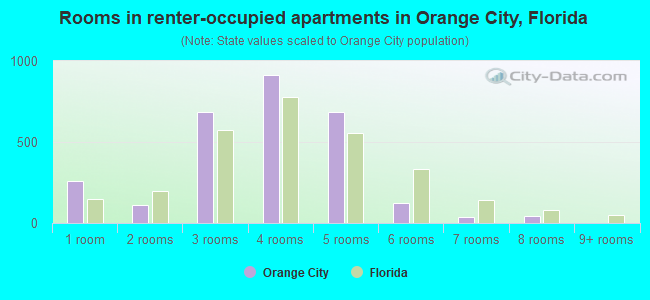
- Rooms in renter-occupied apartments in Orange City, Florida
- 2621 room
- 1102 rooms
- 6863 rooms
- 9154 rooms
- 6865 rooms
- 1226 rooms
- 357 rooms
- 438 rooms
- 09+ rooms
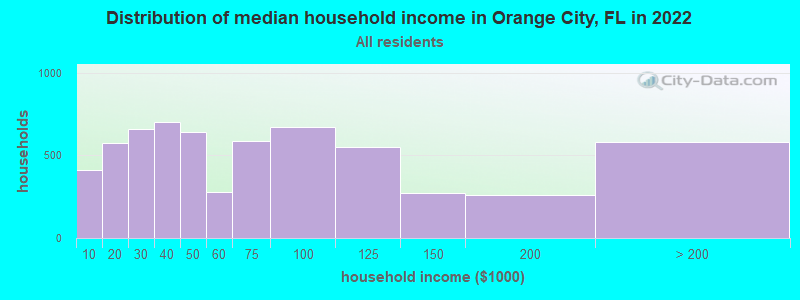
Orange City, FL household income distribution

- 409Less than $10,000
- 575$10,000 to $19,999
- 661$20,000 to $29,999
- 702$30,000 to $39,999
- 644$40,000 to $49,999
- 280$50,000 to $59,999
- 586$60,000 to $74,999
- 670$75,000 to $99,999
- 553$100,000 to $124,999
- 271$125,000 to $149,999
- 262$150,000 to $199,999
- 581$200,000 or more
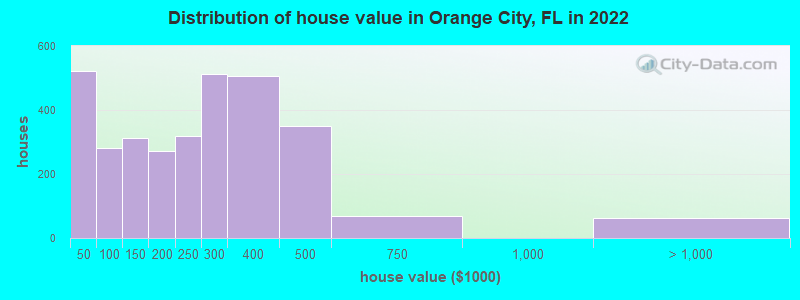
Home value of owner - occupied houses in 2022 in Orange City, FL
-
- 69Less than $10,000
- 105$10,000 to $14,999
- 149$15,000 to $19,999
- 33$20,000 to $24,999
- 31$25,000 to $29,999
- 39$30,000 to $34,999
- 32$35,000 to $39,999
- 59$40,000 to $49,999
- 65$50,000 to $59,999
- 50$60,000 to $69,999
- 86$70,000 to $79,999
- 18$90,000 to $99,999
- 183$100,000 to $124,999
- 130$125,000 to $149,999
- 172$150,000 to $174,999
- 100$175,000 to $199,999
- 318$200,000 to $249,999
- 511$250,000 to $299,999
- 504$300,000 to $399,999
- 349$400,000 to $499,999
- 69$500,000 to $749,999
- 62$1,000,000 to $1,499,999
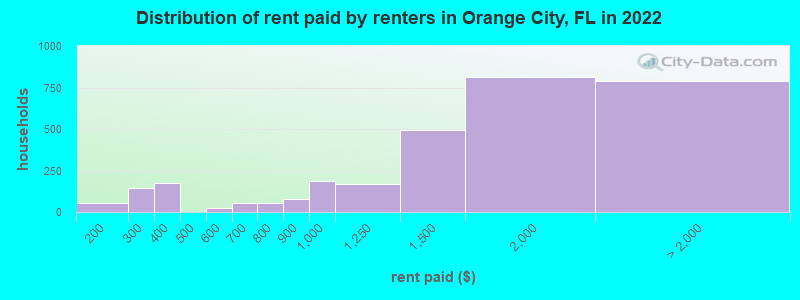
Rent paid by renters in 2022 in Orange City, FL
-
- 39$100 to $149
- 15$150 to $199
- 142$200 to $249
- 138$300 to $349
- 36$350 to $399
- 26$550 to $599
- 27$600 to $649
- 24$650 to $699
- 53$750 to $799
- 80$800 to $899
- 188$900 to $999
- 168$1,000 to $1,249
- 490$1,250 to $1,499
- 815$1,500 to $1,999
- 212$2,000 to $2,499
- 177$2,500 to $2,999
- 147$3,000 to $3,499
- 103$3,500 or more
- 150No cash rent
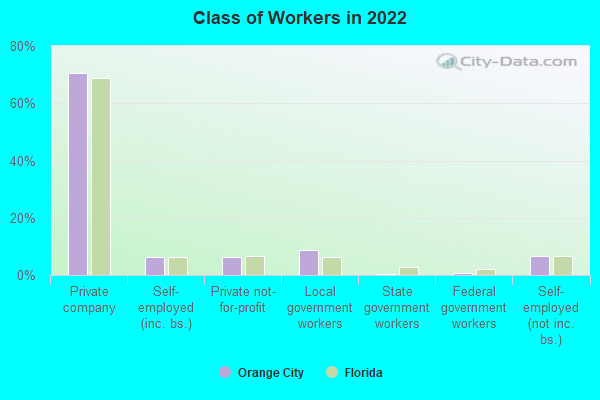
Percentage of workers working in this county: 70.9%
Number of people working at home: 627 (10.1% of all workers)
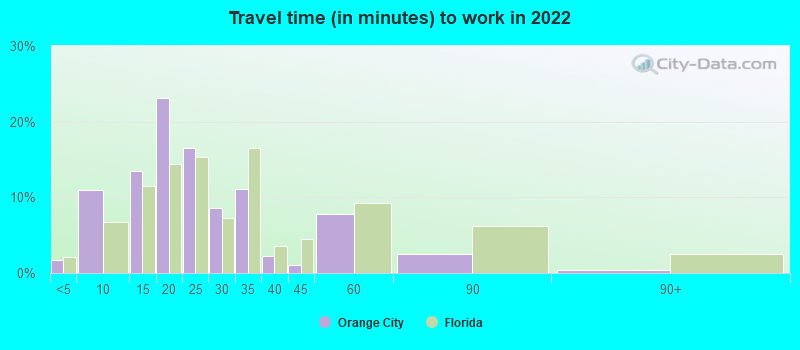
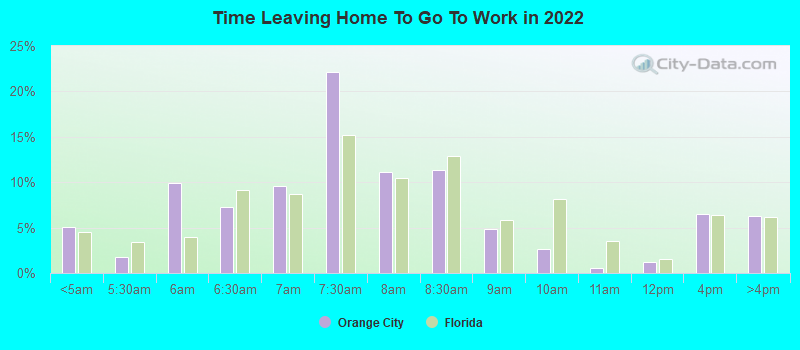
Travel time to work (commute)
- Less than 5 minutes: 113
- 5 to 9 minutes: 751
- 10 to 14 minutes: 776
- 15 to 19 minutes: 628
- 20 to 24 minutes: 735
- 25 to 29 minutes: 546
- 30 to 34 minutes: 708
- 35 to 39 minutes: 108
- 40 to 44 minutes: 134
- 45 to 59 minutes: 211
- 60 to 89 minutes: 524
- 90 or more minutes: 187
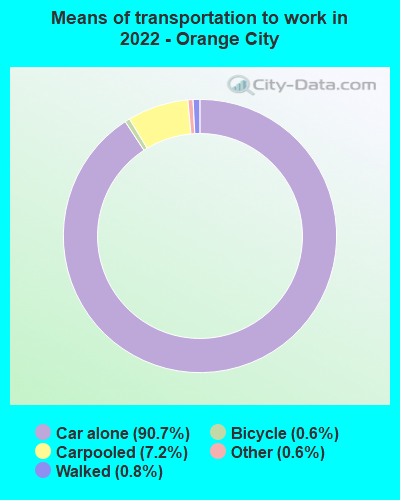
Means of transportation to work:
- Drove a car alone: 8,770 (81.6%)
- Carpooled: 768 (7.1%)
- Taxi: 59 (0.5%)
- Bicycle: 62 (0.6%)
- Walked: 68 (0.6%)
- Worked at home: 627 (5.8%)
- Unemployment by race in 2022
- Unemployment rate for White non-Hispanic residents
- 1.3%Males
- 1.7%Females
- Unemployment rate for Black residents
- 15.0%Females
- Unemployment rate for other race residents
- 11.5%Females
- Unemployment rate for Hispanic or Latino residents
- 2.8%Males
- 8.0%Females
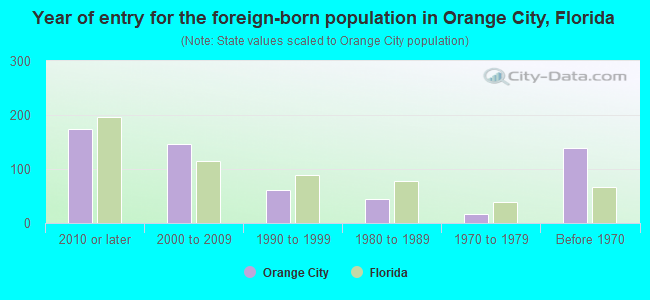
- Year of entry for the foreign-born population in Orange City, Florida
- 1752010 or later
- 1472000 to 2009
- 621990 to 1999
- 441980 to 1989
- 171970 to 1979
- 138Before 1970
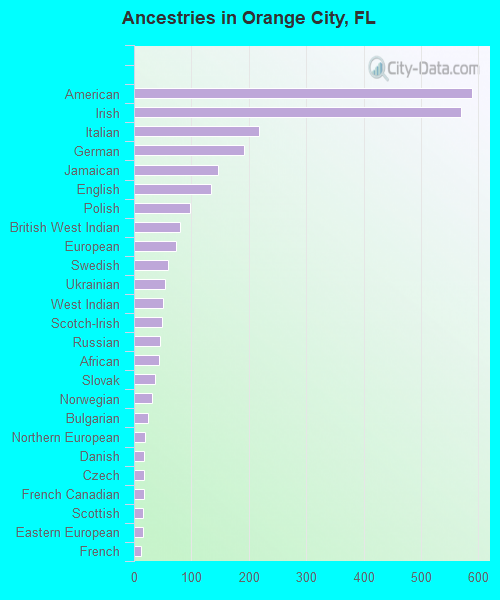
First ancestries reported:
- American: 589 (9.0%)
- Irish: 570 (8.7%)
- Italian: 218 (3.3%)
- German: 192 (2.9%)
- Jamaican: 146 (2.2%)
- English: 135 (2.1%)
- Polish: 98 (1.5%)
- British West Indian: 81 (1.2%)
- European: 74 (1.1%)
- Swedish: 60 (0.9%)
- Ukrainian: 54 (0.8%)
- West Indian: 50 (0.8%)
- Scotch-Irish: 49 (0.7%)
- Russian: 46 (0.7%)
- African: 44 (0.7%)
- Slovak: 36 (0.5%)
- Norwegian: 31 (0.5%)
- Bulgarian: 24 (0.4%)
- Northern European: 19 (0.3%)
- Danish: 18 (0.3%)
- Czech: 17 (0.3%)
- French Canadian: 17 (0.3%)
- Scottish: 16 (0.2%)
- Eastern European: 15 (0.2%)
- French: 12 (0.2%)
Most common places of birth for foreign-born residents (%):
| Orange City: | 16.2% (131) |
| Florida: | 5.0% (227,319) |
| Orange City: | 15.7% (127) |
| Florida: | 22.0% (1,006,576) |
| Orange City: | 12.6% (102) |
| Florida: | 6.5% (298,669) |
| Orange City: | 7.3% (59) |
| Florida: | 1.3% (57,263) |
| Orange City: | 6.9% (56) |
| Florida: | 2.1% (97,632) |
| Orange City: | 4.7% (38) |
| Florida: | 5.7% (262,042) |
| Orange City: | 4.3% (35) |
| Florida: | 0.7% (30,755) |
| Orange City: | 3.8% (31) |
| Florida: | 0.3% (15,079) |
| Orange City: | 3.8% (31) |
| Florida: | 5.6% (257,152) |
| Orange City: | 3.2% (26) |
| Florida: | 0.3% (12,303) |
| Orange City: | 2.7% (22) |
| Florida: | 2.4% (109,132) |
| Orange City: | 2.5% (20) |
| Florida: | 0.2% (6,883) |
| Orange City: | 2.4% (19) |
| Florida: | 0.6% (25,219) |
| Orange City: | 1.6% (13) |
| Florida: | 3.0% (137,727) |
| Orange City: | 1.6% (13) |
| Florida: | 0.5% (22,972) |
Place of birth for U.S.-born residents:
- This state: 4,214
- Other state: 8,148
- Northeast: 4,259
- Midwest: 2,191
- South: 1,275
- West: 423
81.3% of Orange City residents lived in the same house 1 years ago.
Out of people who lived in different houses, 37.6% lived in this county.
Out of people who lived in different counties, 69.8% lived in Florida.
| Orange City: | 81.3% |
| State average: | 86.3% |
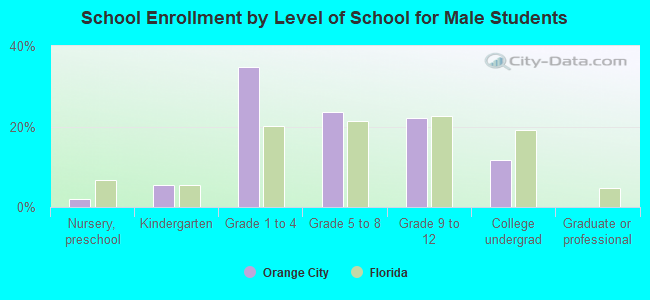
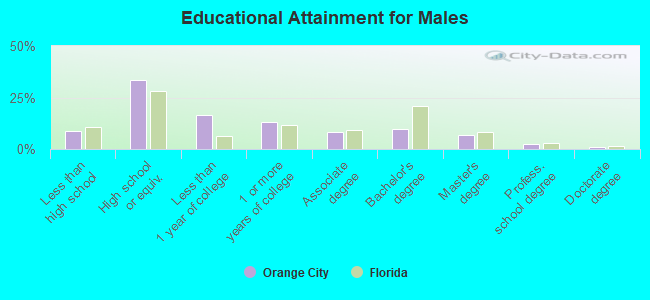
Education attainment for males 25 years and older:
- No schooling: 102
- Nursery to 4th grade: 0
- 5th and 6th grade: 0
- 7th and 8th grade: 80
- 9th grade: 25
- 10th grade: 131
- 11th grade: 28
- 12th grade, no diploma: 19
- High school graduate (or equivalency): 1,520
- Less than 1 year of college: 745
- Some college more than 1 year, no degree: 601
- Associate degree: 365
- Bachelor's degree: 443
- Master's degree: 303
- Professional school degree: 114
- Doctorate degree: 39
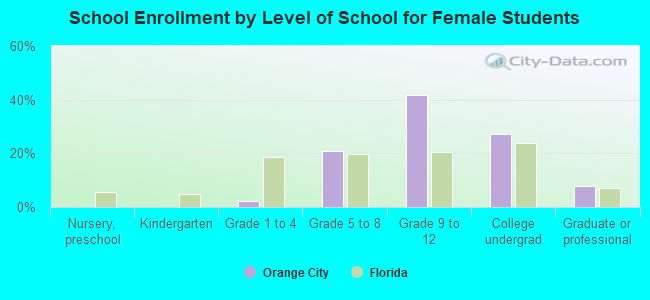
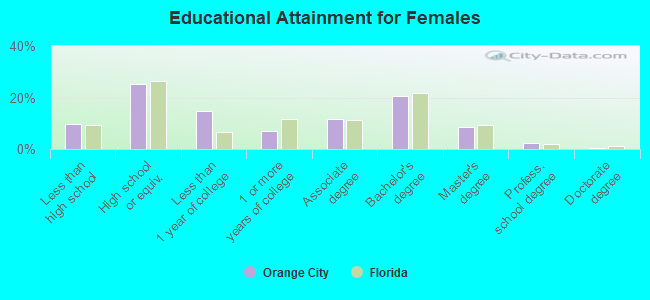
Education attainment for females 25 years and older:
- No schooling: 21
- Nursery to 4th grade: 0
- 5th and 6th grade: 9
- 7th and 8th grade: 85
- 9th grade: 257
- 10th grade: 96
- 11th grade: 32
- 12th grade, no diploma: 56
- High school graduate (or equivalency): 1,432
- Less than 1 year of college: 848
- Some college more than 1 year, no degree: 394
- Associate degree: 674
- Bachelor's degree: 1,180
- Master's degree: 477
- Professional school degree: 127
- Doctorate degree: 13
Housing units in structures:
- One, detached: 3,082
- One, attached: 340
- Two: 392
- 3 or 4: 334
- 5 to 9: 294
- 10 to 19: 448
- 20 to 49: 397
- 50 or more: 652
- Mobile homes: 957
- Boats, RVs, vans, etc.: 65
Median worth of mobile homes: $53,448
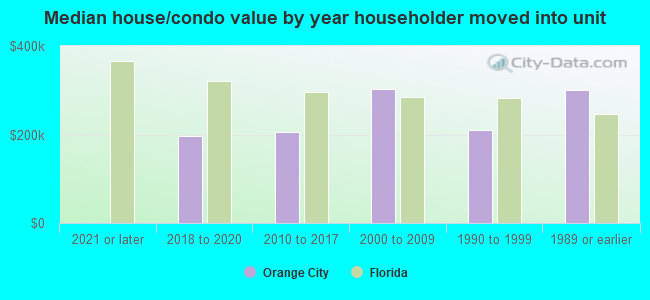
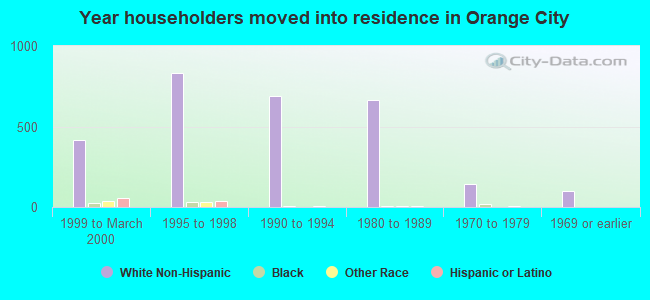
House/condo owner moved in on average 7 years ago
Renter moved in on average 1 years ago
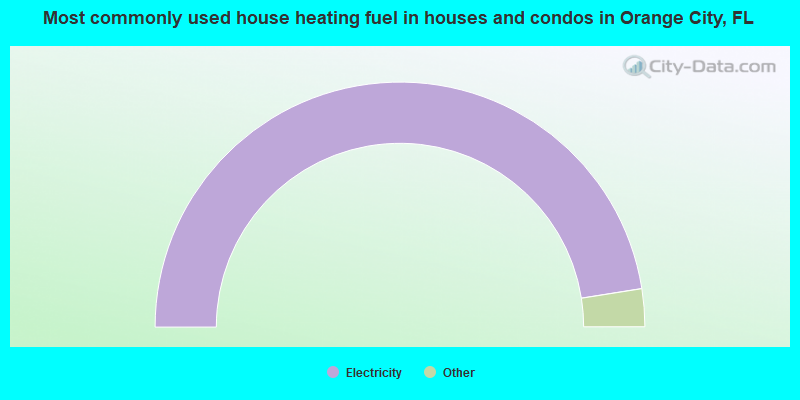
- 95.0%Electricity
- 2.4%Bottled, tank, or LP gas
- 1.0%Solar energy
- 0.9%No fuel used
- 0.7%Utility gas
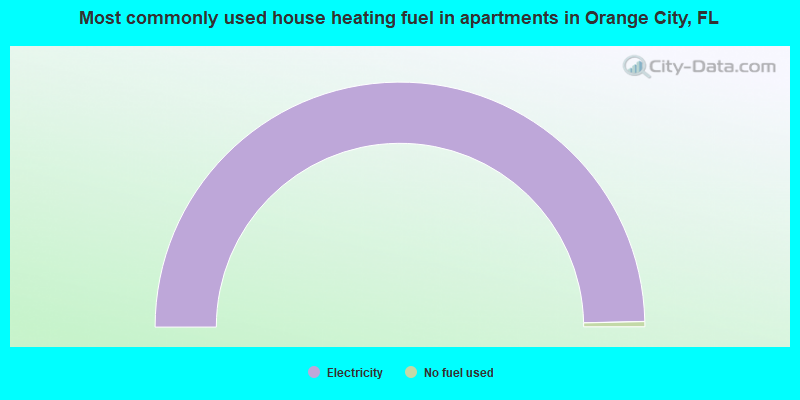
- 99.3%Electricity
- 0.7%No fuel used
Private vs. public school enrollment:
| Here: | 19.5% |
| Florida: | 15.8% |
| Here: | 0.0% |
| Florida: | 12.9% |
| Here: | 28.4% |
| Florida: | 23.6% |