Orange, CT (Connecticut) Houses and Residents
| Orange: | $479,451 |
| Connecticut: | $347,200 |
Total population: 13,956 (Urban population: 12,745, Rural population: 488 (all nonfarm))
Houses: 5,462 (5,222 occupied: 4,698 owner occupied, 581 renter occupied)
| % of renters here: | 11% |
| State: | 34% |
Housing density: 318 houses/condos per square mile
Median price asked for vacant for-sale houses and condos in 2022 in this county: $371,867.
Median contract rent in 2022: $1,725 (lower quartile is $1,339, upper quartile is over $2,000)
Median rent asked for vacant for-rent units in 2022: $1,339
Median gross rent in Orange, CT in 2022: $1,934
Housing units in Orange with a mortgage: 3,063 (364 second mortgage, 6 home equity loan, 288 both second mortgage and home equity loan)
Houses without a mortgage: 245
Median household income for houses/condos with a mortgage: $158,364
Median household income for apartments without a mortgage: $125,218
Median monthly housing costs: $2,251
Compare current foreclosures near Orange, CT:
| Photo | Address | Area | Beds / Baths | Price | Details |
|---|---|---|---|---|---|

|
#1
Ridge Rd
Orange, CT 06477
|
2,653 sq. feet
|
2 baths 3 beds |
show details | |

|
#2
Racebrook Rd
Orange, CT 06477
|
1,409 sq. feet
|
2 baths 3 beds |
show details | |

|
#3
Fernbrook Rd
Orange, CT 06477
|
1,150 sq. feet
|
1 baths 2 beds |
show details | |

|
#4
Alfred Ct
Stratford, CT 06615
|
1,406 sq. feet
|
2 baths 3 beds |
$449,900
|
show details |

|
#5
Fairview Ave # U-2
Hamden, CT 06514
|
1,284 sq. feet
|
1 baths 3 beds |
$174,000
|
show details |

|
#6
Beecher Ave
Shelton, CT 06484
|
1,911 sq. feet
|
2 baths 4 beds |
$589,900
|
show details |

|
#7
Chestnut St
Naugatuck, CT 06770
|
1,012 sq. feet
|
1 baths 2 beds |
$279,900
|
show details |

|
#8
Davis Dr
Milford, CT 06460
|
1,165 sq. feet
|
1 baths 4 beds |
$454,900
|
show details |

|
#9
Santangelo Terrace #30
Derby, CT 06418
|
652 sq. feet
|
1 baths 1 beds |
$189,000
|
show details |

|
#10
Birchwood Dr
Hamden, CT 06518
|
2,604 sq. feet
|
2 baths 3 beds |
$614,900
|
show details |
| Photo | Address | Area | Beds / Baths | Price | Details |
|---|---|---|---|---|---|

|
#11
Winchester Ave
Hamden, CT 06517
|
1,820 sq. feet
|
2 baths 5 beds |
$489,900
|
show details |

|
#12
Amity Rd
Woodbridge, CT 06525
|
1,850 sq. feet
|
1 baths 3 beds |
$549,900
|
show details |

|
#13
Ellsworth St
West Haven, CT 06516
|
960 sq. feet
|
1 baths 3 beds |
$365,000
|
show details |

|
#14
Beecher Pl
East Haven, CT 06512
|
1,454 sq. feet
|
1 baths 3 beds |
$445,000
|
show details |

|
#15
Seymour Rd
New Haven, CT 06525
|
1,639 sq. feet
|
2 baths 3 beds |
$312,000
|
show details |

|
#16
N Star Dr
Seymour, CT 06483
|
1,670 sq. feet
|
2 baths 3 beds |
$424,900
|
show details |

|
#17
Lynne Pl
Bridgeport, CT 06610
|
1,152 sq. feet
|
2 baths 3 beds |
$389,900
|
show details |

|
#18
Sentinel Hill Rd
Derby, CT 06418
|
1,740 sq. feet
|
1 baths 2 beds |
$322,400
|
show details |

|
#19
Edison Rd
Orange, CT 06477
|
- sq. feet
|
- baths - beds |
show details | |

|
#20
Sasco Hill Rd
Fairfield, CT 06824
|
- sq. feet
|
5 baths 5 beds |
$6,700,000
|
show details |
| Photo | Address | Area | Beds / Baths | Price | Details |
|---|---|---|---|---|---|

|
#21
Kennedy Dr
Bridgeport, CT 06606
|
1,063 sq. feet
|
1 baths 2 beds |
$224,900
|
show details |

|
#22
Old Fairwood Rd
Bethany, CT 06524
|
2,464 sq. feet
|
3 baths 4 beds |
show details | |

|
#23
Green Hill Rd
Bethany, CT 06524
|
1,920 sq. feet
|
2 baths 3 beds |
show details | |

|
#24
Portsea St
New Haven, CT 06519
|
2,073 sq. feet
|
2 baths 4 beds |
show details | |

|
#25
Hill St
Hamden, CT 06514
|
3,439 sq. feet
|
3 baths 4 beds |
show details | |

|
#26
Winthrop Ave
New Haven, CT 06511
|
3,328 sq. feet
|
3 baths 5 beds |
show details | |

|
#27
New Haven Rd Apt 6-E
Naugatuck, CT 06770
|
1,008 sq. feet
|
1 baths 2 beds |
show details | |

|
#28
Racebrook Rd
New Haven, CT 06525
|
3,224 sq. feet
|
4 baths 4 beds |
show details | |

|
#29
Kenny Ct
East Haven, CT 06512
|
1,248 sq. feet
|
2 baths 3 beds |
show details | |

|
#30
Dover St
Bridgeport, CT 06610
|
982 sq. feet
|
1 baths 2 beds |
show details |
| Photo | Address | Area | Beds / Baths | Price | Details |
|---|---|---|---|---|---|

|
#31
Alba Ave
Bridgeport, CT 06606
|
1,680 sq. feet
|
2 baths 4 beds |
show details | |

|
#32
Dora Dr
New Haven, CT 06513
|
1,302 sq. feet
|
1 baths 3 beds |
show details | |

|
#33
Szost Dr
Fairfield, CT 06824
|
3,127 sq. feet
|
6 baths 5 beds |
show details | |

|
#34
Borrmann Rd
East Haven, CT 06512
|
1,222 sq. feet
|
2 baths 4 beds |
show details | |

|
#35
Lowin Ave
New Haven, CT 06515
|
1,722 sq. feet
|
1 baths 4 beds |
show details | |

|
#36
Maple Hill Rd
Naugatuck, CT 06770
|
1,600 sq. feet
|
2 baths 3 beds |
show details | |

|
#37
Tom Swamp Rd
Hamden, CT 06518
|
2,008 sq. feet
|
2 baths 3 beds |
show details | |

|
#38
Richard St
Milford, CT 06460
|
2,162 sq. feet
|
2 baths 3 beds |
show details | |

|
#39
High View Dr
Stratford, CT 06614
|
2,574 sq. feet
|
2 baths 4 beds |
show details | |

|
#40
Tennyson Ave
North Haven, CT 06473
|
1,278 sq. feet
|
1 baths 2 beds |
show details |
| Photo | Address | Area | Beds / Baths | Price | Details |
|---|---|---|---|---|---|

|
#41
Rocton Ave
Bridgeport, CT 06606
|
1,546 sq. feet
|
1 baths 3 beds |
show details | |

|
#42
Whiting St
Hamden, CT 06514
|
1,508 sq. feet
|
2 baths 4 beds |
show details | |

|
#43
Bowen St
Hamden, CT 06514
|
1,190 sq. feet
|
1 baths 2 beds |
show details | |

|
#44
Elm St
Monroe, CT 06468
|
2,450 sq. feet
|
2 baths 3 beds |
show details | |

|
#45
Hawthorne Ave
Derby, CT 06418
|
5,129 sq. feet
|
5 baths 7 beds |
show details | |

|
#46
Governors Hill Rd
Oxford, CT 06478
|
2,106 sq. feet
|
2 baths 3 beds |
show details | |

|
#47
82 Herkimer St
Bridgeport, CT 06604
|
- sq. feet
|
3 baths 5 beds |
show details | |

|
#48
Center St
West Haven, CT 06516
|
1,874 sq. feet
|
1 baths 4 beds |
show details | |

|
#49
Park Ave Unit 22
Bridgeport, CT 06604
|
2,296 sq. feet
|
2 baths 2 beds |
show details | |

|
Check over 1 million property listings on Foreclosure.com!
|
browse all offers | |||

Latest news about housing in Orange, CT collected exclusively by city-data.com from local newspapers, TV, and radio stations


Median year apartment built: 1984
Household type by relationship:
Households: 14,289- Male householders: 2,590 (314 living alone), Female householders: 2,622 (582 living alone)
3,362 spouses (3,327 opposite-sex spouses), 184 unmarried partners, (184 opposite-sex unmarried partners), 4,664 children (4,578 natural, 64 adopted, 21 stepchildren), 85 grandchildren, 23 brothers or sisters, 393 parents, 0 foster children, 144 other relatives, 145 non-relatives
- In group quarters: 72
Size of family households: 1,785 2-persons, 1,000 3-persons, 825 4-persons, 325 5-persons, 83 6-persons, 41 7-or-more-persons.
Size of nonfamily households: 946 1-person, 214 2-persons.
2,640 married couples with children.
455 single-parent households (111 men, 344 women).
82.7% of residents of Orange speak English at home.
2.7% of residents speak Spanish at home (74% speak English very well, 22% speak English well, 4% speak English not well).
7.3% of residents speak other Indo-European language at home (75% speak English very well, 19% speak English well, 3% speak English not well, 3% don't speak English at all).
5.1% of residents speak Asian or Pacific Island language at home (54% speak English very well, 34% speak English well, 3% speak English not well, 10% don't speak English at all).
2.3% of residents speak other language at home (78% speak English very well, 6% speak English well, 14% speak English not well, 3% don't speak English at all).
Foreign born population: 2,034 (14.2%)
(65.4% of them are naturalized citizens)
| Here: | 7.3 |
| State: | 6.5 |
| Here: | 3.4 |
| State: | 4.0 |

- Bedrooms in owner-occupied houses and condos in Orange, Connecticut
- 39no bedroom
- 781 bedroom
- 3252 bedrooms
- 2,4273 bedrooms
- 1,6154 bedrooms
- 2145+ bedrooms

- Bedrooms in renter-occupied apartments in Orange, Connecticut
- 34no bedroom
- 2081 bedroom
- 1612 bedrooms
- 1243 bedrooms
- 424 bedrooms
- 135+ bedrooms

- Cars and other vehicles available in Orange in owner-occupied houses/condos
- 137no vehicle
- 9871 vehicle
- 2,0522 vehicles
- 1,1643 vehicles
- 2484 vehicles
- 1095+ vehicles

- Cars and other vehicles available in Orange in renter-occupied apartments
- 62no vehicle
- 3161 vehicle
- 1822 vehicles
- 213 vehicles
- 04 vehicles
- 05+ vehicles

- Rooms in owner-occupied houses in Orange, Connecticut
- 391 room
- 72 rooms
- 403 rooms
- 1274 rooms
- 3595 rooms
- 7976 rooms
- 1,1567 rooms
- 1,1208 rooms
- 1,0549+ rooms

- Rooms in renter-occupied apartments in Orange, Connecticut
- 341 room
- 852 rooms
- 1743 rooms
- 854 rooms
- 705 rooms
- 526 rooms
- 317 rooms
- 388 rooms
- 139+ rooms


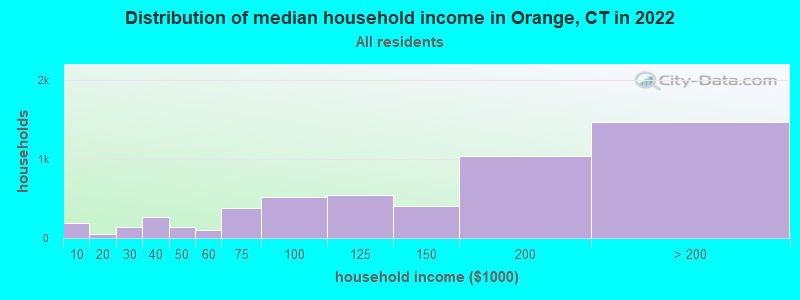
Orange, CT household income distribution

- 194Less than $10,000
- 52$10,000 to $19,999
- 144$20,000 to $29,999
- 271$30,000 to $39,999
- 141$40,000 to $49,999
- 105$50,000 to $59,999
- 375$60,000 to $74,999
- 514$75,000 to $99,999
- 542$100,000 to $124,999
- 408$125,000 to $149,999
- 1,033$150,000 to $199,999
- 1,466$200,000 or more
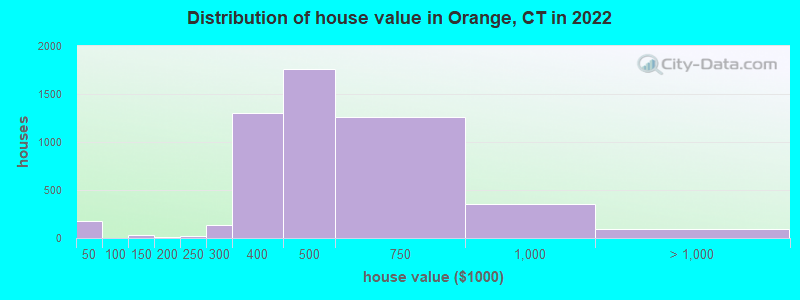
Home value of owner - occupied houses in 2022 in Orange, CT
-
- 98Less than $10,000
- 48$15,000 to $19,999
- 12$30,000 to $34,999
- 14$35,000 to $39,999
- 36$100,000 to $124,999
- 11$150,000 to $174,999
- 19$200,000 to $249,999
- 131$250,000 to $299,999
- 1,300$300,000 to $399,999
- 1,765$400,000 to $499,999
- 1,258$500,000 to $749,999
- 350$750,000 to $999,999
- 84$1,000,000 to $1,499,999
- 14$2,000,000 or more
Rent paid by renters in 2022 in Orange, CT
-
- 7$700 to $749
- 26$900 to $999
- 57$1,000 to $1,249
- 65$1,250 to $1,499
- 200$1,500 to $1,999
- 96$2,000 to $2,499
- 42$2,500 to $2,999
- 9$3,500 or more
- 73No cash rent


Percentage of workers working in this county: 64.2%
Number of people working at home: 1,055 (15.0% of all workers)
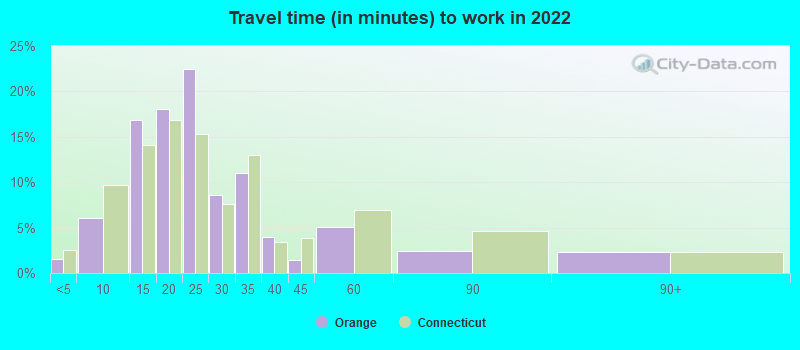
Travel time to work (commute)
- Less than 5 minutes: 55
- 5 to 9 minutes: 367
- 10 to 14 minutes: 710
- 15 to 19 minutes: 1,063
- 20 to 24 minutes: 1,595
- 25 to 29 minutes: 348
- 30 to 34 minutes: 617
- 35 to 39 minutes: 46
- 40 to 44 minutes: 164
- 45 to 59 minutes: 343
- 60 to 89 minutes: 360
- 90 or more minutes: 280
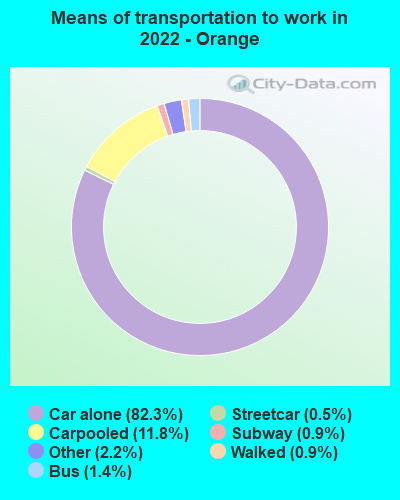
Means of transportation to work:
- Drove a car alone: 8,461 (72.6%)
- Carpooled: 1,288 (11.1%)
- Bus: 138 (1.2%)
- Subway or elevated rail: 83 (0.7%)
- Long-distance train or commuter rail: 68 (0.6%)
- Taxi: 276 (2.4%)
- Walked: 101 (0.9%)
- Worked at home: 1,055 (9.1%)

- Unemployment by race in 2022
- Unemployment rate for White non-Hispanic residents
- 2.2%Males
- 4.5%Females
- Unemployment rate for Black residents
- 3.7%Females
- Unemployment rate for Asian residents
- 1.2%Males
- 1.4%Females

- Year of entry for the foreign-born population in Orange, Connecticut
- 4102010 or later
- 4502000 to 2009
- 5121990 to 1999
- 1971980 to 1989
- 901970 to 1979
- 465Before 1970

First ancestries reported:
- Italian: 1,381 (22.9%)
- Irish: 858 (14.2%)
- American: 301 (5.0%)
- Polish: 169 (2.8%)
- German: 164 (2.7%)
- Portuguese: 142 (2.4%)
- English: 129 (2.1%)
- Scottish: 110 (1.8%)
- Nigerian: 103 (1.7%)
- Lebanese: 81 (1.3%)
- Russian: 78 (1.3%)
- Czechoslovakian: 76 (1.3%)
- Ukrainian: 62 (1.0%)
- Ethiopian: 56 (0.9%)
- Swedish: 56 (0.9%)
- Greek: 50 (0.8%)
- Serbian: 49 (0.8%)
- European: 48 (0.8%)
- Hungarian: 46 (0.8%)
- Turkish: 41 (0.7%)
- French: 38 (0.6%)
- French Canadian: 33 (0.5%)
- Welsh: 31 (0.5%)
- Czech: 26 (0.4%)
- Liberian: 20 (0.3%)
- Armenian: 18 (0.3%)
- Cape Verdean: 14 (0.2%)
- Jamaican: 12 (0.2%)
- British: 12 (0.2%)
- Romanian: 11 (0.2%)
- Dutch: 9 (0.1%)
- Danish: 9 (0.1%)
- Northern European: 8 (0.1%)
- Syrian: 7 (0.1%)
- Lithuanian: 7 (0.1%)
- Assyrian: 6 (0.10%)
- New Zealander: 4 (0.07%)
- Slovak: 4 (0.07%)
Most common places of birth for foreign-born residents (%):
| Orange: | 17.0% (345) |
| Connecticut: | 4.4% (24,001) |
| Orange: | 8.1% (165) |
| Connecticut: | 0.3% (1,703) |
| Orange: | 7.3% (149) |
| Connecticut: | 7.5% (40,568) |
| Orange: | 4.8% (97) |
| Connecticut: | 2.8% (15,141) |
| Orange: | 4.3% (88) |
| Connecticut: | 7.3% (39,879) |
| Orange: | 4.3% (88) |
| Connecticut: | 0.2% (939) |
| Orange: | 3.5% (72) |
| Connecticut: | 0.9% (5,088) |
| Orange: | 3.5% (72) |
| Connecticut: | 0.2% (1,272) |
| Orange: | 3.5% (71) |
| Connecticut: | 1.7% (9,214) |
| Orange: | 3.3% (67) |
| Connecticut: | 1.4% (7,495) |
| Orange: | 3.0% (62) |
| Connecticut: | 0.5% (2,530) |
| Orange: | 3.0% (61) |
| Connecticut: | 4.4% (24,026) |
| Orange: | 3.0% (61) |
| Connecticut: | 5.0% (27,361) |
| Orange: | 2.9% (58) |
| Connecticut: | 1.2% (6,448) |
| Orange: | 1.9% (39) |
| Connecticut: | 0.6% (3,109) |
| Orange: | 1.8% (36) |
| Connecticut: | 0.6% (3,115) |
| Orange: | 1.7% (35) |
| Connecticut: | 0.0% (83) |
| Orange: | 1.7% (34) |
| Connecticut: | 0.1% (324) |
| Orange: | 1.6% (32) |
| Connecticut: | 0.1% (360) |
Place of birth for U.S.-born residents:
- This state: 9,184
- Other state: 2,866
- Northeast: 2,021
- Midwest: 391
- South: 237
- West: 228
93.7% of Orange residents lived in the same house 1 years ago.
Out of people who lived in different houses, 24.5% lived in this county.
Out of people who lived in different counties, 33.7% lived in Connecticut.
| Orange: | 93.7% |
| State average: | 88.4% |
Education attainment for males 25 years and older:
- No schooling: 94
- Nursery to 4th grade: 5
- 5th and 6th grade: 0
- 7th and 8th grade: 23
- 9th grade: 0
- 10th grade: 0
- 11th grade: 7
- 12th grade, no diploma: 43
- High school graduate (or equivalency): 933
- Less than 1 year of college: 104
- Some college more than 1 year, no degree: 413
- Associate degree: 289
- Bachelor's degree: 1,310
- Master's degree: 902
- Professional school degree: 310
- Doctorate degree: 192

Education attainment for females 25 years and older:
- No schooling: 34
- Nursery to 4th grade: 0
- 5th and 6th grade: 0
- 7th and 8th grade: 40
- 9th grade: 0
- 10th grade: 21
- 11th grade: 8
- 12th grade, no diploma: 0
- High school graduate (or equivalency): 885
- Less than 1 year of college: 163
- Some college more than 1 year, no degree: 513
- Associate degree: 457
- Bachelor's degree: 1,561
- Master's degree: 1,267
- Professional school degree: 274
- Doctorate degree: 149


Housing units in structures:
- One, detached: 4,851
- One, attached: 104
- Two: 120
- 3 or 4: 31
- 5 to 9: 10
- 10 to 19: 101
- 20 to 49: 184
- 50 or more: 49
- Mobile homes: 10
Housing units lacking complete kitchen facilities in 2022: 1.2%
House/condo owner moved in on average 14 years ago
Renter moved in on average 3 years ago

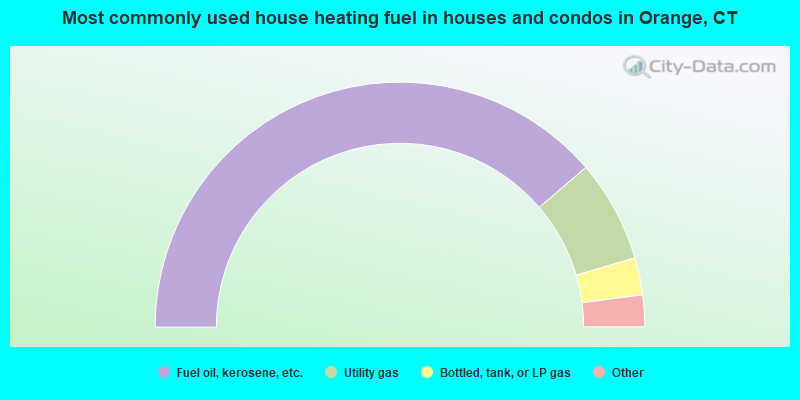
- 77.5%Fuel oil, kerosene, etc.
- 13.5%Utility gas
- 4.9%Bottled, tank, or LP gas
- 2.4%Electricity
- 0.9%Wood
- 0.6%Other fuel
- 0.2%No fuel used
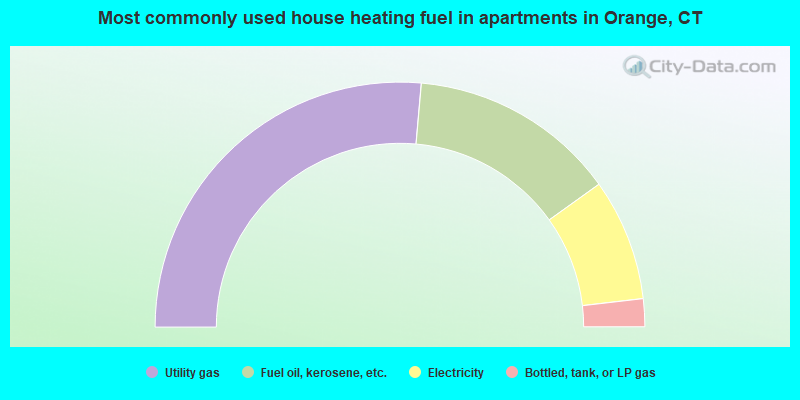
- 52.8%Utility gas
- 27.4%Fuel oil, kerosene, etc.
- 16.1%Electricity
- 3.7%Bottled, tank, or LP gas
Private vs. public school enrollment:
| Here: | 4.5% |
| Connecticut: | 9.5% |
| Here: | 20.4% |
| Connecticut: | 12.9% |
| Here: | 32.3% |
| Connecticut: | 35.5% |


