Orangeburg, SC (South Carolina) Houses and Residents
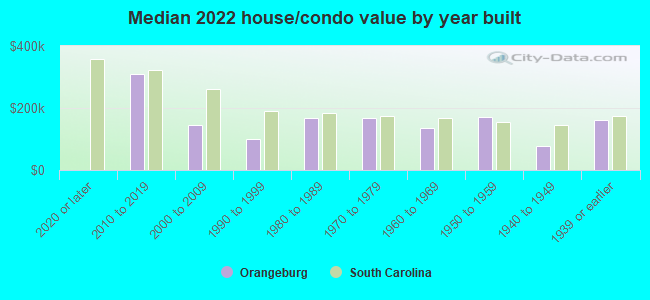
| Orangeburg: | $166,104 |
| South Carolina: | $254,600 |
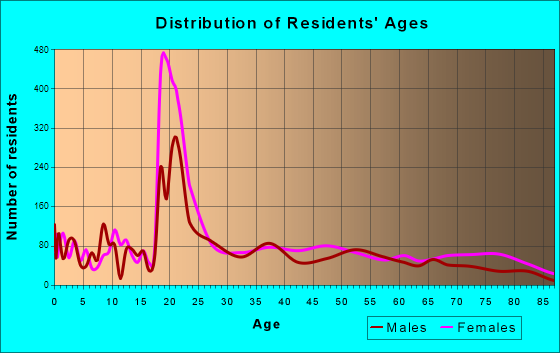
Total population: 13,553 (Urban population: 12,968 (all inside urban clusters), Rural population: 8 (all nonfarm))
Houses: 6,260 (5,000 occupied: 2,324 owner occupied, 2,797 renter occupied)
| % of renters here: | 55% |
| State: | 28% |
Housing density: 755 houses/condos per square mile
Median price asked for vacant for-sale houses and condos in 2022: $74,651.
Median contract rent in 2022: $540 (lower quartile is $304, upper quartile is $680)
Median rent asked for vacant for-rent units in 2022: $1,574
Median gross rent in Orangeburg, SC in 2022: $707
Housing units in Orangeburg with a mortgage: 1,123 (29 second mortgage, 0 home equity loan, 24 both second mortgage and home equity loan)
Houses without a mortgage: 4
Median household income for houses/condos with a mortgage: $52,287
Median household income for apartments without a mortgage: $56,632
Median monthly housing costs: $660
Compare current foreclosures in Orangeburg, SC:
| Photo | Address | Area | Beds / Baths | Price | Details |
|---|---|---|---|---|---|

|
#1
Belleville Rd
Orangeburg, SC 29115
|
1,945 sq. feet
|
2 baths 3 beds |
show details | |

|
#2
Deer Crossing Rd
Orangeburg, SC 29118
|
1,296 sq. feet
|
2 baths 3 beds |
show details | |

|
#3
Mount Gilead Dr
Orangeburg, SC 29118
|
1,575 sq. feet
|
2 baths 4 beds |
show details | |

|
#4
Belleville Rd
Orangeburg, SC 29118
|
2,204 sq. feet
|
2 baths 3 beds |
show details | |

|
#5
Ginger Lake Dr
Orangeburg, SC 29118
|
2,265 sq. feet
|
2 baths 3 beds |
show details | |

|
#6
Rutledge Ave
Orangeburg, SC 29115
|
2,532 sq. feet
|
2 baths 3 beds |
show details | |

|
#7
Wildwood Dr
Orangeburg, SC 29115
|
1,485 sq. feet
|
2 baths 3 beds |
show details | |

|
#8
Lancelot Dr
Orangeburg, SC 29115
|
1,075 sq. feet
|
1 baths 3 beds |
show details | |

|
#9
Eastwood Cir
Orangeburg, SC 29118
|
960 sq. feet
|
1 baths 3 beds |
show details | |

|
#10
Prescott St
Orangeburg, SC 29115
|
888 sq. feet
|
1 baths 3 beds |
show details |
| Photo | Address | Area | Beds / Baths | Price | Details |
|---|---|---|---|---|---|

|
#11
Koller Rd
Orangeburg, SC 29118
|
2,510 sq. feet
|
3 baths 4 beds |
show details | |

|
#12
Russell St
Orangeburg, SC 29115
|
1,808 sq. feet
|
1 baths 3 beds |
show details | |

|
#13
Shillings Bridge Rd
Orangeburg, SC 29115
|
1,008 sq. feet
|
1 baths 3 beds |
show details | |

|
#14
Savant St
Orangeburg, SC 29115
|
1,216 sq. feet
|
1 baths 2 beds |
show details | |

|
#15
Tecza Dr
Orangeburg, SC 29115
|
1,375 sq. feet
|
2 baths 3 beds |
show details | |

|
#16
Mimosa Dr
Orangeburg, SC 29115
|
1,993 sq. feet
|
2 baths 3 beds |
show details | |

|
#17
Sheppard Rd
Orangeburg, SC 29118
|
1,563 sq. feet
|
2 baths 3 beds |
show details | |

|
#18
Dubois Dr
Orangeburg, SC 29118
|
1,680 sq. feet
|
2 baths 3 beds |
show details | |

|
#19
Stilton Rd
Orangeburg, SC 29115
|
2,248 sq. feet
|
1 baths 3 beds |
show details | |

|
#20
Sparklewood Dr
Orangeburg, SC 29115
|
1,344 sq. feet
|
2 baths 3 beds |
show details |
| Photo | Address | Area | Beds / Baths | Price | Details |
|---|---|---|---|---|---|

|
#21
Dellwood Dr
Orangeburg, SC 29115
|
1,420 sq. feet
|
3 baths 4 beds |
show details | |

|
#22
Point View Dr
Orangeburg, SC 29115
|
1,848 sq. feet
|
2 baths 3 beds |
show details | |

|
#23
Gramling Rd
Orangeburg, SC 29115
|
1,196 sq. feet
|
1 baths 2 beds |
show details | |

|
#24
Riggs St
Orangeburg, SC 29115
|
1,104 sq. feet
|
1 baths 3 beds |
show details | |

|
#25
Wells Dr
Orangeburg, SC 29115
|
3,226 sq. feet
|
4 baths 4 beds |
show details | |

|
#26
Main Trail Rd
Orangeburg, SC 29118
|
920 sq. feet
|
2 baths 3 beds |
show details | |

|
#27
Alva St
Orangeburg, SC 29115
|
952 sq. feet
|
2 baths 3 beds |
show details | |

|
#28
Blossom Rd
Orangeburg, SC 29115
|
1,626 sq. feet
|
1 baths 3 beds |
show details | |

|
#29
Whittaker Pkwy
Orangeburg, SC 29115
|
1,464 sq. feet
|
2 baths 4 beds |
show details | |

|
#30
Columbia Rd
Orangeburg, SC 29118
|
1,568 sq. feet
|
2 baths 3 beds |
show details |
| Photo | Address | Area | Beds / Baths | Price | Details |
|---|---|---|---|---|---|

|
#31
Quick St
Orangeburg, SC 29115
|
640 sq. feet
|
1 baths 2 beds |
show details | |

|
#32
Padgett Ct
Orangeburg, SC 29115
|
2,232 sq. feet
|
2 baths 3 beds |
show details | |

|
#33
Middlepen Rd
Orangeburg, SC 29115
|
1,050 sq. feet
|
1 baths 3 beds |
show details | |

|
#34
Palm Harbor Dr
Orangeburg, SC 29115
|
1,464 sq. feet
|
2 baths 3 beds |
show details | |

|
#35
Carolina Ave
Orangeburg, SC 29115
|
1,735 sq. feet
|
2 baths 3 beds |
show details | |

|
#36
Manning St
Orangeburg, SC 29115
|
1,025 sq. feet
|
1 baths 3 beds |
show details | |

|
#37
Cottonwood Dr
Orangeburg, SC 29118
|
1,815 sq. feet
|
2 baths 3 beds |
show details | |

|
#38
Copper Rd
Orangeburg, SC 29115
|
1,972 sq. feet
|
2 baths 3 beds |
show details | |

|
#39
Sweet Maple Dr
Orangeburg, SC 29118
|
2,223 sq. feet
|
2 baths 3 beds |
show details | |

|
#40
Eastwood Cir
Orangeburg, SC 29118
|
960 sq. feet
|
1 baths 3 beds |
show details |
| Photo | Address | Area | Beds / Baths | Price | Details |
|---|---|---|---|---|---|

|
#41
Tall Pines Dr
Orangeburg, SC 29115
|
1,200 sq. feet
|
2 baths 3 beds |
show details | |

|
#42
Jade Cir
Orangeburg, SC 29115
|
3,436 sq. feet
|
2 baths 3 beds |
show details | |

|
#43
Belleville Rd
Orangeburg, SC 29118
|
2,013 sq. feet
|
1 baths 3 beds |
show details | |

|
#44
Jade Cir
Orangeburg, SC 29115
|
2,193 sq. feet
|
2 baths 3 beds |
show details | |

|
#45
Cameron Rd
Orangeburg, SC 29115
|
2,720 sq. feet
|
2 baths 3 beds |
show details | |

|
#46
Broughton St
Orangeburg, SC 29115
|
2,664 sq. feet
|
3 baths 4 beds |
show details | |

|
#47
Gospel Hill Ct # No13
Orangeburg, SC 29115
|
1,960 sq. feet
|
2 baths 3 beds |
show details | |

|
#48
Stillwood Cir
Orangeburg, SC 29118
|
1,636 sq. feet
|
2 baths 3 beds |
show details | |

|
#49
Hodges Dr
Orangeburg, SC 29118
|
2,443 sq. feet
|
3 baths 4 beds |
show details | |

|
Check over 1 million property listings on Foreclosure.com!
|
browse all offers | |||

Latest news about housing in Orangeburg, SC collected exclusively by city-data.com from local newspapers, TV, and radio stations

 | South Carolina Urban Planning Thread (107 replies) |
| Orangeburg... (48 replies) |
| SC #1 for 2023 population growth rate (323 replies) |
| Charleston is old and busted. Greenville is the new hotness. (717 replies) |
| What will Charleston and the surrounding area be like 10 years from now? (105 replies) |
| What's New or Coming To Sumter (2744 replies) |
Median year apartment built: 1974
Household type by relationship:
Households: 13,052- Male householders: 1,945 (1,004 living alone), Female householders: 2,969 (1,338 living alone)
1,260 spouses (1,240 opposite-sex spouses), 327 unmarried partners, (321 opposite-sex unmarried partners), 2,612 children (2,585 natural, 26 adopted, 0 stepchildren), 400 grandchildren, 247 brothers or sisters, 102 parents, 0 foster children, 161 other relatives, 193 non-relatives
- In group quarters: 2,829
Size of family households: 1,278 2-persons, 749 3-persons, 307 4-persons, 34 5-persons, 47 6-persons, 11 7-or-more-persons.
Size of nonfamily households: 2,370 1-person, 341 2-persons, 11 3-persons.
489 married couples with children.
964 single-parent households (28 men, 936 women).
96.3% of residents of Orangeburg speak English at home.
1.4% of residents speak Spanish at home (87% speak English very well, 13% speak English well).
0.1% of residents speak other Indo-European language at home (100% speak English very well).
1.3% of residents speak Asian or Pacific Island language at home (44% speak English very well, 34% speak English well, 11% speak English not well, 11% don't speak English at all).
0.5% of residents speak other language at home (100% speak English very well).
Foreign born population: 470 (3.6%)
(10.6% of them are naturalized citizens)
| Here: | 6.3 |
| State: | 6.4 |
| Here: | 3.7 |
| State: | 4.5 |
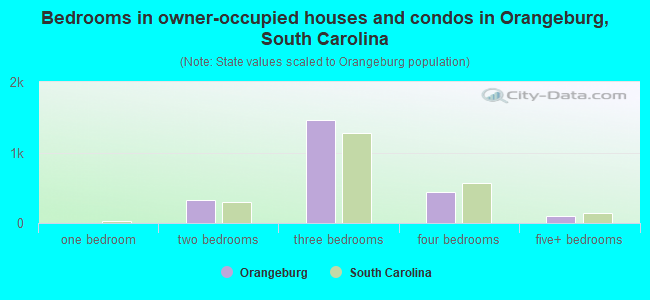
- Bedrooms in owner-occupied houses and condos in Orangeburg, South Carolina
- 0no bedroom
- 01 bedroom
- 3292 bedrooms
- 1,4653 bedrooms
- 4354 bedrooms
- 955+ bedrooms
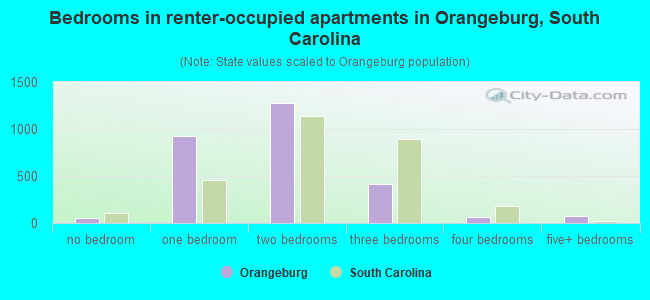
- Bedrooms in renter-occupied apartments in Orangeburg, South Carolina
- 49no bedroom
- 9271 bedroom
- 1,2762 bedrooms
- 4133 bedrooms
- 604 bedrooms
- 735+ bedrooms
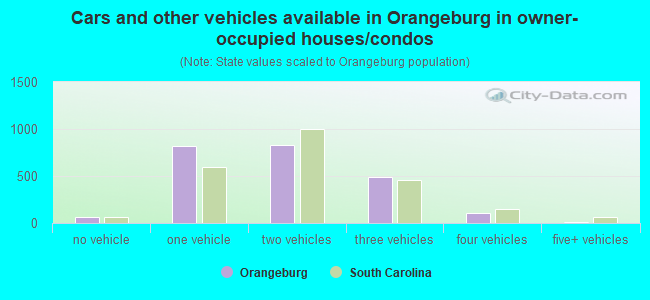
- Cars and other vehicles available in Orangeburg in owner-occupied houses/condos
- 67no vehicle
- 8201 vehicle
- 8292 vehicles
- 4873 vehicles
- 1104 vehicles
- 115+ vehicles
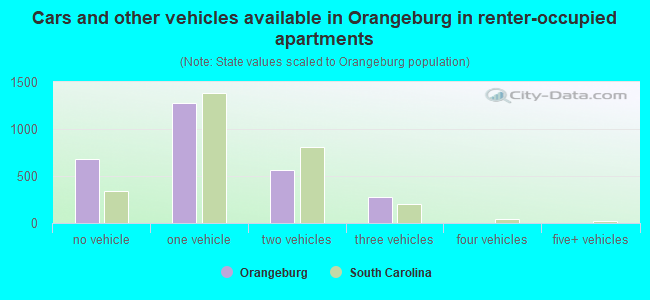
- Cars and other vehicles available in Orangeburg in renter-occupied apartments
- 676no vehicle
- 1,2771 vehicle
- 5632 vehicles
- 2773 vehicles
- 54 vehicles
- 05+ vehicles
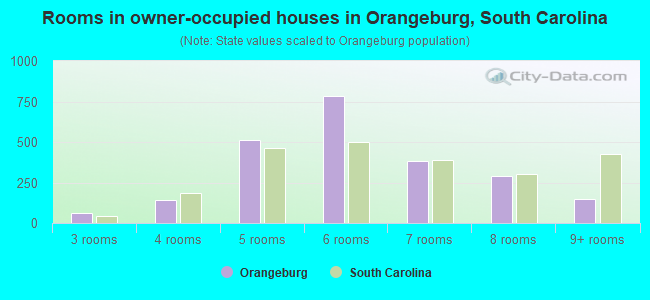
- Rooms in owner-occupied houses in Orangeburg, South Carolina
- 01 room
- 02 rooms
- 633 rooms
- 1414 rooms
- 5105 rooms
- 7876 rooms
- 3847 rooms
- 2938 rooms
- 1469+ rooms
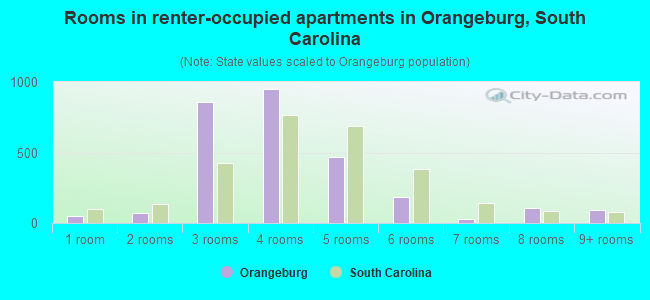
- Rooms in renter-occupied apartments in Orangeburg, South Carolina
- 491 room
- 692 rooms
- 8563 rooms
- 9484 rooms
- 4665 rooms
- 1876 rooms
- 267 rooms
- 1038 rooms
- 949+ rooms
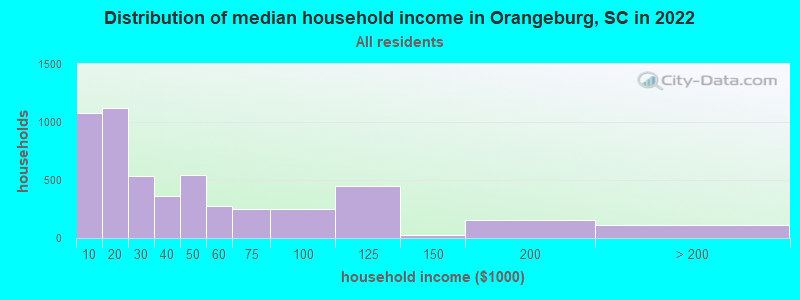
Orangeburg, SC household income distribution

- 1,080Less than $10,000
- 1,121$10,000 to $19,999
- 534$20,000 to $29,999
- 359$30,000 to $39,999
- 546$40,000 to $49,999
- 272$50,000 to $59,999
- 248$60,000 to $74,999
- 249$75,000 to $99,999
- 446$100,000 to $124,999
- 30$125,000 to $149,999
- 156$150,000 to $199,999
- 110$200,000 or more
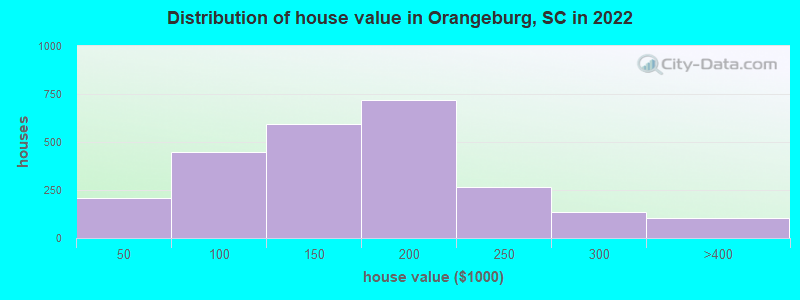
Home value of owner - occupied houses in 2022 in Orangeburg, SC
-
- 10Less than $10,000
- 5$15,000 to $19,999
- 16$20,000 to $24,999
- 17$25,000 to $29,999
- 71$30,000 to $34,999
- 45$35,000 to $39,999
- 40$40,000 to $49,999
- 29$50,000 to $59,999
- 110$60,000 to $69,999
- 69$70,000 to $79,999
- 72$80,000 to $89,999
- 123$90,000 to $99,999
- 360$100,000 to $124,999
- 233$125,000 to $149,999
- 482$150,000 to $174,999
- 235$175,000 to $199,999
- 264$200,000 to $249,999
- 135$250,000 to $299,999
- 94$300,000 to $399,999
- 11$500,000 to $749,999
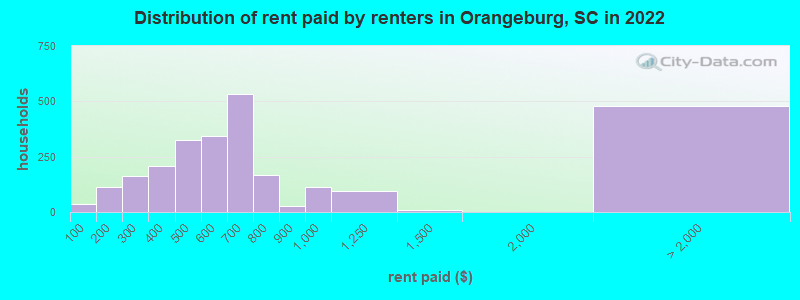
Rent paid by renters in 2022 in Orangeburg, SC
-
- 34Less than $100
- 72$100 to $149
- 37$150 to $199
- 101$200 to $249
- 60$250 to $299
- 176$300 to $349
- 30$350 to $399
- 158$400 to $449
- 167$450 to $499
- 275$500 to $549
- 66$550 to $599
- 367$600 to $649
- 166$650 to $699
- 99$700 to $749
- 65$750 to $799
- 27$800 to $899
- 112$900 to $999
- 97$1,000 to $1,249
- 11$1,250 to $1,499
- 480No cash rent
Percentage of workers working in this county: 76.1%
Number of people working at home: 616 (12.1% of all workers)
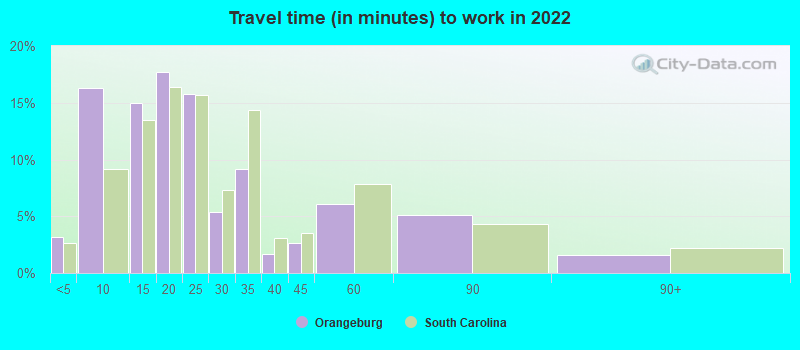
Travel time to work (commute)
- Less than 5 minutes: 162
- 5 to 9 minutes: 1,640
- 10 to 14 minutes: 875
- 15 to 19 minutes: 899
- 20 to 24 minutes: 233
- 25 to 29 minutes: 41
- 30 to 34 minutes: 451
- 35 to 39 minutes: 25
- 40 to 44 minutes: 102
- 45 to 59 minutes: 241
- 60 to 89 minutes: 248
- 90 or more minutes: 122
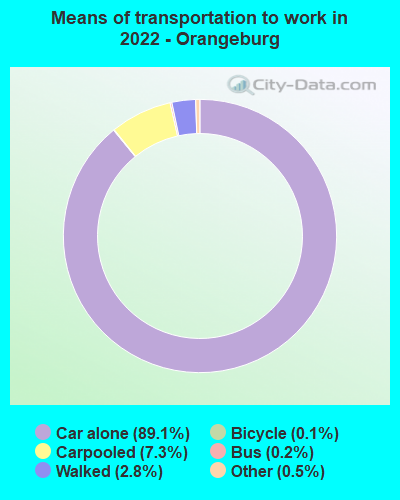
Means of transportation to work:
- Drove a car alone: 9,283 (82.3%)
- Carpooled: 792 (7.0%)
- Bus: 16 (0.1%)
- Subway or elevated rail: 3 (0.0%)
- Taxi: 52 (0.5%)
- Bicycle: 13 (0.1%)
- Walked: 266 (2.4%)
- Worked at home: 616 (5.5%)
- Unemployment by race in 2022
- Unemployment rate for White non-Hispanic residents
- 0.4%Males
- 2.9%Females
- Unemployment rate for Black residents
- 15.2%Males
- 9.0%Females
- Unemployment rate for other race residents
- 100.0%Females
- Unemployment rate for Hispanic or Latino residents
- 23.6%Females
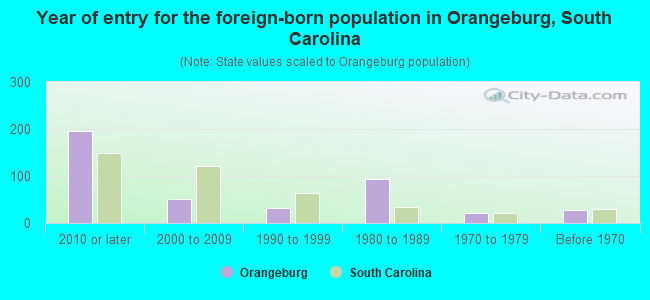
- Year of entry for the foreign-born population in Orangeburg, South Carolina
- 1952010 or later
- 512000 to 2009
- 311990 to 1999
- 941980 to 1989
- 211970 to 1979
- 27Before 1970
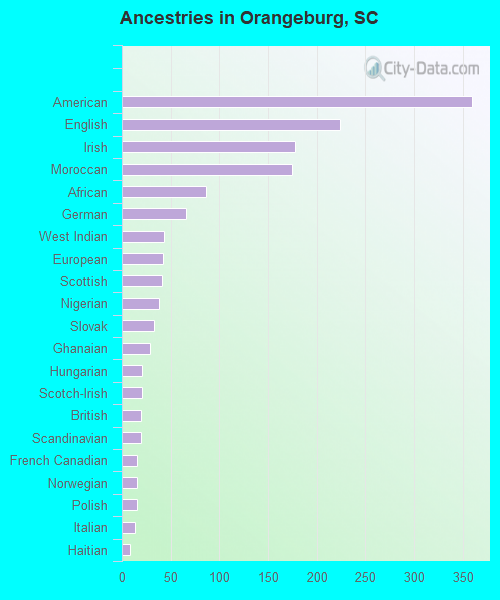
First ancestries reported:
- American: 359 (3.3%)
- English: 224 (2.0%)
- Irish: 178 (1.6%)
- Moroccan: 175 (1.6%)
- African: 86 (0.8%)
- German: 66 (0.6%)
- West Indian: 43 (0.4%)
- European: 42 (0.4%)
- Scottish: 41 (0.4%)
- Nigerian: 38 (0.3%)
- Slovak: 33 (0.3%)
- Ghanaian: 29 (0.3%)
- Hungarian: 21 (0.2%)
- Scotch-Irish: 21 (0.2%)
- British: 20 (0.2%)
- Scandinavian: 20 (0.2%)
- French Canadian: 15 (0.1%)
- Norwegian: 15 (0.1%)
- Polish: 15 (0.1%)
- Italian: 13 (0.1%)
- Haitian: 8 (0.07%)
- Palestinian: 3 (0.03%)
- Russian: 1 (0.01%)
Most common places of birth for foreign-born residents (%):
| Orangeburg: | 18.8% (52) |
| South Carolina: | 0.6% (1,652) |
| Orangeburg: | 15.6% (43) |
| South Carolina: | 1.7% (4,513) |
| Orangeburg: | 13.8% (38) |
| South Carolina: | 2.3% (6,308) |
| Orangeburg: | 9.4% (26) |
| South Carolina: | 0.2% (540) |
| Orangeburg: | 9.1% (25) |
| South Carolina: | 0.3% (701) |
| Orangeburg: | 7.6% (21) |
| South Carolina: | 0.2% (457) |
| Orangeburg: | 2.9% (8) |
| South Carolina: | 0.2% (622) |
| Orangeburg: | 2.5% (7) |
| South Carolina: | 2.6% (7,073) |
| Orangeburg: | 2.2% (6) |
| South Carolina: | 0.7% (1,840) |
| Orangeburg: | 1.8% (5) |
| South Carolina: | 0.2% (427) |
| Orangeburg: | 1.8% (5) |
| South Carolina: | 3.0% (8,193) |
Place of birth for U.S.-born residents:
- This state: 9,877
- Other state: 2,805
- Northeast: 1,218
- Midwest: 187
- South: 1,287
- West: 108
82.8% of Orangeburg residents lived in the same house 1 years ago.
Out of people who lived in different houses, 29.9% lived in this county.
Out of people who lived in different counties, 73.6% lived in South Carolina.
| Orangeburg: | 82.8% |
| State average: | 86.5% |
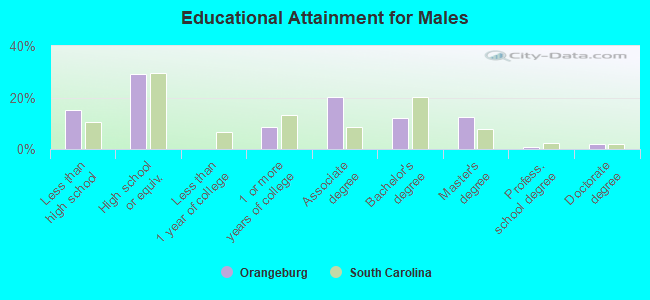
Education attainment for males 25 years and older:
- No schooling: 29
- Nursery to 4th grade: 16
- 5th and 6th grade: 35
- 7th and 8th grade: 17
- 9th grade: 202
- 10th grade: 55
- 11th grade: 43
- 12th grade, no diploma: 197
- High school graduate (or equivalency): 1,131
- Less than 1 year of college: 0
- Some college more than 1 year, no degree: 339
- Associate degree: 783
- Bachelor's degree: 460
- Master's degree: 476
- Professional school degree: 28
- Doctorate degree: 70
Education attainment for females 25 years and older:
- No schooling: 65
- Nursery to 4th grade: 58
- 5th and 6th grade: 71
- 7th and 8th grade: 49
- 9th grade: 44
- 10th grade: 104
- 11th grade: 86
- 12th grade, no diploma: 129
- High school graduate (or equivalency): 1,059
- Less than 1 year of college: 256
- Some college more than 1 year, no degree: 650
- Associate degree: 516
- Bachelor's degree: 729
- Master's degree: 525
- Professional school degree: 14
- Doctorate degree: 46

Housing units in structures:
- One, detached: 3,846
- One, attached: 148
- Two: 816
- 3 or 4: 833
- 5 to 9: 350
- 20 to 49: 79
- 50 or more: 24
- Mobile homes: 160
Housing units lacking complete kitchen facilities in 2022: 6.1%
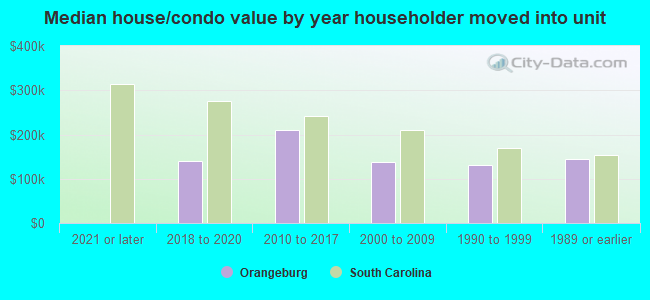
House/condo owner moved in on average 15 years ago
Renter moved in on average 1 years ago
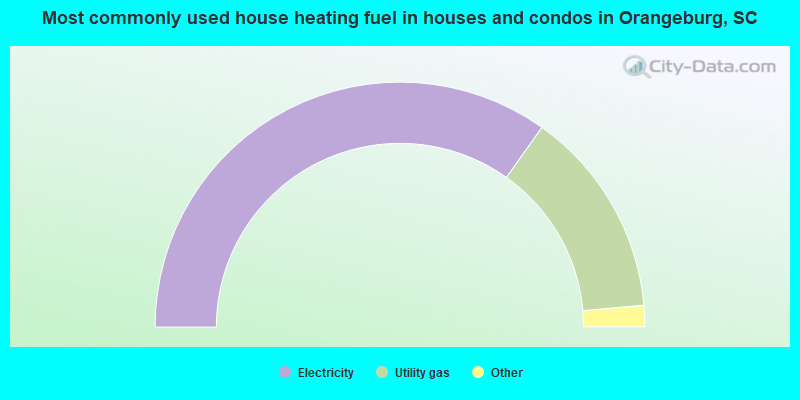
- 69.7%Electricity
- 27.5%Utility gas
- 2.1%Bottled, tank, or LP gas
- 0.7%No fuel used
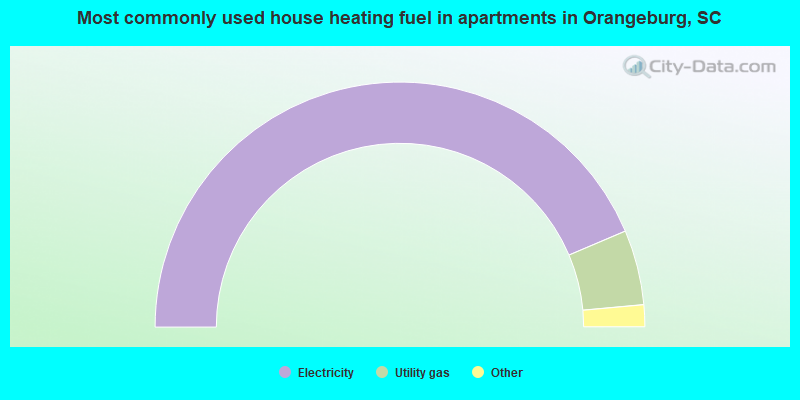
- 87.3%Electricity
- 9.9%Utility gas
- 1.6%Wood
- 0.6%Bottled, tank, or LP gas
- 0.6%No fuel used
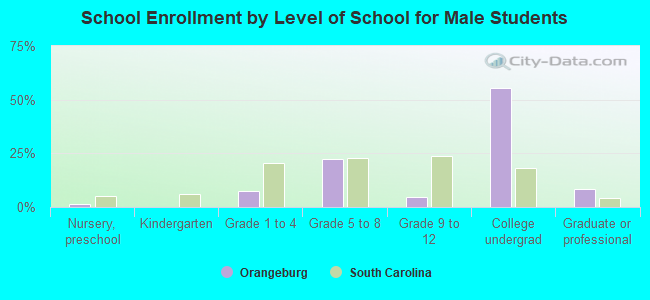
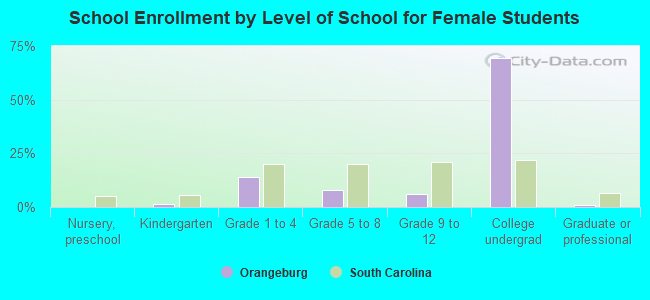
Private vs. public school enrollment:
| Here: | 7.3% |
| South Carolina: | 14.4% |
| Here: | 10.8% |
| South Carolina: | 11.1% |
| Here: | 52.6% |
| South Carolina: | 21.9% |