Orangeville, IL (Illinois) Houses and Residents
| Orangeville: | $143,215 |
| Illinois: | $251,600 |
Total population: 768 (Urban population: 0, Rural population: 756 (all nonfarm))
Houses: 479 (375 occupied: 290 owner occupied, 90 renter occupied)
| % of renters here: | 24% |
| State: | 33% |
Housing density: 746 houses/condos per square mile
Median price asked for vacant for-sale houses and condos in 2022 in this county: $85,306.
Median contract rent in 2022: $499 (lower quartile is $369, upper quartile is $585)
Median rent asked for vacant for-rent units in 2022: $970
Median gross rent in Orangeville, IL in 2022: $572
Housing units in Orangeville with a mortgage: 190 (11 second mortgage, 8 home equity loan, 1 both second mortgage and home equity loan)
Houses without a mortgage: 3
Median household income for houses/condos with a mortgage: $68,899
Median household income for apartments without a mortgage: $56,424
Median monthly housing costs: $768
Compare current foreclosures near Orangeville, IL:
| Photo | Address | Area | Beds / Baths | Price | Details |
|---|---|---|---|---|---|

|
#1
N Showers Rd
Orangeville, IL 61060
|
- sq. feet
|
- baths - beds |
show details | |

|
#2
E High St # 1
Orangeville, IL 61060
|
- sq. feet
|
- baths - beds |
show details | |

|
#3
11th Ave
Monroe, WI 53566
|
905 sq. feet
|
1 baths 2 beds |
$116,600
|
show details |

|
#4
Highview Ct
Orangeville, IL 61060
|
- sq. feet
|
- baths - beds |
show details | |

|
#5
N Whistler Ave
Freeport, IL 61032
|
1,056 sq. feet
|
2 baths 3 beds |
show details | |

|
#6
W Pleasant St
Freeport, IL 61032
|
- sq. feet
|
2 baths 4 beds |
show details | |

|
#7
W Stephenson St
Freeport, IL 61032
|
- sq. feet
|
2 baths 4 beds |
show details | |

|
#8
Iliff Rd
Monroe, WI 53566
|
- sq. feet
|
- baths - beds |
show details | |

|
#9
N Cherry Ave
Freeport, IL 61032
|
- sq. feet
|
- baths - beds |
show details | |

|
#10
S Oak Ave Apt 4
Freeport, IL 61032
|
- sq. feet
|
- baths - beds |
show details |
| Photo | Address | Area | Beds / Baths | Price | Details |
|---|---|---|---|---|---|

|
#11
S 14th Ave
Freeport, IL 61032
|
- sq. feet
|
- baths - beds |
show details | |

|
#12
W Empire St
Freeport, IL 61032
|
- sq. feet
|
- baths - beds |
show details | |

|
#13
S Walnut Ave
Freeport, IL 61032
|
- sq. feet
|
- baths - beds |
show details | |

|
#14
Empire Ct Apt 1
Freeport, IL 61032
|
- sq. feet
|
- baths - beds |
show details | |

|
#15
S Rantoul St
Lena, IL 61048
|
- sq. feet
|
- baths - beds |
show details | |

|
#16
W Winnifred St
Freeport, IL 61032
|
- sq. feet
|
- baths - beds |
show details | |

|
#17
Field Cir Apt 2
Freeport, IL 61032
|
- sq. feet
|
- baths - beds |
show details | |

|
#18
Coon Creek Rd
Browntown, WI 53522
|
- sq. feet
|
- baths - beds |
show details | |

|
#19
Best Rd
Pecatonica, IL 61063
|
- sq. feet
|
- baths - beds |
show details | |

|
#20
Airport Rd
Brodhead, WI 53520
|
- sq. feet
|
- baths - beds |
show details |
| Photo | Address | Area | Beds / Baths | Price | Details |
|---|---|---|---|---|---|

|
#21
Crazy Horse Ln, Lot 9
Brodhead, WI 53520
|
- sq. feet
|
- baths - beds |
show details | |

|
#22
21st St, Trlr 69
Brodhead, WI 53520
|
- sq. feet
|
- baths - beds |
show details | |

|
#23
Railroad Street
Woodford, WI 53599
|
- sq. feet
|
- baths - beds |
show details | |

|
#24
Railroad St
Woodford, WI 53599
|
- sq. feet
|
- baths - beds |
show details | |

|
#25
N Park Blvd Apt 210
Freeport, IL 61032
|
- sq. feet
|
- baths - beds |
show details | |

|
#26
19th St, Trlr 28
Brodhead, WI 53520
|
- sq. feet
|
- baths - beds |
show details | |

|
#27
N Willow Ave Apt 249
Freeport, IL 61032
|
- sq. feet
|
- baths - beds |
show details | |

|
#28
W Washington St
Cedarville, IL 61013
|
- sq. feet
|
- baths - beds |
show details | |

|
#29
12th Ave Apt 3
Monroe, WI 53566
|
- sq. feet
|
- baths - beds |
show details | |

|
#30
Theiler Rd
Juda, WI 53550
|
- sq. feet
|
- baths - beds |
show details |
| Photo | Address | Area | Beds / Baths | Price | Details |
|---|---|---|---|---|---|

|
#31
W 21st St Lot 61
Monroe, WI 53566
|
- sq. feet
|
- baths - beds |
show details | |

|
#32
Butts Rd
Browntown, WI 53522
|
- sq. feet
|
- baths - beds |
show details | |

|
#33
W Roosevelt St
Freeport, IL 61032
|
- sq. feet
|
- baths - beds |
show details | |

|
#34
W Garfield St
Freeport, IL 61032
|
- sq. feet
|
- baths - beds |
show details | |

|
#35
W Dewey St
Freeport, IL 61032
|
- sq. feet
|
- baths - beds |
show details | |

|
#36
S Demeter Dr
Freeport, IL 61032
|
- sq. feet
|
- baths - beds |
show details | |

|
#37
S Cedar Ave
Freeport, IL 61032
|
- sq. feet
|
- baths - beds |
show details | |

|
#38
Southgate Dr
Davis, IL 61019
|
- sq. feet
|
- baths - beds |
show details | |

|
#39
Empire Ct
Freeport, IL 61032
|
- sq. feet
|
- baths - beds |
show details | |

|
#40
S Walnut Ave
Freeport, IL 61032
|
- sq. feet
|
- baths - beds |
show details |
| Photo | Address | Area | Beds / Baths | Price | Details |
|---|---|---|---|---|---|

|
#41
N Waddams Grove Rd
Lena, IL 61048
|
- sq. feet
|
- baths - beds |
show details | |

|
#42
W Jefferson Dr
Freeport, IL 61032
|
- sq. feet
|
- baths - beds |
show details | |

|
#43
S Bidwell Ave
Freeport, IL 61032
|
- sq. feet
|
- baths - beds |
show details | |

|
#44
Us Highway 20 W
Lena, IL 61048
|
- sq. feet
|
- baths - beds |
show details | |

|
#45
W Main St
Dakota, IL 61018
|
- sq. feet
|
- baths - beds |
show details | |

|
#46
Gainsboro Rd
Davis, IL 61019
|
- sq. feet
|
- baths - beds |
show details | |

|
#47
W Pearl City Rd
Pearl City, IL 61062
|
- sq. feet
|
- baths - beds |
show details | |

|
#48
W Dublin Rd
Kent, IL 61044
|
- sq. feet
|
- baths - beds |
show details | |

|
#49
E Rock Grove Rd
Rock City, IL 61070
|
- sq. feet
|
- baths - beds |
show details | |

|
Check over 1 million property listings on Foreclosure.com!
|
browse all offers | |||

Latest news about housing in Orangeville, IL collected exclusively by city-data.com from local newspapers, TV, and radio stations


Median year apartment built: 1938
Household type by relationship:
Households: 904- Male householders: 200 (63 living alone), Female householders: 168 (48 living alone)
177 spouses (177 opposite-sex spouses), 36 unmarried partners, (36 opposite-sex unmarried partners), 295 children (243 natural, 1 adopted, 50 stepchildren), 0 grandchildren, 0 brothers or sisters, 5 parents, 4 foster children, 0 other relatives, 14 non-relatives
Size of family households: 116 2-persons, 42 3-persons, 50 4-persons, 10 5-persons, 30 6-persons.
Size of nonfamily households: 117 1-person, 13 2-persons.
142 married couples with children.
82 single-parent households (6 men, 76 women).
98.9% of residents of Orangeville speak English at home.
0.4% of residents speak Spanish at home (67% speak English very well, 33% speak English not well).
| Here: | 6.8 |
| State: | 6.4 |
| Here: | 4.2 |
| State: | 4.1 |

- Bedrooms in owner-occupied houses and condos in Orangeville, Illinois
- 0no bedroom
- 01 bedroom
- 502 bedrooms
- 1453 bedrooms
- 534 bedrooms
- 435+ bedrooms

- Bedrooms in renter-occupied apartments in Orangeville, Illinois
- 8no bedroom
- 271 bedroom
- 382 bedrooms
- 173 bedrooms
- 04 bedrooms
- 05+ bedrooms

- Cars and other vehicles available in Orangeville in owner-occupied houses/condos
- 23no vehicle
- 601 vehicle
- 1282 vehicles
- 753 vehicles
- 34 vehicles
- 05+ vehicles

- Cars and other vehicles available in Orangeville in renter-occupied apartments
- 5no vehicle
- 521 vehicle
- 232 vehicles
- 73 vehicles
- 04 vehicles
- 35+ vehicles

- Rooms in owner-occupied houses in Orangeville, Illinois
- 01 room
- 02 rooms
- 33 rooms
- 254 rooms
- 445 rooms
- 606 rooms
- 447 rooms
- 428 rooms
- 729+ rooms

- Rooms in renter-occupied apartments in Orangeville, Illinois
- 01 room
- 202 rooms
- 173 rooms
- 104 rooms
- 255 rooms
- 106 rooms
- 07 rooms
- 28 rooms
- 59+ rooms


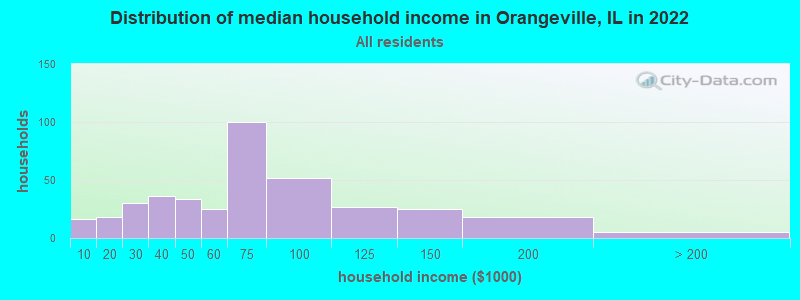
Orangeville, IL household income distribution

- 16Less than $10,000
- 18$10,000 to $19,999
- 30$20,000 to $29,999
- 36$30,000 to $39,999
- 34$40,000 to $49,999
- 25$50,000 to $59,999
- 100$60,000 to $74,999
- 52$75,000 to $99,999
- 27$100,000 to $124,999
- 25$125,000 to $149,999
- 18$150,000 to $199,999
- 5$200,000 or more
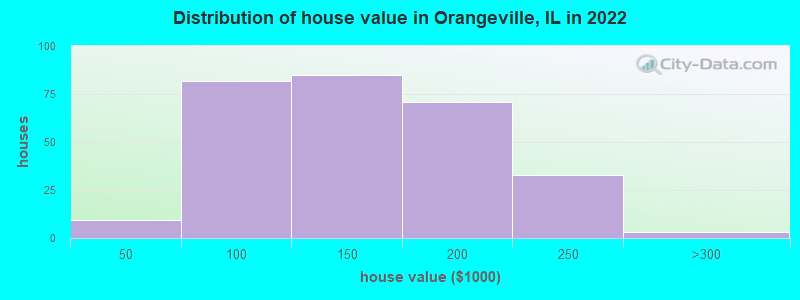
Home value of owner - occupied houses in 2022 in Orangeville, IL
-
- 1$30,000 to $34,999
- 7$40,000 to $49,999
- 6$50,000 to $59,999
- 19$60,000 to $69,999
- 24$70,000 to $79,999
- 10$80,000 to $89,999
- 13$90,000 to $99,999
- 28$100,000 to $124,999
- 56$125,000 to $149,999
- 56$150,000 to $174,999
- 14$175,000 to $199,999
- 32$200,000 to $249,999
- 3$250,000 to $299,999
Rent paid by renters in 2022 in Orangeville, IL
-
- 4$200 to $249
- 10$300 to $349
- 19$350 to $399
- 9$400 to $449
- 2$450 to $499
- 22$500 to $549
- 5$550 to $599
- 4$600 to $649
- 6$700 to $749
- 9$800 to $899


Percentage of workers working in this county: 60.4%
Number of people working at home: 24 (5.5% of all workers)
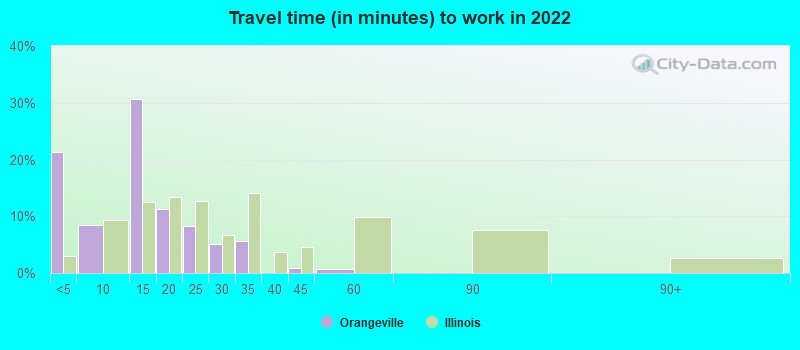
Travel time to work (commute)
- Less than 5 minutes: 31
- 5 to 9 minutes: 1
- 10 to 14 minutes: 35
- 15 to 19 minutes: 85
- 20 to 24 minutes: 136
- 25 to 29 minutes: 48
- 30 to 34 minutes: 22
- 35 to 39 minutes: 9
- 40 to 44 minutes: 2
- 45 to 59 minutes: 2
- 60 to 89 minutes: 17
- 90 or more minutes: 8
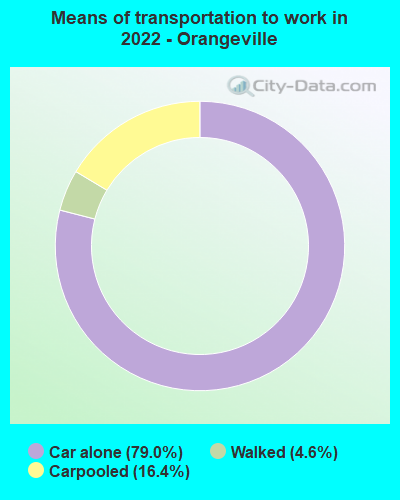
Means of transportation to work:
- Drove a car alone: 227 (71.2%)
- Carpooled: 38 (11.9%)
- Walked: 10 (3.1%)
- Worked at home: 43 (13.5%)

- Unemployment by race in 2022
- Unemployment rate for White non-Hispanic residents
- 10.2%Males
- 10.3%Females

- Year of entry for the foreign-born population in Orangeville, Illinois
- 01995 to March 2000
- 21990 to 1994
- 01985 to 1989
- 61980 to 1984
- 01975 to 1979
- 01970 to 1974
- 01965 to 1969
- 0Before 1965

First ancestries reported:
- German: 181 (57.7%)
- American: 54 (17.2%)
- English: 21 (6.7%)
- Norwegian: 20 (6.4%)
- Polish: 10 (3.2%)
- Irish: 8 (2.6%)
- Swiss: 7 (2.2%)
- European: 4 (1.3%)
- Dutch: 2 (0.6%)
- Italian: 2 (0.6%)
- Scandinavian: 1 (0.3%)
- Scottish: 1 (0.3%)
Most common places of birth for foreign-born residents (%):
| Orangeville: | 37.5% (3) |
| Illinois: | 1.8% (27,506) |
| Orangeville: | 37.5% (3) |
| Illinois: | 1.3% (20,121) |
| Orangeville: | 25.0% (2) |
| Illinois: | 0.1% (1,884) |
Place of birth for U.S.-born residents:
- This state: 532
- Other state: 368
- Northeast: 2
- Midwest: 355
- South: 10
- West: 4
94.3% of Orangeville residents lived in the same house 1 years ago.
Out of people who lived in different houses, 31.1% lived in this county.
Out of people who lived in different counties, 12.5% lived in Illinois.
| Orangeville: | 94.3% |
| State average: | 88.3% |
Education attainment for males 25 years and older:
- No schooling: 2
- Nursery to 4th grade: 0
- 5th and 6th grade: 0
- 7th and 8th grade: 0
- 9th grade: 8
- 10th grade: 2
- 11th grade: 7
- 12th grade, no diploma: 12
- High school graduate (or equivalency): 104
- Less than 1 year of college: 11
- Some college more than 1 year, no degree: 55
- Associate degree: 45
- Bachelor's degree: 31
- Master's degree: 14
- Professional school degree: 2
- Doctorate degree: 3

Education attainment for females 25 years and older:
- No schooling: 4
- Nursery to 4th grade: 0
- 5th and 6th grade: 0
- 7th and 8th grade: 0
- 9th grade: 0
- 10th grade: 0
- 11th grade: 4
- 12th grade, no diploma: 5
- High school graduate (or equivalency): 75
- Less than 1 year of college: 43
- Some college more than 1 year, no degree: 46
- Associate degree: 55
- Bachelor's degree: 40
- Master's degree: 5
- Professional school degree: 0
- Doctorate degree: 2


Housing units in structures:
- One, detached: 296
- One, attached: 12
- Two: 30
- 3 or 4: 113
- 5 to 9: 25
- 10 to 19: 2
House/condo owner moved in on average 14 years ago
Renter moved in on average 6 years ago

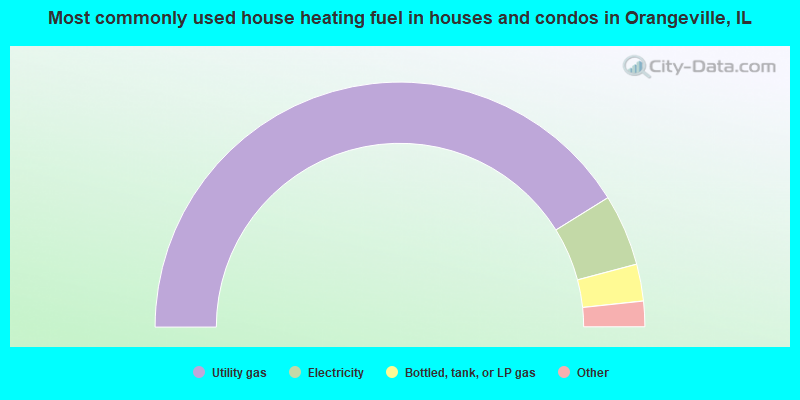
- 82.8%Utility gas
- 9.5%Electricity
- 4.9%Bottled, tank, or LP gas
- 2.1%Fuel oil, kerosene, etc.
- 0.7%Other fuel
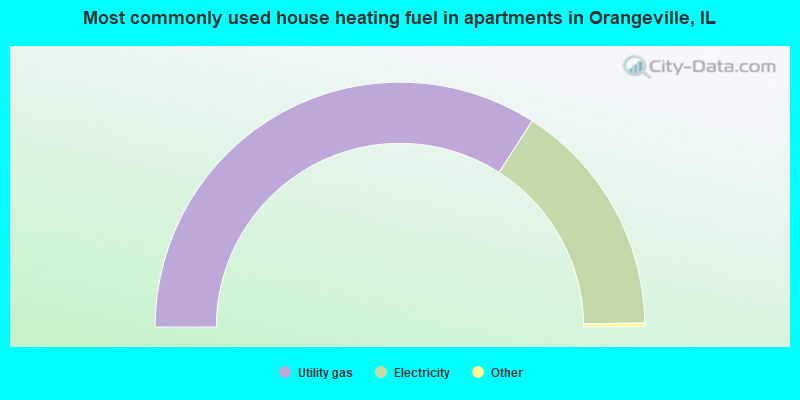
- 68.5%Utility gas
- 31.5%Electricity
Private vs. public school enrollment:
| Here: | 5.9% |
| Illinois: | 13.3% |
| Here: | 0.0% |
| Illinois: | 9.9% |
| Here: | 0.0% |
| Illinois: | 27.4% |


