Oreland, PA (Pennsylvania) Houses and Residents
| Oreland: | $417,854 |
| Pennsylvania: | $245,500 |
Mean price in 2022:
Detached houses: $413,198
Here: $413,198 State: $317,202 Townhouses or other attached units: $237,157
Here: $237,157 State: $254,369
Total population: 5,678 (Urban population: 5,404, Rural population: 0)
Houses: 2,318 (2,287 occupied: 1,991 owner occupied, 310 renter occupied)
| % of renters here: | 13% |
| State: | 31% |
Housing density: 1,604 houses/condos per square mile
Median price asked for vacant for-sale houses and condos in 2022 in this county: $277,563.
Median contract rent in 2022: $1,134 (lower quartile is $1,001, upper quartile is $1,230)
Median rent asked for vacant for-rent units in 2022: $1,056
Median gross rent in Oreland, PA in 2022: $1,284
Housing units in Oreland with a mortgage: 1,336 (152 second mortgage, 0 home equity loan, 146 both second mortgage and home equity loan)
Houses without a mortgage: 50
Median household income for houses/condos with a mortgage: $118,270
Median household income for apartments without a mortgage: $102,517
Median monthly housing costs: $1,799
Compare current foreclosures near Oreland, PA:
| Photo | Address | Area | Beds / Baths | Price | Details |
|---|---|---|---|---|---|

|
#1
Kingston Rd
Oreland, PA 19075
|
1,625 sq. feet
|
1 baths 3 beds |
show details | |

|
#2
Garth Rd
Oreland, PA 19075
|
2,158 sq. feet
|
1 baths 3 beds |
show details | |

|
#3
Bruce Rd
Oreland, PA 19075
|
1,480 sq. feet
|
2 baths 3 beds |
show details | |

|
#4
Oreland Mill Rd
Oreland, PA 19075
|
1,588 sq. feet
|
1 baths 3 beds |
show details | |

|
#5
Bergan Rd
Oreland, PA 19075
|
2,590 sq. feet
|
2 baths 3 beds |
show details | |

|
#6
Lyster Rd
Oreland, PA 19075
|
- sq. feet
|
- baths - beds |
show details | |

|
#7
Pennsylvania Ave Apt O4
Oreland, PA 19075
|
- sq. feet
|
- baths - beds |
show details | |

|
#8
N 59th St
Philadelphia, PA 19151
|
1,244 sq. feet
|
1 baths 3 beds |
$241,500
|
show details |

|
#9
N Front St Apt B
Philadelphia, PA 19123
|
2,491 sq. feet
|
2 baths 3 beds |
$659,500
|
show details |

|
#10
N 5th St
Philadelphia, PA 19126
|
1,420 sq. feet
|
2 baths 3 beds |
$313,900
|
show details |
| Photo | Address | Area | Beds / Baths | Price | Details |
|---|---|---|---|---|---|

|
#11
Harvey Ave
Pennsauken, NJ 08110
|
1,555 sq. feet
|
2 baths 4 beds |
$415,000
|
show details |

|
#12
Foxglove Dr
Riverside, NJ 08075
|
840 sq. feet
|
1 baths 2 beds |
$113,683
|
show details |

|
#13
W Olney Ave
Philadelphia, PA 19120
|
1,782 sq. feet
|
2 baths 4 beds |
$112,500
|
show details |

|
#14
Edgewood Ave
Audubon, NJ 08106
|
1,250 sq. feet
|
1 baths 4 beds |
$375,000
|
show details |

|
#15
Kershaw St
Philadelphia, PA 19131
|
1,284 sq. feet
|
1 baths 3 beds |
$139,900
|
show details |

|
#16
N Parkview Dr
Norristown, PA 19403
|
2,602 sq. feet
|
2 baths 4 beds |
$240,000
|
show details |

|
#17
Browning Rd
Merchantville, NJ 08109
|
2,376 sq. feet
|
3 baths 5 beds |
$489,900
|
show details |

|
#18
Christian St
Philadelphia, PA 19146
|
1,612 sq. feet
|
2 baths 5 beds |
$449,900
|
show details |

|
#19
Yeadon Ave
Lansdowne, PA 19050
|
1,388 sq. feet
|
1 baths 3 beds |
$273,000
|
show details |

|
#20
W Oakdale Street
Philadelphia, PA 19132
|
1,152 sq. feet
|
2 baths 3 beds |
$108,900
|
show details |
| Photo | Address | Area | Beds / Baths | Price | Details |
|---|---|---|---|---|---|

|
#21
Jessamine Ave
Oaklyn, NJ 08107
|
864 sq. feet
|
2 baths 5 beds |
$399,900
|
show details |

|
#22
Manchester Rd
Elkins Park, PA 19027
|
3,444 sq. feet
|
2 baths 3 beds |
$559,900
|
show details |

|
#23
S 8th St
Philadelphia, PA 19148
|
1,170 sq. feet
|
1 baths 3 beds |
$178,500
|
show details |

|
#24
Ashbourne Rd
Elkins Park, PA 19027
|
3,104 sq. feet
|
3 baths 6 beds |
$154,500
|
show details |

|
#25
N Forklanding Rd
Maple Shade, NJ 08052
|
1,450 sq. feet
|
1 baths 3 beds |
$259,900
|
show details |

|
#26
N Newkirk St
Philadelphia, PA 19132
|
960 sq. feet
|
1 baths 3 beds |
$1,128,765
|
show details |

|
#27
Pickering St
Philadelphia, PA 19150
|
1,170 sq. feet
|
1 baths 3 beds |
$169,900
|
show details |

|
#28
67th Ave
Philadelphia, PA 19138
|
1,146 sq. feet
|
1 baths 3 beds |
$8,900
|
show details |

|
#29
44th St
Pennsauken, NJ 08110
|
- sq. feet
|
1 baths 3 beds |
$94,900
|
show details |

|
#30
Dekalb Pike
Norristown, PA 19401
|
2,583 sq. feet
|
2 baths 4 beds |
$255,189
|
show details |
| Photo | Address | Area | Beds / Baths | Price | Details |
|---|---|---|---|---|---|

|
#31
Presidential Blvd Unit 915b
Bala Cynwyd, PA 19004
|
579 sq. feet
|
1 baths 1 beds |
$104,531
|
show details |

|
#32
Gulph Rd
Wayne, PA 19087
|
3,262 sq. feet
|
2 baths 4 beds |
$651,481
|
show details |

|
#33
Hopkinson Ct # 160
Wayne, PA 19087
|
1,656 sq. feet
|
2 baths 2 beds |
$214,896
|
show details |

|
#34
Keenan St
Elkins Park, PA 19027
|
1,234 sq. feet
|
2 baths 2 beds |
$217,220
|
show details |

|
#35
Cornelius St
Philadelphia, PA 19138
|
1,166 sq. feet
|
1 baths 3 beds |
$118,648
|
show details |

|
#36
E Rittenhouse St
Philadelphia, PA 19138
|
1,614 sq. feet
|
1 baths 3 beds |
$114,894
|
show details |

|
#37
S 19th St
Philadelphia, PA 19145
|
1,544 sq. feet
|
1 baths 4 beds |
$75,082
|
show details |

|
#38
L Fleur
Devon, PA 19333
|
1,412 sq. feet
|
1 baths 2 beds |
$50,690
|
show details |

|
#39
Woodside Ave
Berwyn, PA 19312
|
2,080 sq. feet
|
2 baths 5 beds |
$525,082
|
show details |

|
#40
Scattergood St
Philadelphia, PA 19124
|
992 sq. feet
|
1 baths 3 beds |
$65,864
|
show details |
| Photo | Address | Area | Beds / Baths | Price | Details |
|---|---|---|---|---|---|

|
#41
Poplar St
Philadelphia, PA 19130
|
1,036 sq. feet
|
1 baths 3 beds |
$145,497
|
show details |

|
#42
New Market Ct
Wayne, PA 19087
|
1,080 sq. feet
|
1 baths 2 beds |
$98,656
|
show details |

|
#43
Reedland St
Philadelphia, PA 19142
|
1,118 sq. feet
|
1 baths 3 beds |
$125,252
|
show details |

|
#44
N Bambrey St
Philadelphia, PA 19121
|
964 sq. feet
|
1 baths 3 beds |
$107,333
|
show details |

|
#45
W Oakdale St
Philadelphia, PA 19132
|
1,134 sq. feet
|
1 baths 3 beds |
$1,322,645
|
show details |

|
#46
Bainbridge St
Philadelphia, PA 19146
|
1,398 sq. feet
|
1 baths 3 beds |
$12,062,176
|
show details |

|
#47
N 21st St
Philadelphia, PA 19138
|
1,302 sq. feet
|
1 baths 3 beds |
$86,709
|
show details |

|
#48
E Wishart St
Philadelphia, PA 19134
|
1,064 sq. feet
|
1 baths 3 beds |
$1,290,613
|
show details |

|
#49
Leonard St
Philadelphia, PA 19149
|
1,024 sq. feet
|
1 baths 3 beds |
$54,557
|
show details |

|
Check over 1 million property listings on Foreclosure.com!
|
browse all offers | |||

Latest news about housing in Oreland, PA collected exclusively by city-data.com from local newspapers, TV, and radio stations

 | Many properties in Havertown.why? (17 replies) |
| Montgomery county town recommendations for son (16 replies) |
| Affordable Apartments in the Area (10 replies) |
| Family friendly suburb with a job in downtown Philly (72 replies) |
| Any midcentury ranch house neighborhoods in the burbs? (31 replies) |
| Moving to Blue Bell? (8 replies) |

Median year apartment built: 1974
Household type by relationship:
Households: 6,182- Male householders: 1,054 (217 living alone), Female householders: 1,231 (325 living alone)
1,451 spouses (1,451 opposite-sex spouses), 96 unmarried partners, (81 opposite-sex unmarried partners), 1,998 children (1,945 natural, 12 adopted, 40 stepchildren), 135 grandchildren, 29 brothers or sisters, 52 parents, 0 foster children, 27 other relatives, 90 non-relatives
- In group quarters: 14
Size of family households: 695 2-persons, 341 3-persons, 401 4-persons, 160 5-persons, 48 6-persons.
Size of nonfamily households: 558 1-person, 62 2-persons, 7 3-persons, 7 4-persons.
1,103 married couples with children.
249 single-parent households (49 men, 200 women).
88.5% of residents of Oreland speak English at home.
4.6% of residents speak Spanish at home (47% speak English very well, 15% speak English well, 38% speak English not well).
3.3% of residents speak other Indo-European language at home (92% speak English very well, 8% speak English well).
2.1% of residents speak Asian or Pacific Island language at home (55% speak English very well, 31% speak English well, 14% speak English not well).
1.4% of residents speak other language at home (100% speak English very well).
Foreign born population: 327 (5.3%)
(77.4% of them are naturalized citizens)
| Here: | 7.4 |
| State: | 6.8 |
| Here: | 4.1 |
| State: | 4.3 |

- Bedrooms in owner-occupied houses and condos in Oreland, Pennsylvania
- 7no bedroom
- 01 bedroom
- 742 bedrooms
- 1,3543 bedrooms
- 4734 bedrooms
- 835+ bedrooms

- Bedrooms in renter-occupied apartments in Oreland, Pennsylvania
- 0no bedroom
- 981 bedroom
- 1342 bedrooms
- 743 bedrooms
- 44 bedrooms
- 05+ bedrooms

- Cars and other vehicles available in Oreland in owner-occupied houses/condos
- 18no vehicle
- 4731 vehicle
- 1,0112 vehicles
- 3383 vehicles
- 1034 vehicles
- 505+ vehicles

- Cars and other vehicles available in Oreland in renter-occupied apartments
- 24no vehicle
- 2341 vehicle
- 522 vehicles
- 03 vehicles
- 04 vehicles
- 05+ vehicles

- Rooms in owner-occupied houses in Oreland, Pennsylvania
- 71 room
- 02 rooms
- 03 rooms
- 484 rooms
- 1635 rooms
- 4296 rooms
- 4347 rooms
- 4258 rooms
- 4869+ rooms

- Rooms in renter-occupied apartments in Oreland, Pennsylvania
- 01 room
- 02 rooms
- 743 rooms
- 1404 rooms
- 265 rooms
- 496 rooms
- 107 rooms
- 08 rooms
- 109+ rooms


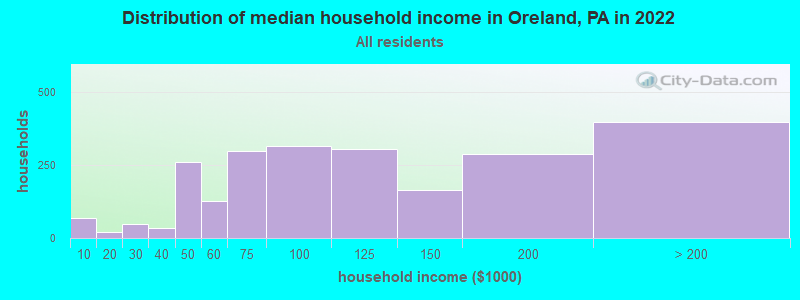
Oreland, PA household income distribution

- 67Less than $10,000
- 22$10,000 to $19,999
- 47$20,000 to $29,999
- 33$30,000 to $39,999
- 259$40,000 to $49,999
- 126$50,000 to $59,999
- 297$60,000 to $74,999
- 314$75,000 to $99,999
- 306$100,000 to $124,999
- 164$125,000 to $149,999
- 286$150,000 to $199,999
- 397$200,000 or more
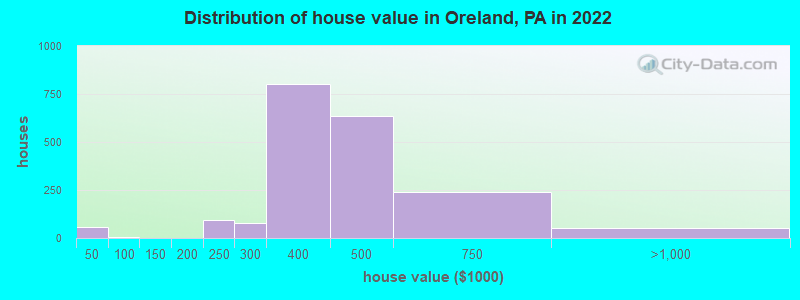
Home value of owner - occupied houses in 2022 in Oreland, PA
-
- 7Less than $10,000
- 42$35,000 to $39,999
- 7$40,000 to $49,999
- 2$100,000 to $124,999
- 94$200,000 to $249,999
- 79$250,000 to $299,999
- 804$300,000 to $399,999
- 632$400,000 to $499,999
- 239$500,000 to $749,999
- 49$750,000 to $999,999
Rent paid by renters in 2022 in Oreland, PA
-
- 16$550 to $599
- 8$600 to $649
- 11$750 to $799
- 3$800 to $899
- 171$1,000 to $1,249
- 12$1,250 to $1,499
- 6$1,500 to $1,999
- 13$2,000 to $2,499
- 4$2,500 to $2,999
- 23No cash rent

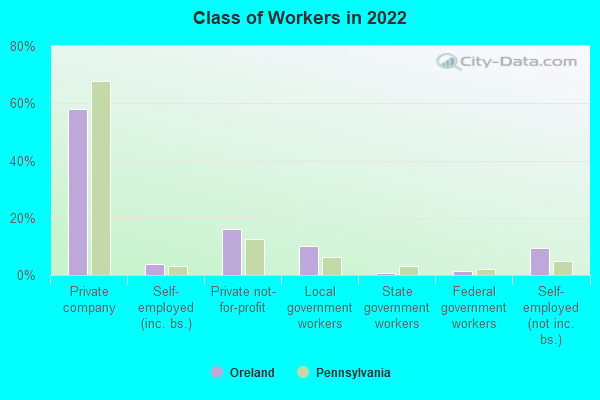
Percentage of workers working in this county: 69.4%
Number of people working at home: 712 (22.3% of all workers)
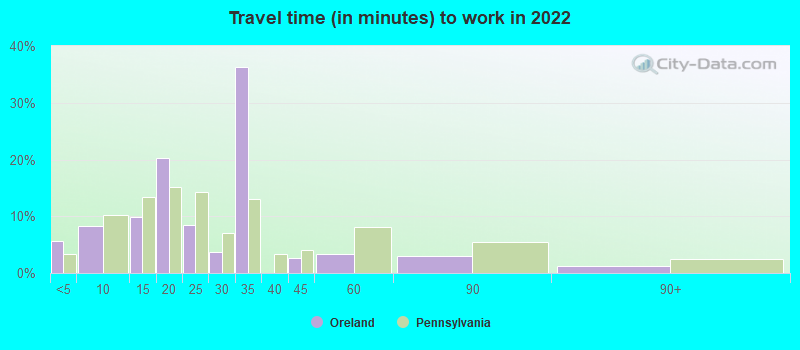
Travel time to work (commute)
- Less than 5 minutes: 29
- 5 to 9 minutes: 249
- 10 to 14 minutes: 245
- 15 to 19 minutes: 373
- 20 to 24 minutes: 328
- 25 to 29 minutes: 163
- 30 to 34 minutes: 275
- 35 to 39 minutes: 208
- 40 to 44 minutes: 150
- 45 to 59 minutes: 221
- 60 to 89 minutes: 175
- 90 or more minutes: 45
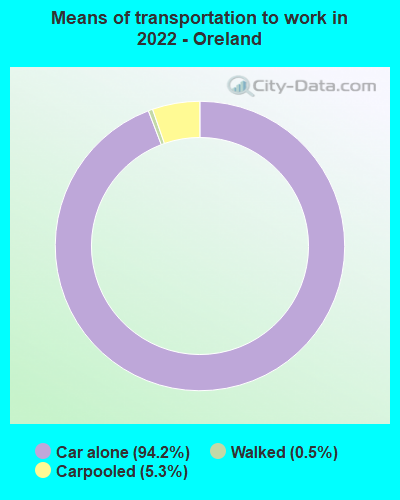
Means of transportation to work:
- Drove a car alone: 544 (47.5%)
- Carpooled: 32 (2.8%)
- Walked: 2 (0.2%)
- Worked at home: 712 (62.1%)
- Unemployment by race in 2022
- Unemployment rate for White non-Hispanic residents
- 5.0%Males
- 2.0%Females
- Unemployment rate for Black residents
- 38.6%Males
- 2.4%Females
- Unemployment rate for Asian residents
- 18.7%Females
- Unemployment rate for Hispanic or Latino residents
- 30.3%Females

- Year of entry for the foreign-born population in Oreland, Pennsylvania
- 232010 or later
- 1452000 to 2009
- 331990 to 1999
- 881980 to 1989
- 251970 to 1979
- 59Before 1970

First ancestries reported:
- Irish: 848 (30.2%)
- Italian: 378 (13.4%)
- German: 274 (9.7%)
- American: 222 (7.9%)
- Nigerian: 81 (2.9%)
- English: 57 (2.0%)
- Jamaican: 53 (1.9%)
- European: 51 (1.8%)
- Scottish: 46 (1.6%)
- Polish: 27 (1.0%)
- Scotch-Irish: 19 (0.7%)
- Welsh: 19 (0.7%)
- British: 14 (0.5%)
- French: 14 (0.5%)
- Norwegian: 13 (0.5%)
- British West Indian: 11 (0.4%)
- Russian: 10 (0.4%)
- Eastern European: 9 (0.3%)
- Egyptian: 8 (0.3%)
- Dutch: 7 (0.2%)
- Hungarian: 7 (0.2%)
- Romanian: 7 (0.2%)
- Croatian: 6 (0.2%)
- Maltese: 4 (0.1%)
- Czechoslovakian: 3 (0.1%)
- Pennsylvania German: 3 (0.1%)
- Northern European: 2 (0.07%)
Most common places of birth for foreign-born residents (%):
| Oreland: | 15.2% (52) |
| Pennsylvania: | 1.1% (10,709) |
| Oreland: | 12.3% (42) |
| Pennsylvania: | 1.4% (13,268) |
| Oreland: | 10.0% (34) |
| Pennsylvania: | 2.4% (22,612) |
| Oreland: | 7.6% (26) |
| Pennsylvania: | 1.0% (9,386) |
| Oreland: | 6.5% (22) |
| Pennsylvania: | 1.8% (16,884) |
| Oreland: | 4.4% (15) |
| Pennsylvania: | 0.1% (826) |
| Oreland: | 3.5% (12) |
| Pennsylvania: | 3.3% (31,542) |
| Oreland: | 3.5% (12) |
| Pennsylvania: | 1.9% (18,065) |
| Oreland: | 3.2% (11) |
| Pennsylvania: | 0.3% (3,245) |
| Oreland: | 3.2% (11) |
| Pennsylvania: | 1.6% (15,272) |
| Oreland: | 3.2% (11) |
| Pennsylvania: | 0.2% (1,902) |
| Oreland: | 3.2% (11) |
| Pennsylvania: | 0.1% (738) |
| Oreland: | 2.9% (10) |
| Pennsylvania: | 10.7% (100,596) |
| Oreland: | 2.9% (10) |
| Pennsylvania: | 0.8% (7,224) |
| Oreland: | 2.3% (8) |
| Pennsylvania: | 1.0% (9,205) |
| Oreland: | 2.3% (8) |
| Pennsylvania: | 0.8% (7,272) |
| Oreland: | 1.8% (6) |
| Pennsylvania: | 0.5% (4,424) |
Place of birth for U.S.-born residents:
- This state: 4,647
- Other state: 1,121
- Northeast: 557
- Midwest: 174
- South: 222
- West: 167
94.7% of Oreland residents lived in the same house 1 years ago.
Out of people who lived in different houses, 28.1% lived in this county.
Out of people who lived in different counties, 57.1% lived in Pennsylvania.
| Oreland: | 94.7% |
| State average: | 89.3% |
Education attainment for males 25 years and older:
- No schooling: 20
- Nursery to 4th grade: 6
- 5th and 6th grade: 3
- 7th and 8th grade: 0
- 9th grade: 0
- 10th grade: 7
- 11th grade: 6
- 12th grade, no diploma: 53
- High school graduate (or equivalency): 530
- Less than 1 year of college: 78
- Some college more than 1 year, no degree: 138
- Associate degree: 166
- Bachelor's degree: 718
- Master's degree: 160
- Professional school degree: 85
- Doctorate degree: 40

Education attainment for females 25 years and older:
- No schooling: 14
- Nursery to 4th grade: 0
- 5th and 6th grade: 0
- 7th and 8th grade: 9
- 9th grade: 0
- 10th grade: 5
- 11th grade: 7
- 12th grade, no diploma: 13
- High school graduate (or equivalency): 591
- Less than 1 year of college: 78
- Some college more than 1 year, no degree: 147
- Associate degree: 83
- Bachelor's degree: 601
- Master's degree: 492
- Professional school degree: 46
- Doctorate degree: 70


Housing units in structures:
- One, detached: 1,968
- One, attached: 111
- Two: 117
- 3 or 4: 121
House/condo owner moved in on average 17 years ago
Renter moved in on average 8 years ago

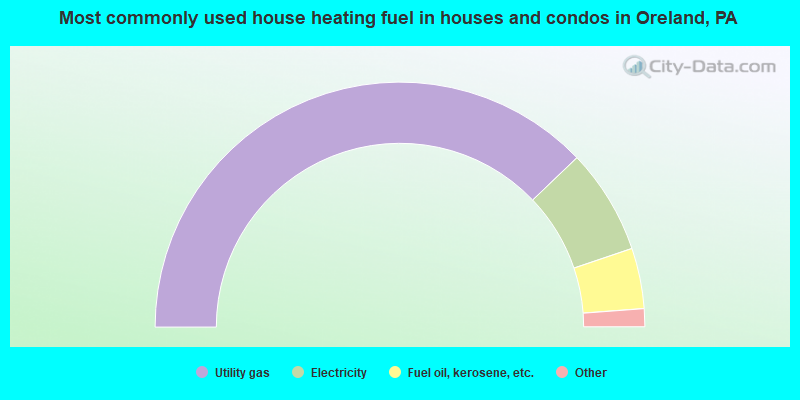
- 75.8%Utility gas
- 13.9%Electricity
- 8.0%Fuel oil, kerosene, etc.
- 1.3%Other fuel
- 0.8%No fuel used
- 0.3%Bottled, tank, or LP gas
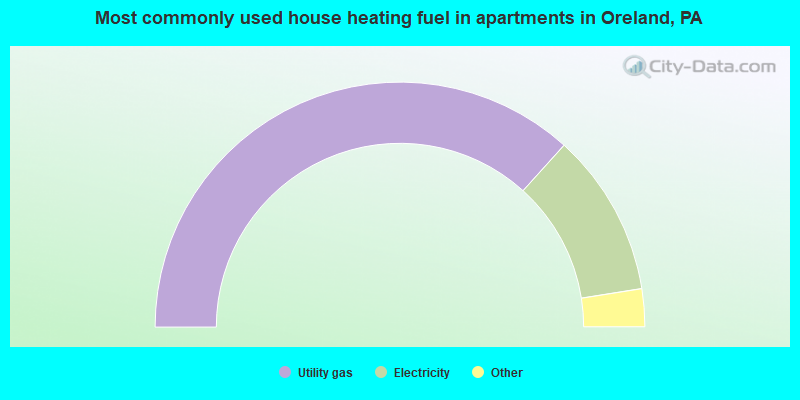
- 73.4%Utility gas
- 21.6%Electricity
- 3.0%Bottled, tank, or LP gas
- 2.0%Fuel oil, kerosene, etc.
Private vs. public school enrollment:
| Here: | 6.7% |
| Pennsylvania: | 15.7% |
| Here: | 23.2% |
| Pennsylvania: | 13.4% |
| Here: | 47.5% |
| Pennsylvania: | 39.8% |


