Housing density: 763 houses/condos per square mile
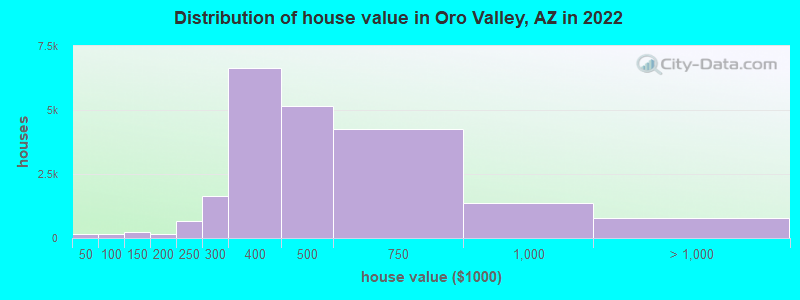
Median price asked for vacant for-sale houses and condos in 2022: $344,159.
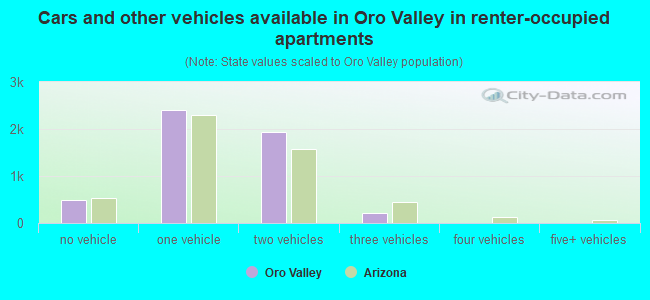
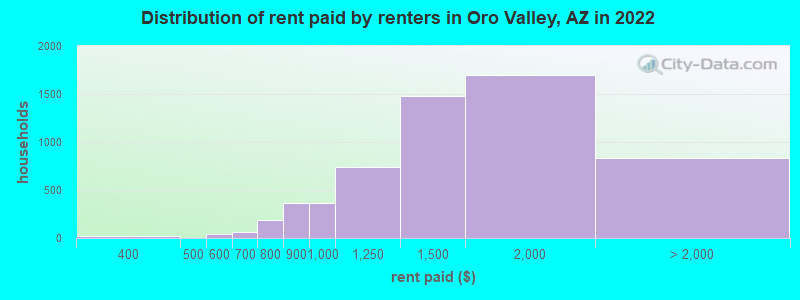
Median contract rent in 2022: $1,438 (lower quartile is $1,080, upper quartile is $1,852)
Median rent asked for vacant for-rent units in 2022: $2,011
Median gross rent in Oro Valley, AZ in 2022: $1,647
Housing units in Oro Valley with a mortgage: 9,665 (729 second mortgage, 0 home equity loan, 696 both second mortgage and home equity loan) Houses without a mortgage: 288
Median household income for houses/condos with a mortgage: $120,995
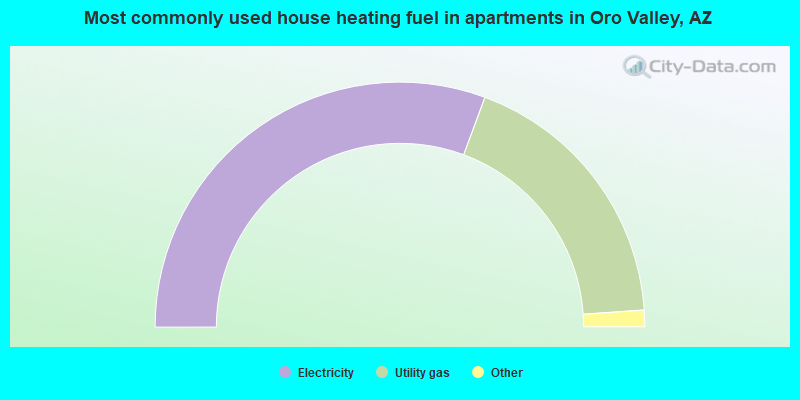
Median household income for apartments without a mortgage: $87,174
Size of family households: 9,284 2-persons, 2,126 3-persons, 1,849 4-persons, 797 5-persons, 271 6-persons, 68 7-or-more-persons.
Size of nonfamily households: 6,075 1-person, 1,157 2-persons, 103 3-persons.
6,208 married couples with children.
1,397 single-parent households (436 men, 961 women).
88.4% of residents of Oro Valley speak English at home.
7.3% of residents speak Spanish at home (77% speak English very well, 20% speak English well, 4% speak English not well).
3.7% of residents speak other Indo-European language at home (88% speak English very well, 9% speak English well, 4% speak English not well).
1.7% of residents speak Asian or Pacific Island language at home (83% speak English very well, 11% speak English well, 5% speak English not well).
0.5% of residents speak other language at home (85% speak English very well, 15% speak English well).
Foreign born population: 4,908 (10.3%)
(79.0% of them are naturalized citizens)
Percentage of workers working in this county: 96.6% Number of people working at home: 3,927 (21.3% of all workers)
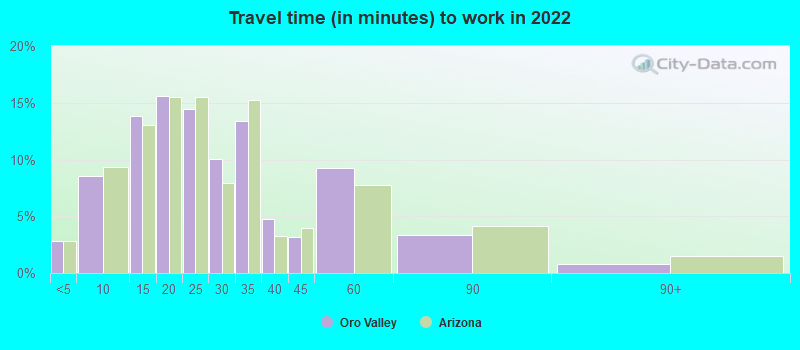
Travel time to work (commute)
Less than 5 minutes: 417
5 to 9 minutes: 1,089
10 to 14 minutes: 1,816
15 to 19 minutes: 2,162
20 to 24 minutes: 2,159
25 to 29 minutes: 1,181
30 to 34 minutes: 1,993
35 to 39 minutes: 889
40 to 44 minutes: 991
45 to 59 minutes: 1,427
60 to 89 minutes: 301
90 or more minutes: 232
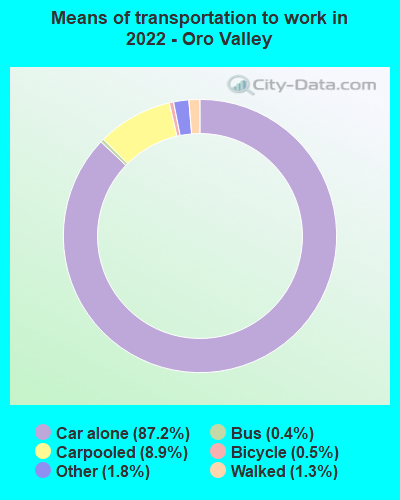
Means of transportation to work:
Drove a car alone: 12,292 (69.2%)
Carpooled: 1,302 (7.3%)
Bus: 42 (0.2%)
Taxi: 209 (1.2%)
Bicycle: 55 (0.3%)
Walked: 220 (1.2%)
Worked at home: 3,927 (22.1%)
Unemployment by race in 2022
Unemployment rate for White non-Hispanic residents
1.9%Males
2.3%Females
Unemployment rate for Black residents
4.3%Males
4.6%Females
Unemployment rate for Asian residents
3.2%Females
Unemployment rate for two or more race residents
4.3%Males
6.5%Females
Unemployment rate for Hispanic or Latino residents
2.2%Males
4.1%Females
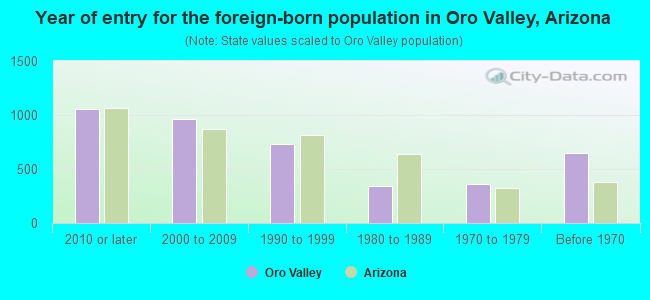
Year of entry for the foreign-born population in Oro Valley, Arizona
1,0512010 or later
9672000 to 2009
7361990 to 1999
3421980 to 1989
3581970 to 1979
644Before 1970
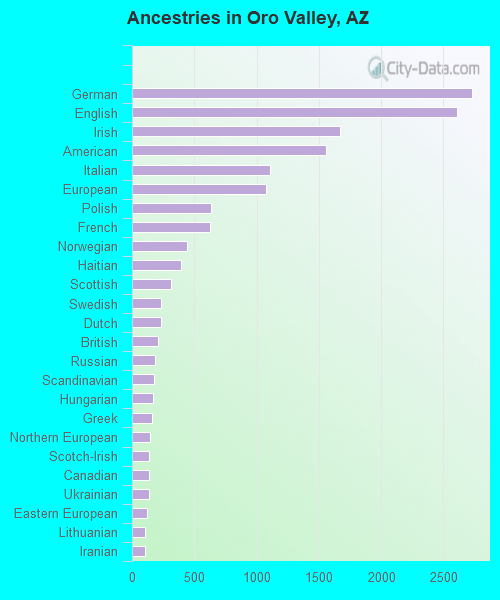
First ancestries reported:
German: 2,729 (11.8%)
English: 2,607 (11.3%)
Irish: 1,669 (7.2%)
American: 1,559 (6.8%)
Italian: 1,104 (4.8%)
European: 1,073 (4.7%)
Polish: 631 (2.7%)
French: 629 (2.7%)
Norwegian: 444 (1.9%)
Haitian: 392 (1.7%)
Scottish: 315 (1.4%)
Swedish: 229 (1.0%)
Dutch: 229 (1.0%)
British: 206 (0.9%)
Russian: 184 (0.8%)
Scandinavian: 178 (0.8%)
Hungarian: 172 (0.7%)
Greek: 160 (0.7%)
Northern European: 143 (0.6%)
Scotch-Irish: 138 (0.6%)
Canadian: 136 (0.6%)
Ukrainian: 133 (0.6%)
Eastern European: 122 (0.5%)
Lithuanian: 108 (0.5%)
Iranian: 106 (0.5%)
Czech: 93 (0.4%)
French Canadian: 92 (0.4%)
Danish: 72 (0.3%)
Guyanese: 66 (0.3%)
Welsh: 63 (0.3%)
Slavic: 58 (0.3%)
Czechoslovakian: 56 (0.2%)
Austrian: 55 (0.2%)
Belgian: 36 (0.2%)
Turkish: 28 (0.1%)
Swiss: 27 (0.1%)
Jordanian: 25 (0.1%)
Finnish: 20 (0.09%)
Romanian: 19 (0.08%)
Armenian: 17 (0.07%)
Serbian: 16 (0.07%)
Zimbabwean: 16 (0.07%)
Portuguese: 12 (0.05%)
Palestinian: 12 (0.05%)
Slovak: 11 (0.05%)
Basque: 10 (0.04%)
Pennsylvania German: 10 (0.04%)
Israeli: 10 (0.04%)
Slovene: 9 (0.04%)
Yugoslavian: 8 (0.03%)
Syrian: 4 (0.02%)
Most common places of birth for foreign-born residents (%):
Mexico
Oro Valley:
23.7% (1,221)
Arizona:
53.4% (500,086)
Canada
Oro Valley:
8.9% (460)
Arizona:
4.3% (40,102)
Switzerland
Oro Valley:
6.5% (335)
Arizona:
0.1% (993)
Philippines
Oro Valley:
4.7% (240)
Arizona:
3.2% (30,378)
France
Oro Valley:
4.6% (235)
Arizona:
0.4% (3,628)
India
Oro Valley:
4.0% (205)
Arizona:
4.5% (41,719)
Germany
Oro Valley:
3.8% (197)
Arizona:
1.5% (14,058)
Japan
Oro Valley:
3.3% (168)
Arizona:
0.6% (6,077)
Korea
Oro Valley:
2.3% (118)
Arizona:
1.2% (11,275)
Bangladesh
Oro Valley:
2.3% (118)
Arizona:
0.3% (2,425)
United Kingdom, excluding England and Scotland
Oro Valley:
2.3% (117)
Arizona:
0.7% (6,565)
Peru
Oro Valley:
1.9% (99)
Arizona:
0.5% (4,316)
Russia
Oro Valley:
1.9% (96)
Arizona:
0.4% (3,763)
Vietnam
Oro Valley:
1.8% (91)
Arizona:
2.1% (19,199)
Egypt
Oro Valley:
1.7% (89)
Arizona:
0.2% (1,917)
Hungary
Oro Valley:
1.6% (83)
Arizona:
0.2% (1,572)
China, excluding Hong Kong and Taiwan
Oro Valley:
1.6% (82)
Arizona:
2.3% (21,275)
Pakistan
Oro Valley:
1.5% (79)
Arizona:
0.3% (2,699)
Place of birth for U.S.-born residents:
This state: 11,504
Other state: 30,228
Northeast: 5,583
Midwest: 10,617
South: 4,961
West: 8,983
86.1% of Oro Valley residents lived in the same house 1 years ago. Out of people who lived in different houses, 30.7% lived in this county. Out of people who lived in different counties, 11.1% lived in Arizona.
Oro Valley:
86.1%
State average:
86.0%
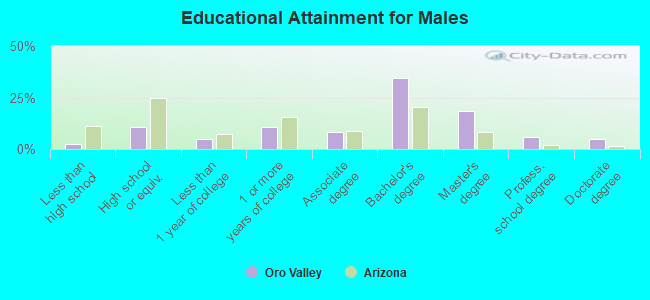
Education attainment for males 25 years and older:
No schooling: 121
Nursery to 4th grade: 8
5th and 6th grade: 0
7th and 8th grade: 48
9th grade: 16
10th grade: 29
11th grade: 41
12th grade, no diploma: 178
High school graduate (or equivalency): 1,954
Less than 1 year of college: 873
Some college more than 1 year, no degree: 1,941
Associate degree: 1,540
Bachelor's degree: 6,411
Master's degree: 3,367
Professional school degree: 1,101
Doctorate degree: 861
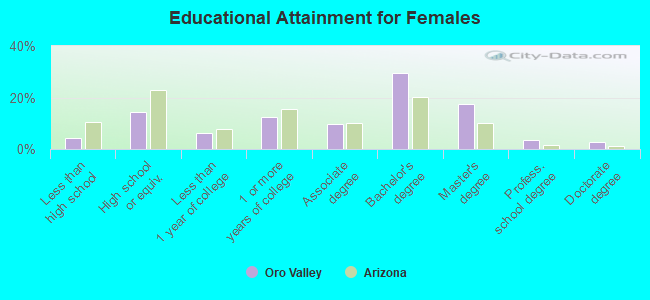
Education attainment for females 25 years and older:
No schooling: 311
Nursery to 4th grade: 12
5th and 6th grade: 10
7th and 8th grade: 38
9th grade: 45
10th grade: 15
11th grade: 23
12th grade, no diploma: 368
High school graduate (or equivalency): 2,779
Less than 1 year of college: 1,238
Some college more than 1 year, no degree: 2,402
Associate degree: 1,870
Bachelor's degree: 5,724
Master's degree: 3,373
Professional school degree: 685
Doctorate degree: 565
Housing units in structures:
One, detached: 17,743
One, attached: 1,587
Two: 170
3 or 4: 588
5 to 9: 1,240
10 to 19: 1,101
20 to 49: 497
50 or more: 1,189
Mobile homes: 159
Boats, RVs, vans, etc.: 19
Median worth of mobile homes: $138,931
Housing units lacking complete plumbing facilities in 2022: 0.1%
Housing units lacking complete kitchen facilities in 2022: 1.1%