Oroville, CA (California) Houses and Residents
| Oroville: | $295,531 |
| California: | $715,900 |
Mean price in 2022:
Detached houses: $321,425
Here: $321,425 State: $988,808 Townhouses or other attached units: $351,330
Here: $351,330 State: $838,546 Mobile homes: $56,837
Here: $56,837 State: $184,506
Total population: 16,220 (Urban population: 12,848 (all inside urban clusters), Rural population: 121 (20 farm, 101 nonfarm))
Houses: 8,220 (7,288 occupied: 3,665 owner occupied, 3,605 renter occupied)
| % of renters here: | 50% |
| State: | 44% |
Housing density: 671 houses/condos per square mile
Median price asked for vacant for-sale houses and condos in 2022: $158,450.
Median contract rent in 2022: $887 (lower quartile is $631, upper quartile is $1,082)
Median rent asked for vacant for-rent units in 2022: $931
Median gross rent in Oroville, CA in 2022: $1,054
Housing units in Oroville with a mortgage: 2,328 (210 second mortgage, 0 home equity loan, 57 both second mortgage and home equity loan)
Houses without a mortgage: 0
Median household income for houses/condos with a mortgage: $85,747
Median household income for apartments without a mortgage: $47,404
Median monthly housing costs: $1,104
Compare current foreclosures in Oroville, CA:
| Photo | Address | Area | Beds / Baths | Price | Details |
|---|---|---|---|---|---|

|
#1
Claremont Dr
Oroville, CA 95966
|
2,031 sq. feet
|
2 baths 2 beds |
$459,000
|
show details |

|
#2
Oro Bangor Hwy
Oroville, CA 95966
|
1,304 sq. feet
|
2 baths 3 beds |
$234,000
|
show details |

|
#3
Elgin St
Oroville, CA 95966
|
1,092 sq. feet
|
1 baths 2 beds |
$66,680
|
show details |

|
#4
Tehama Ave
Oroville, CA 95965
|
892 sq. feet
|
1 baths 2 beds |
$31,831
|
show details |

|
#5
Woodduck Ct
Oroville, CA 95965
|
1,440 sq. feet
|
2 baths 3 beds |
$28,435
|
show details |

|
#6
A St
Oroville, CA 95966
|
672 sq. feet
|
1 baths 2 beds |
$13,097
|
show details |

|
#7
Roseben Ave
Oroville, CA 95966
|
1,760 sq. feet
|
1 baths 3 beds |
$28,557
|
show details |

|
#8
Edgewood Ln
Oroville, CA 95965
|
2,857 sq. feet
|
2 baths 2 beds |
$52,821
|
show details |

|
#9
Edgewood Dr
Oroville, CA 95966
|
1,200 sq. feet
|
1 baths 4 beds |
$7,100
|
show details |

|
#10
Greenbrier Dr
Oroville, CA 95966
|
800 sq. feet
|
2 baths 2 beds |
$26,061
|
show details |
| Photo | Address | Area | Beds / Baths | Price | Details |
|---|---|---|---|---|---|

|
#11
Ridge Line Ct
Oroville, CA 95966
|
2,169 sq. feet
|
2 baths 3 beds |
$20,239
|
show details |

|
#12
Lumpkin Rd
Oroville, CA 95966
|
720 sq. feet
|
1 baths 2 beds |
$7,477
|
show details |

|
#13
Viewcrest Dr
Oroville, CA 95966
|
1,072 sq. feet
|
2 baths 2 beds |
$14,014
|
show details |

|
#14
Surcease Mine Rd
Oroville, CA 95965
|
- sq. feet
|
1 baths 2 beds |
$28,071
|
show details |

|
#15
Linda Dr
Oroville, CA 95966
|
1,246 sq. feet
|
1 baths 3 beds |
show details | |

|
#16
Feathervale Dr
Oroville, CA 95966
|
- sq. feet
|
2 baths 3 beds |
show details | |

|
#17
Ashley Ave
Oroville, CA 95966
|
979 sq. feet
|
1 baths 3 beds |
show details | |

|
#18
Tehama Ave
Oroville, CA 95965
|
1,344 sq. feet
|
2 baths 3 beds |
show details | |

|
#19
Feather Ave
Oroville, CA 95965
|
1,310 sq. feet
|
2 baths 3 beds |
show details | |

|
#20
Woodman Dr
Oroville, CA 95966
|
2,232 sq. feet
|
3 baths 3 beds |
show details |
| Photo | Address | Area | Beds / Baths | Price | Details |
|---|---|---|---|---|---|

|
#21
Lincoln Blvd
Oroville, CA 95966
|
1,110 sq. feet
|
2 baths 3 beds |
show details | |

|
#22
Fire Camp Rd
Oroville, CA 95966
|
1,872 sq. feet
|
2 baths 3 beds |
show details | |

|
#23
Forest Inn Dr/lots 85-96 Feather River Forest Homes
Oroville, CA 95966
|
- sq. feet
|
- baths - beds |
$35,865
|
show details |

|
#24
16 Block 18 Howes Addition
Oroville, CA 95966
|
- sq. feet
|
- baths - beds |
$4,500
|
show details |

|
#25
5th Ave
Oroville, CA 95965
|
- sq. feet
|
- baths - beds |
$18,771
|
show details |

|
#26
Warren Rd
Oroville, CA 95965
|
- sq. feet
|
- baths - beds |
$6,796
|
show details |

|
#27
Jordan Hill Rd
Oroville, CA 95965
|
- sq. feet
|
- baths - beds |
$5,647
|
show details |

|
#28
Ambleside Dr
Oroville, CA 95965
|
- sq. feet
|
- baths - beds |
$63,681
|
show details |

|
#29
Stone Mountain Rd
Oroville, CA 95965
|
- sq. feet
|
- baths - beds |
$7,015
|
show details |

|
#30
Surcease Mine Rd
Oroville, CA 95965
|
- sq. feet
|
- baths - beds |
$3,972
|
show details |
| Photo | Address | Area | Beds / Baths | Price | Details |
|---|---|---|---|---|---|

|
#31
Broken Glass Cir
Oroville, CA 95965
|
- sq. feet
|
- baths - beds |
$8,843
|
show details |

|
#32
Danville Cir
Oroville, CA 95965
|
- sq. feet
|
- baths - beds |
$3,087
|
show details |

|
#33
Greenbrier Dr
Oroville, CA 95966
|
- sq. feet
|
- baths - beds |
$9,522
|
show details |

|
#34
Zink Rd 001.85 Ac Sec 25 T21n R5e
Oroville, CA 95966
|
- sq. feet
|
- baths - beds |
$2,824
|
show details |

|
#35
Lumpkin Rd
Oroville, CA 95966
|
- sq. feet
|
- baths - beds |
$7,984
|
show details |

|
#36
Hurleton Rd
Oroville, CA 95966
|
- sq. feet
|
- baths - beds |
$11,525
|
show details |

|
#37
Hurles Cir
Oroville, CA 95966
|
- sq. feet
|
- baths - beds |
$16,166
|
show details |

|
#38
Ac Sec 35 T19n R5e
Oroville, CA 95966
|
- sq. feet
|
- baths - beds |
$11,832
|
show details |

|
#39
Acres Sec 12 T19 R6e
Oroville, CA 95966
|
- sq. feet
|
- baths - beds |
$5,092
|
show details |

|
#40
Oro Bangor Hwy
Oroville, CA 95965
|
- sq. feet
|
- baths - beds |
$4,515
|
show details |
| Photo | Address | Area | Beds / Baths | Price | Details |
|---|---|---|---|---|---|

|
#41
Greenville St
Oroville, CA 95966
|
- sq. feet
|
- baths - beds |
$17,481
|
show details |

|
#42
Oro Bangor Hwy
Oroville, CA 95966
|
- sq. feet
|
- baths - beds |
$15,245
|
show details |

|
#43
Roseben Ave
Oroville, CA 95966
|
- sq. feet
|
- baths - beds |
$10,155
|
show details |

|
#44
Oro Bangor Hwy
Oroville, CA 95966
|
- sq. feet
|
- baths - beds |
$27,037
|
show details |

|
#45
C St
Oroville, CA 95966
|
- sq. feet
|
- baths - beds |
$45,065
|
show details |

|
#46
Plumas Ave
Oroville, CA 95965
|
1,477 sq. feet
|
2 baths 3 beds |
show details | |

|
#47
Lincoln Blvd
Oroville, CA 95966
|
1,968 sq. feet
|
1 baths 2 beds |
show details | |

|
#48
Irwin Ave
Oroville, CA 95966
|
1,560 sq. feet
|
2 baths 3 beds |
show details | |

|
#49
Fogg Ave
Oroville, CA 95965
|
1,536 sq. feet
|
2 baths 3 beds |
show details | |

|
Check over 1 million property listings on Foreclosure.com!
|
browse all offers | |||

Latest news about housing in Oroville, CA collected exclusively by city-data.com from local newspapers, TV, and radio stations


Median year apartment built: 1971
Household type by relationship:
Households: 19,684- Male householders: 3,371 (1,038 living alone), Female householders: 3,755 (1,085 living alone)
2,446 spouses (2,401 opposite-sex spouses), 910 unmarried partners, (860 opposite-sex unmarried partners), 5,319 children (4,947 natural, 132 adopted, 238 stepchildren), 682 grandchildren, 323 brothers or sisters, 400 parents, 45 foster children, 223 other relatives, 840 non-relatives
- In group quarters: 1,365
Size of family households: 1,444 2-persons, 1,462 3-persons, 579 4-persons, 396 5-persons, 269 6-persons, 63 7-or-more-persons.
Size of nonfamily households: 2,379 1-person, 637 2-persons, 27 3-persons, 10 4-persons, 14 5-persons, 6 6-persons.
2,598 married couples with children.
1,252 single-parent households (353 men, 899 women).
83.4% of residents of Oroville speak English at home.
5.0% of residents speak Spanish at home (65% speak English very well, 20% speak English well, 12% speak English not well, 3% don't speak English at all).
2.3% of residents speak other Indo-European language at home (60% speak English very well, 24% speak English well, 5% speak English not well, 11% don't speak English at all).
7.6% of residents speak Asian or Pacific Island language at home (44% speak English very well, 29% speak English well, 17% speak English not well, 10% don't speak English at all).
0.9% of residents speak other language at home (88% speak English very well, 12% speak English well).
Foreign born population: 1,542 (7.8%)
(72.6% of them are naturalized citizens)
| Here: | 5.5 |
| State: | 6.0 |
| Here: | 4.0 |
| State: | 3.9 |

- Bedrooms in owner-occupied houses and condos in Oroville, California
- 39no bedroom
- 1251 bedroom
- 9922 bedrooms
- 2,0413 bedrooms
- 4174 bedrooms
- 525+ bedrooms

- Bedrooms in renter-occupied apartments in Oroville, California
- 215no bedroom
- 1,0121 bedroom
- 1,6082 bedrooms
- 5983 bedrooms
- 1414 bedrooms
- 335+ bedrooms

- Cars and other vehicles available in Oroville in owner-occupied houses/condos
- 187no vehicle
- 9291 vehicle
- 1,5512 vehicles
- 7563 vehicles
- 1054 vehicles
- 1375+ vehicles

- Cars and other vehicles available in Oroville in renter-occupied apartments
- 714no vehicle
- 1,6831 vehicle
- 9052 vehicles
- 2733 vehicles
- 314 vehicles
- 05+ vehicles

- Rooms in owner-occupied houses in Oroville, California
- 391 room
- 792 rooms
- 1243 rooms
- 4964 rooms
- 1,2465 rooms
- 9356 rooms
- 3097 rooms
- 2988 rooms
- 1419+ rooms

- Rooms in renter-occupied apartments in Oroville, California
- 1921 room
- 2572 rooms
- 8943 rooms
- 1,1244 rooms
- 6085 rooms
- 2446 rooms
- 1547 rooms
- 1008 rooms
- 339+ rooms


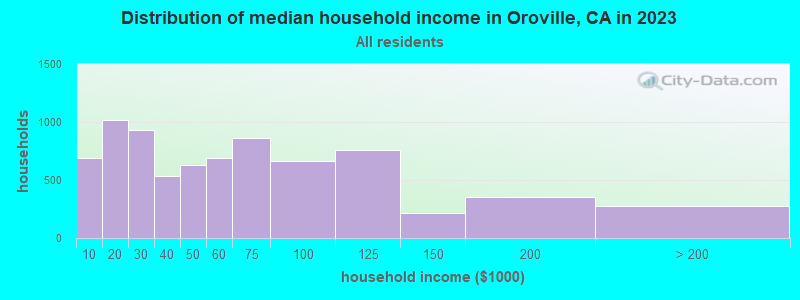
Oroville, CA household income distribution

- 766Less than $10,000
- 895$10,000 to $19,999
- 885$20,000 to $29,999
- 647$30,000 to $39,999
- 691$40,000 to $49,999
- 645$50,000 to $59,999
- 526$60,000 to $74,999
- 719$75,000 to $99,999
- 666$100,000 to $124,999
- 197$125,000 to $149,999
- 380$150,000 to $199,999
- 250$200,000 or more
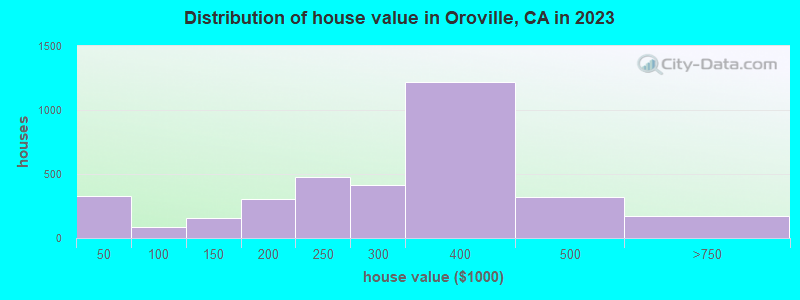
Home value of owner - occupied houses in 2022 in Oroville, CA
-
- 142Less than $10,000
- 50$10,000 to $14,999
- 134$15,000 to $19,999
- 6$20,000 to $24,999
- 46$25,000 to $29,999
- 48$35,000 to $39,999
- 14$40,000 to $49,999
- 23$60,000 to $69,999
- 76$90,000 to $99,999
- 77$100,000 to $124,999
- 102$125,000 to $149,999
- 93$150,000 to $174,999
- 215$175,000 to $199,999
- 320$200,000 to $249,999
- 491$250,000 to $299,999
- 922$300,000 to $399,999
- 265$400,000 to $499,999
- 186$500,000 to $749,999
- 16$750,000 to $999,999
- 21$1,000,000 to $1,499,999
- 0$2,000,000 or more
Rent paid by renters in 2022 in Oroville, CA
-
- 198$100 to $149
- 27$150 to $199
- 170$200 to $249
- 92$250 to $299
- 71$300 to $349
- 87$350 to $399
- 85$400 to $449
- 27$450 to $499
- 149$500 to $549
- 234$550 to $599
- 84$600 to $649
- 118$650 to $699
- 183$700 to $749
- 138$750 to $799
- 299$800 to $899
- 401$900 to $999
- 661$1,000 to $1,249
- 238$1,250 to $1,499
- 124$1,500 to $1,999
- 173$2,000 to $2,499
- 8$3,000 to $3,499
- 28$3,500 or more
- 71No cash rent


Percentage of workers working in this county: 87.9%
Number of people working at home: 500 (7.5% of all workers)
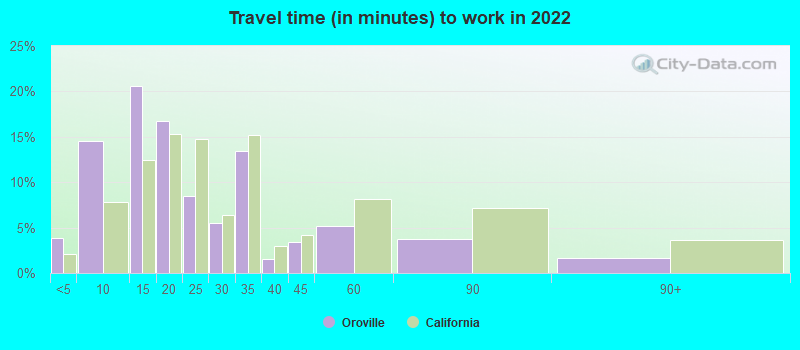
Travel time to work (commute)
- Less than 5 minutes: 668
- 5 to 9 minutes: 973
- 10 to 14 minutes: 1,048
- 15 to 19 minutes: 1,296
- 20 to 24 minutes: 625
- 25 to 29 minutes: 126
- 30 to 34 minutes: 769
- 35 to 39 minutes: 37
- 40 to 44 minutes: 177
- 45 to 59 minutes: 81
- 60 to 89 minutes: 253
- 90 or more minutes: 179
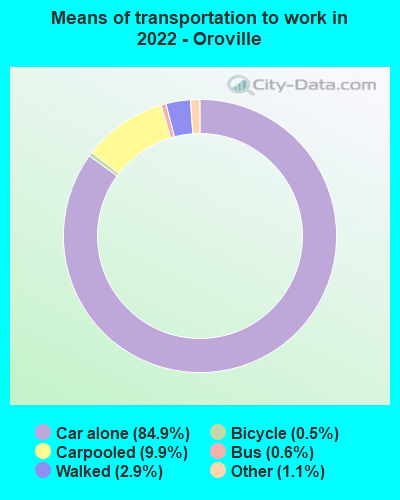
Means of transportation to work:
- Drove a car alone: 10,663 (80.3%)
- Carpooled: 1,287 (9.7%)
- Bus: 39 (0.3%)
- Taxi: 112 (0.8%)
- Bicycle: 41 (0.3%)
- Walked: 428 (3.2%)
- Worked at home: 500 (3.8%)

- Unemployment by race in 2022
- Unemployment rate for White non-Hispanic residents
- 5.0%Males
- 5.5%Females
- Unemployment rate for Black residents
- 27.7%Males
- 14.0%Females
- Unemployment rate for Asian residents
- 8.3%Males
- 9.7%Females
- Unemployment rate for other race residents
- 7.8%Females
- Unemployment rate for two or more race residents
- 2.6%Males
- 3.7%Females
- Unemployment rate for Hispanic or Latino residents
- 4.5%Males
- 1.3%Females

- Year of entry for the foreign-born population in Oroville, California
- 2352010 or later
- 3742000 to 2009
- 3841990 to 1999
- 1891980 to 1989
- 731970 to 1979
- 212Before 1970

First ancestries reported:
- American: 1,409 (14.5%)
- Irish: 897 (9.2%)
- German: 578 (5.9%)
- English: 567 (5.8%)
- Italian: 244 (2.5%)
- European: 232 (2.4%)
- Scandinavian: 104 (1.1%)
- Scottish: 79 (0.8%)
- British: 65 (0.7%)
- French: 63 (0.6%)
- Norwegian: 60 (0.6%)
- Scotch-Irish: 55 (0.6%)
- French Canadian: 51 (0.5%)
- Syrian: 40 (0.4%)
- Arab: 39 (0.4%)
- Afghan: 33 (0.3%)
- Moroccan: 28 (0.3%)
- Portuguese: 26 (0.3%)
- Polish: 25 (0.3%)
- Romanian: 22 (0.2%)
- Israeli: 18 (0.2%)
- Swiss: 18 (0.2%)
- Northern European: 9 (0.09%)
- Albanian: 8 (0.08%)
- Czech: 8 (0.08%)
- Canadian: 7 (0.07%)
- Egyptian: 5 (0.05%)
- Russian: 5 (0.05%)
- Eastern European: 3 (0.03%)
- Dutch: 2 (0.02%)
Most common places of birth for foreign-born residents (%):
| Oroville: | 26.0% (397) |
| California: | 37.2% (3,881,193) |
| Oroville: | 25.3% (386) |
| California: | 0.5% (48,911) |
| Oroville: | 13.5% (206) |
| California: | 0.6% (65,335) |
| Oroville: | 8.8% (134) |
| California: | 5.2% (539,184) |
| Oroville: | 6.6% (101) |
| California: | 0.2% (18,366) |
| Oroville: | 3.3% (50) |
| California: | 7.8% (818,297) |
| Oroville: | 2.7% (41) |
| California: | 0.5% (53,260) |
| Oroville: | 2.5% (38) |
| California: | 0.1% (9,159) |
| Oroville: | 1.8% (28) |
| California: | 0.1% (7,408) |
| Oroville: | 1.5% (23) |
| California: | 0.3% (30,949) |
Place of birth for U.S.-born residents:
- This state: 14,840
- Other state: 3,271
- Northeast: 579
- Midwest: 660
- South: 750
- West: 1,286
79.8% of Oroville residents lived in the same house 1 years ago.
Out of people who lived in different houses, 43.8% lived in this county.
Out of people who lived in different counties, 86.6% lived in California.
| Oroville: | 79.8% |
| State average: | 88.9% |
Education attainment for males 25 years and older:
- No schooling: 411
- Nursery to 4th grade: 0
- 5th and 6th grade: 47
- 7th and 8th grade: 40
- 9th grade: 182
- 10th grade: 144
- 11th grade: 158
- 12th grade, no diploma: 191
- High school graduate (or equivalency): 2,061
- Less than 1 year of college: 699
- Some college more than 1 year, no degree: 1,147
- Associate degree: 554
- Bachelor's degree: 672
- Master's degree: 216
- Professional school degree: 52
- Doctorate degree: 32

Education attainment for females 25 years and older:
- No schooling: 405
- Nursery to 4th grade: 26
- 5th and 6th grade: 19
- 7th and 8th grade: 8
- 9th grade: 146
- 10th grade: 302
- 11th grade: 228
- 12th grade, no diploma: 128
- High school graduate (or equivalency): 1,675
- Less than 1 year of college: 706
- Some college more than 1 year, no degree: 1,378
- Associate degree: 512
- Bachelor's degree: 863
- Master's degree: 153
- Professional school degree: 109
- Doctorate degree: 0


Housing units in structures:
- One, detached: 4,804
- One, attached: 256
- Two: 227
- 3 or 4: 776
- 5 to 9: 647
- 10 to 19: 475
- 20 to 49: 231
- 50 or more: 253
- Mobile homes: 549
Median worth of mobile homes: $20,932
Housing units lacking complete kitchen facilities in 2022: 1.7%
House/condo owner moved in on average 8 years ago
Renter moved in on average 4 years ago

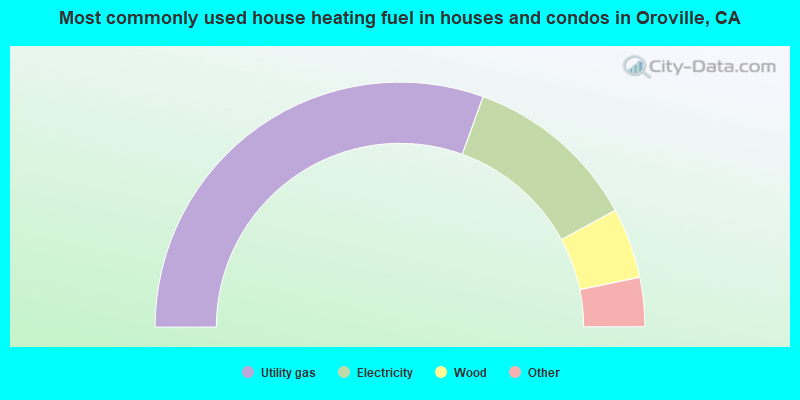
- 61.1%Utility gas
- 23.2%Electricity
- 9.3%Wood
- 3.5%Bottled, tank, or LP gas
- 2.1%Solar energy
- 0.8%No fuel used
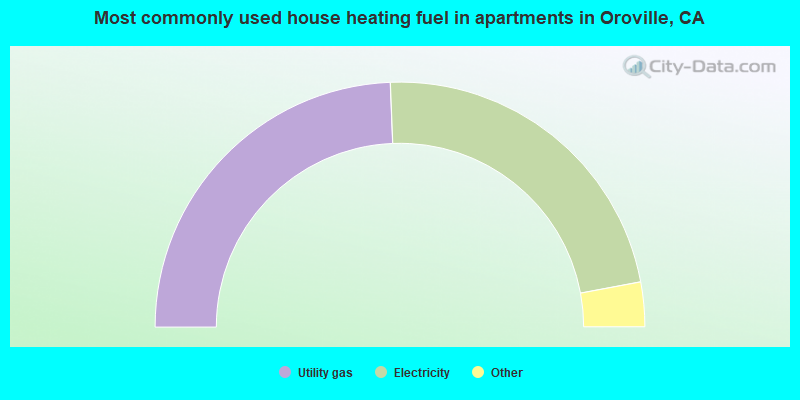
- 48.8%Utility gas
- 45.4%Electricity
- 3.7%Bottled, tank, or LP gas
- 1.0%Wood
- 0.7%Other fuel
- 0.5%No fuel used
Private vs. public school enrollment:
| Here: | 14.1% |
| California: | 10.5% |
| Here: | 5.6% |
| California: | 8.5% |
| Here: | 3.7% |
| California: | 15.9% |


