Orwigsburg, PA (Pennsylvania) Houses and Residents
| Orwigsburg: | $183,578 |
| Pennsylvania: | $245,500 |
Total population: 3,029 (All urban)
Houses: 1,049 (998 occupied: 773 owner occupied, 247 renter occupied)
| % of renters here: | 24% |
| State: | 31% |
Housing density: 479 houses/condos per square mile
Median price asked for vacant for-sale houses and condos in 2022 in this county: $77,403.
Median contract rent in 2022: $497 (lower quartile is $432, upper quartile is $660)
Median rent asked for vacant for-rent units in 2022: $327
Median gross rent in Orwigsburg, PA in 2022: $644
Housing units in Orwigsburg with a mortgage: 552 (32 second mortgage, 0 home equity loan, 33 both second mortgage and home equity loan)
Houses without a mortgage: 65
Median household income for houses/condos with a mortgage: $99,714
Median household income for apartments without a mortgage: $56,781
Median monthly housing costs: $1,039
Compare current foreclosures near Orwigsburg, PA:
| Photo | Address | Area | Beds / Baths | Price | Details |
|---|---|---|---|---|---|

|
#1
Grey Hawk Dr
Orwigsburg, PA 17961
|
2,240 sq. feet
|
2 baths 3 beds |
$266,560
|
show details |

|
#2
Chestnut Rd
Orwigsburg, PA 17961
|
1,674 sq. feet
|
1 baths 3 beds |
$4,256
|
show details |

|
#3
W Church St
Orwigsburg, PA 17961
|
1,620 sq. feet
|
1 baths 3 beds |
show details | |

|
#4
Laurel Rd
Orwigsburg, PA 17961
|
1,591 sq. feet
|
2 baths 3 beds |
show details | |

|
#5
Patton Dr
Orwigsburg, PA 17961
|
5,892 sq. feet
|
5 baths 5 beds |
show details | |

|
#6
Red Dale Rd
Orwigsburg, PA 17961
|
- sq. feet
|
- baths - beds |
show details | |

|
#7
N Walborn Ave Apt 233a
Orwigsburg, PA 17961
|
- sq. feet
|
- baths - beds |
show details | |

|
#8
W Kline Ave
Lansford, PA 18232
|
998 sq. feet
|
1 baths 2 beds |
$104,500
|
show details |

|
#9
North St
Minersville, PA 17954
|
1,479 sq. feet
|
1 baths 4 beds |
$49,885
|
show details |

|
#10
S Lehigh Ave
Frackville, PA 17931
|
1,696 sq. feet
|
1 baths 3 beds |
$67,664
|
show details |
| Photo | Address | Area | Beds / Baths | Price | Details |
|---|---|---|---|---|---|

|
#11
W Spruce St
Mahanoy City, PA 17948
|
1,408 sq. feet
|
1 baths 4 beds |
$35,163
|
show details |

|
#12
Ann St
Pottsville, PA 17901
|
1,512 sq. feet
|
2 baths 3 beds |
$3,333
|
show details |

|
#13
Lytle St
Minersville, PA 17954
|
1,970 sq. feet
|
1 baths 3 beds |
$37,137
|
show details |

|
#14
Penn St
Minersville, PA 17954
|
1,798 sq. feet
|
1 baths 5 beds |
$53,453
|
show details |

|
#15
Arnots
Saint Clair, PA 17970
|
1,718 sq. feet
|
1 baths 5 beds |
$3,002
|
show details |

|
#16
Mill Street
Saint Clair, PA 17970
|
1,419 sq. feet
|
1 baths 3 beds |
$93,483
|
show details |

|
#17
S 2nd St
Frackville, PA 17931
|
1,260 sq. feet
|
1 baths 3 beds |
$13,246
|
show details |

|
#18
Hazle St
Tamaqua, PA 18252
|
1,576 sq. feet
|
1 baths 3 beds |
$69,864
|
show details |

|
#19
Orwigsburg St
Tamaqua, PA 18252
|
1,455 sq. feet
|
1 baths 3 beds |
$47,280
|
show details |

|
#20
Hotel Ln
Barnesville, PA 18214
|
1,316 sq. feet
|
1 baths 3 beds |
$140,761
|
show details |
| Photo | Address | Area | Beds / Baths | Price | Details |
|---|---|---|---|---|---|

|
#21
Pottsville St
Cressona, PA 17929
|
1,308 sq. feet
|
1 baths 3 beds |
$108,472
|
show details |

|
#22
Market St
Tamaqua, PA 18252
|
1,265 sq. feet
|
1 baths 3 beds |
$63,376
|
show details |

|
#23
W Mount Vernon St
Shenandoah, PA 17976
|
900 sq. feet
|
1 baths 2 beds |
$6,216
|
show details |

|
#24
Virginia Ave
Shenandoah, PA 17976
|
1,311 sq. feet
|
1 baths 3 beds |
$6,313
|
show details |

|
#25
W Laurel St
Tremont, PA 17981
|
1,065 sq. feet
|
1 baths 2 beds |
$3,132
|
show details |

|
#26
1st St
Coaldale, PA 18218
|
1,519 sq. feet
|
1 baths 2 beds |
$3,066
|
show details |

|
#27
Ash Cir
Andreas, PA 18211
|
988 sq. feet
|
1 baths 2 beds |
$24,215
|
show details |

|
#28
Graeff St
Cressona, PA 17929
|
1,176 sq. feet
|
1 baths 2 beds |
$94,435
|
show details |

|
#29
Golf Rd
Barnesville, PA 18214
|
1,440 sq. feet
|
1 baths 2 beds |
$3,893
|
show details |

|
#30
Parkway
Schuylkill Haven, PA 17972
|
1,428 sq. feet
|
1 baths 3 beds |
$85,871
|
show details |
| Photo | Address | Area | Beds / Baths | Price | Details |
|---|---|---|---|---|---|

|
#31
S Margaretta St
Schuylkill Haven, PA 17972
|
1,264 sq. feet
|
1 baths 3 beds |
$114,614
|
show details |

|
#32
E Liberty St
Schuylkill Haven, PA 17972
|
1,176 sq. feet
|
1 baths 3 beds |
$106,662
|
show details |

|
#33
S Mill St
Saint Clair, PA 17970
|
1,419 sq. feet
|
1 baths 3 beds |
show details | |

|
#34
Washington Street
Auburn, PA 17922
|
1,526 sq. feet
|
1 baths 2 beds |
show details | |

|
#35
Main St
Shoemakersville, PA 19555
|
1,936 sq. feet
|
1 baths 4 beds |
show details | |

|
#36
Walnut St
Ashland, PA 17921
|
1,512 sq. feet
|
2 baths 3 beds |
show details | |

|
#37
Broad St
Saint Clair, PA 17970
|
1,536 sq. feet
|
1 baths 2 beds |
show details | |

|
#38
Saint Ann St
Barnesville, PA 18214
|
1,312 sq. feet
|
1 baths 3 beds |
show details | |

|
#39
Hatchet Cv
Auburn, PA 17922
|
1,260 sq. feet
|
2 baths 4 beds |
show details | |

|
#40
Moselem Spring Rd
Hamburg, PA 19526
|
1,056 sq. feet
|
2 baths 3 beds |
show details |
| Photo | Address | Area | Beds / Baths | Price | Details |
|---|---|---|---|---|---|

|
#41
N Garfield Ave
Schuylkill Haven, PA 17972
|
904 sq. feet
|
1 baths 2 beds |
show details | |

|
#42
W End Ave
Pottsville, PA 17901
|
1,536 sq. feet
|
2 baths 3 beds |
show details | |

|
#43
Brobst Hill Rd
New Tripoli, PA 18066
|
1,890 sq. feet
|
2 baths 4 beds |
show details | |

|
#44
Willow St
Schuylkill Haven, PA 17972
|
1,316 sq. feet
|
1 baths 3 beds |
show details | |

|
#45
George St
Pottsville, PA 17901
|
1,520 sq. feet
|
1 baths 2 beds |
show details | |

|
#46
E Phillips St
Coaldale, PA 18218
|
1,281 sq. feet
|
1 baths 2 beds |
show details | |

|
#47
N 4th St
Hamburg, PA 19526
|
1,320 sq. feet
|
1 baths 3 beds |
show details | |

|
#48
Pleasant Valley Rd
Pine Grove, PA 17963
|
2,080 sq. feet
|
1 baths 4 beds |
show details | |

|
#49
N Canal St
Leesport, PA 19533
|
1,140 sq. feet
|
1 baths 3 beds |
show details | |

|
Check over 1 million property listings on Foreclosure.com!
|
browse all offers | |||

Latest news about housing in Orwigsburg, PA collected exclusively by city-data.com from local newspapers, TV, and radio stations

 | Anyone here from Schuylkill County, PA? (10 replies) |
| Future NE Penn. residents looking for personal opinions and experiences! (273 replies) |
| Looking to rent a home. Moving to Northeast, PA ( monroe county) (8 replies) |
| Relocating to Schuylkill Co- Seeking Advice! (17 replies) |
| Jobs In Mifflinburg (14 replies) |
| Infor on Ashland Pa (14 replies) |

Median year apartment built: 1953
Household type by relationship:
Households: 2,998- Male householders: 416 (76 living alone), Female householders: 581 (256 living alone)
550 spouses (550 opposite-sex spouses), 95 unmarried partners, (95 opposite-sex unmarried partners), 925 children (824 natural, 0 adopted, 100 stepchildren), 151 grandchildren, 0 brothers or sisters, 0 parents, 0 foster children, 13 other relatives, 7 non-relatives
- In group quarters: 254
Size of family households: 240 2-persons, 165 3-persons, 91 4-persons, 31 5-persons, 87 7-or-more-persons.
Size of nonfamily households: 312 1-person, 82 2-persons.
688 married couples with children.
25 single-parent households (0 men, 25 women).
92.6% of residents of Orwigsburg speak English at home.
1.5% of residents speak Spanish at home (90% speak English very well, 10% speak English well).
4.8% of residents speak other Indo-European language at home (75% speak English very well, 25% speak English well).
0.9% of residents speak Asian or Pacific Island language at home (88% speak English well, 12% speak English not well).
Foreign born population: 47 (1.6%)
(31.9% of them are naturalized citizens)
| Here: | 7.5 |
| State: | 6.8 |
| Here: | 4.6 |
| State: | 4.3 |

- Bedrooms in owner-occupied houses and condos in Orwigsburg, Pennsylvania
- 0no bedroom
- 141 bedroom
- 1002 bedrooms
- 4103 bedrooms
- 1624 bedrooms
- 875+ bedrooms

- Bedrooms in renter-occupied apartments in Orwigsburg, Pennsylvania
- 0no bedroom
- 971 bedroom
- 1202 bedrooms
- 313 bedrooms
- 04 bedrooms
- 05+ bedrooms

- Cars and other vehicles available in Orwigsburg in owner-occupied houses/condos
- 0no vehicle
- 1781 vehicle
- 3452 vehicles
- 1633 vehicles
- 624 vehicles
- 255+ vehicles

- Cars and other vehicles available in Orwigsburg in renter-occupied apartments
- 32no vehicle
- 1641 vehicle
- 512 vehicles
- 03 vehicles
- 04 vehicles
- 05+ vehicles

- Rooms in owner-occupied houses in Orwigsburg, Pennsylvania
- 01 room
- 02 rooms
- 03 rooms
- 354 rooms
- 405 rooms
- 1946 rooms
- 1337 rooms
- 1778 rooms
- 1959+ rooms

- Rooms in renter-occupied apartments in Orwigsburg, Pennsylvania
- 01 room
- 02 rooms
- 523 rooms
- 1094 rooms
- 325 rooms
- 546 rooms
- 07 rooms
- 08 rooms
- 09+ rooms


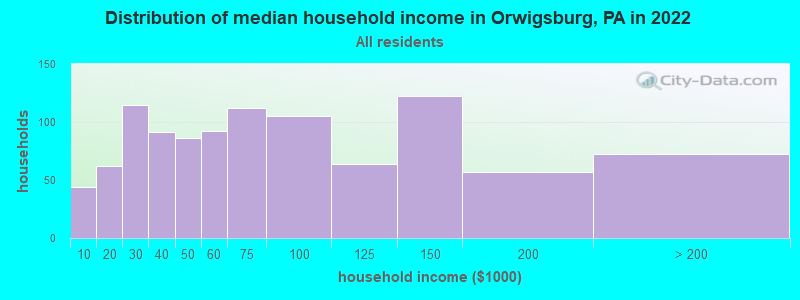
Orwigsburg, PA household income distribution

- 44Less than $10,000
- 62$10,000 to $19,999
- 115$20,000 to $29,999
- 91$30,000 to $39,999
- 86$40,000 to $49,999
- 92$50,000 to $59,999
- 112$60,000 to $74,999
- 105$75,000 to $99,999
- 64$100,000 to $124,999
- 122$125,000 to $149,999
- 57$150,000 to $199,999
- 72$200,000 or more
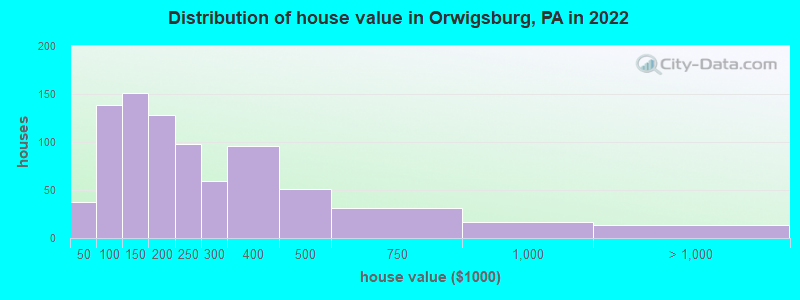
Home value of owner - occupied houses in 2022 in Orwigsburg, PA
-
- 15$15,000 to $19,999
- 22$40,000 to $49,999
- 3$50,000 to $59,999
- 22$60,000 to $69,999
- 37$70,000 to $79,999
- 41$80,000 to $89,999
- 11$90,000 to $99,999
- 69$100,000 to $124,999
- 81$125,000 to $149,999
- 95$150,000 to $174,999
- 31$175,000 to $199,999
- 98$200,000 to $249,999
- 58$250,000 to $299,999
- 95$300,000 to $399,999
- 51$400,000 to $499,999
- 31$500,000 to $749,999
- 17$750,000 to $999,999
- 13$2,000,000 or more
Rent paid by renters in 2022 in Orwigsburg, PA
-
- 28$150 to $199
- 8$250 to $299
- 12$300 to $349
- 7$350 to $399
- 15$400 to $449
- 19$450 to $499
- 26$500 to $549
- 7$550 to $599
- 20$600 to $649
- 42$650 to $699
- 7$800 to $899
- 9$1,250 to $1,499
- 37No cash rent


Percentage of workers working in this county: 74.0%
Number of people working at home: 198 (15.4% of all workers)
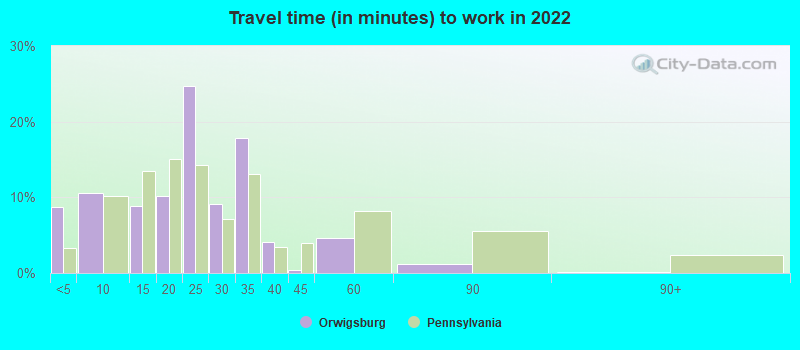
Travel time to work (commute)
- Less than 5 minutes: 3
- 5 to 9 minutes: 182
- 10 to 14 minutes: 148
- 15 to 19 minutes: 194
- 20 to 24 minutes: 201
- 25 to 29 minutes: 16
- 30 to 34 minutes: 81
- 35 to 39 minutes: 113
- 40 to 44 minutes: 23
- 45 to 59 minutes: 116
- 60 to 89 minutes: 40
- 90 or more minutes: 0
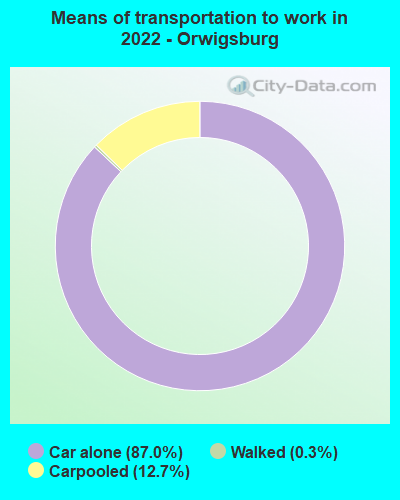
Means of transportation to work:
- Drove a car alone: 1,408 (77.8%)
- Carpooled: 223 (12.3%)
- Walked: 4 (0.2%)
- Worked at home: 196 (10.8%)

- Unemployment by race in 2022
- Unemployment rate for White non-Hispanic residents
- 2.2%Females

- Year of entry for the foreign-born population in Orwigsburg, Pennsylvania
- 02010 or later
- 242000 to 2009
- 91990 to 1999
- 01980 to 1989
- 201970 to 1979
- 0Before 1970

First ancestries reported:
- German: 275 (31.9%)
- American: 145 (16.8%)
- Polish: 120 (13.9%)
- Italian: 85 (9.9%)
- Irish: 34 (3.9%)
- Dutch: 29 (3.4%)
- Pennsylvania German: 12 (1.4%)
- Greek: 11 (1.3%)
- Hungarian: 10 (1.2%)
- Slovak: 10 (1.2%)
- British: 8 (0.9%)
- European: 8 (0.9%)
- Norwegian: 8 (0.9%)
- Turkish: 8 (0.9%)
- Welsh: 8 (0.9%)
- Lithuanian: 6 (0.7%)
- English: 5 (0.6%)
Most common places of birth for foreign-born residents (%):
| Orwigsburg: | 34.7% (17) |
| Pennsylvania: | 0.3% (2,506) |
| Orwigsburg: | 20.4% (10) |
| Pennsylvania: | 0.1% (777) |
| Orwigsburg: | 14.3% (7) |
| Pennsylvania: | 1.8% (16,884) |
| Orwigsburg: | 12.2% (6) |
| Pennsylvania: | 0.5% (4,648) |
Place of birth for U.S.-born residents:
- This state: 2,188
- Other state: 710
- Northeast: 309
- Midwest: 92
- South: 218
- West: 74
83.6% of Orwigsburg residents lived in the same house 1 years ago.
Out of people who lived in different houses, 39.0% lived in this county.
Out of people who lived in different counties, 73.1% lived in Pennsylvania.
| Orwigsburg: | 83.6% |
| State average: | 89.3% |
Education attainment for males 25 years and older:
- No schooling: 16
- Nursery to 4th grade: 0
- 5th and 6th grade: 3
- 7th and 8th grade: 10
- 9th grade: 0
- 10th grade: 8
- 11th grade: 1
- 12th grade, no diploma: 0
- High school graduate (or equivalency): 392
- Less than 1 year of college: 78
- Some college more than 1 year, no degree: 14
- Associate degree: 28
- Bachelor's degree: 116
- Master's degree: 76
- Professional school degree: 88
- Doctorate degree: 13

Education attainment for females 25 years and older:
- No schooling: 10
- Nursery to 4th grade: 0
- 5th and 6th grade: 0
- 7th and 8th grade: 21
- 9th grade: 19
- 10th grade: 19
- 11th grade: 31
- 12th grade, no diploma: 0
- High school graduate (or equivalency): 378
- Less than 1 year of college: 50
- Some college more than 1 year, no degree: 88
- Associate degree: 94
- Bachelor's degree: 189
- Master's degree: 157
- Professional school degree: 13
- Doctorate degree: 14


Housing units in structures:
- One, detached: 612
- One, attached: 211
- Two: 8
- 3 or 4: 103
- 5 to 9: 37
- 10 to 19: 24
- 20 to 49: 27
- Mobile homes: 20
House/condo owner moved in on average 11 years ago
Renter moved in on average 4 years ago

- 62.7%Fuel oil, kerosene, etc.
- 27.5%Electricity
- 3.6%Other fuel
- 3.4%Bottled, tank, or LP gas
- 1.8%Coal or coke
- 0.9%Wood
- 65.3%Electricity
- 34.7%Fuel oil, kerosene, etc.
Private vs. public school enrollment:
| Here: | 8.4% |
| Pennsylvania: | 15.7% |
| Here: | 48.8% |
| Pennsylvania: | 13.4% |
| Here: | 54.7% |
| Pennsylvania: | 39.8% |


