Osage Beach, MO (Missouri) Houses and Residents
| Osage Beach: | $308,282 |
| Missouri: | $221,200 |
Total population: 4,395 (Urban population: 0, Rural population: 3,587 (4 farm, 3,583 nonfarm))
Houses: 4,989 (1,676 occupied: 1,089 owner occupied, 611 renter occupied)
| % of renters here: | 36% |
| State: | 32% |
Housing density: 531 houses/condos per square mile
Median price asked for vacant for-sale houses and condos in 2022: $1,949,497.
Median contract rent in 2022: $683 (lower quartile is $591, upper quartile is $804)
Median rent asked for vacant for-rent units in 2022: $1,978
Median gross rent in Osage Beach, MO in 2022: $780
Housing units in Osage Beach with a mortgage: 664 (64 second mortgage, 9 home equity loan, 49 both second mortgage and home equity loan)
Houses without a mortgage: 0
Median household income for houses/condos with a mortgage: $57,919
Median household income for apartments without a mortgage: $52,190
Median monthly housing costs: $877
Compare current foreclosures near Osage Beach, MO:
| Photo | Address | Area | Beds / Baths | Price | Details |
|---|---|---|---|---|---|

|
#1
Osage Beach Pkwy Ste A
Osage Beach, MO 65065
|
- sq. feet
|
- baths - beds |
show details | |

|
#2
Baydy Peak Rd
Osage Beach, MO 65065
|
- sq. feet
|
- baths - beds |
show details | |

|
#3
Mace Rd
Osage Beach, MO 65065
|
- sq. feet
|
- baths - beds |
show details | |

|
#4
3 Seasons Rd
Osage Beach, MO 65065
|
- sq. feet
|
- baths - beds |
show details | |

|
#5
Baydy Peak Rd
Osage Beach, MO 65065
|
- sq. feet
|
- baths - beds |
show details | |

|
#6
Mace Rd Apt 4
Osage Beach, MO 65065
|
- sq. feet
|
- baths - beds |
show details | |

|
#7
Oak View Rd
Osage Beach, MO 65065
|
- sq. feet
|
- baths - beds |
show details | |

|
#8
Rock Ridge Ln # A
Osage Beach, MO 65065
|
- sq. feet
|
- baths - beds |
show details | |

|
#9
Fall St Unit A
Osage Beach, MO 65065
|
- sq. feet
|
- baths - beds |
show details | |

|
#10
Brook Holw
Osage Beach, MO 65065
|
- sq. feet
|
- baths - beds |
show details |
| Photo | Address | Area | Beds / Baths | Price | Details |
|---|---|---|---|---|---|

|
#11
Old Fifty Four Rd # 54
Camdenton, MO 65020
|
- sq. feet
|
1 baths 2 beds |
$19,900
|
show details |

|
#12
Overlook Rd
Lake Ozark, MO 65049
|
1,458 sq. feet
|
- baths 3 beds |
show details | |

|
#13
Glenwood Rd
Eldon, MO 65026
|
1,118 sq. feet
|
- baths 3 beds |
show details | |

|
#14
N Mill St
Eldon, MO 65026
|
1,326 sq. feet
|
- baths 3 beds |
show details | |

|
#15
Bittersweet Rd # 1102
Lake Ozark, MO 65049
|
- sq. feet
|
3 baths 4 beds |
show details | |

|
#16
N Sandfort Ave
Eldon, MO 65026
|
922 sq. feet
|
- baths 2 beds |
show details | |

|
#17
Chicory Rd
Ulman, MO 65083
|
- sq. feet
|
- baths - beds |
show details | |

|
#18
Jefferies Cir
Montreal, MO 65591
|
- sq. feet
|
- baths - beds |
show details | |

|
#19
Bent Tree Ln
Camdenton, MO 65020
|
- sq. feet
|
- baths - beds |
show details | |

|
#20
Cherokee Dr
Rocky Mount, MO 65072
|
- sq. feet
|
- baths - beds |
show details |
| Photo | Address | Area | Beds / Baths | Price | Details |
|---|---|---|---|---|---|

|
#21
A O Kae Ln
Montreal, MO 65591
|
- sq. feet
|
- baths - beds |
show details | |

|
#22
Camden Manor Dr # 10
Camdenton, MO 65020
|
- sq. feet
|
- baths - beds |
show details | |

|
#23
Country Club Shores Rd
Camdenton, MO 65020
|
- sq. feet
|
- baths - beds |
show details | |

|
#24
Pecan St
Eldon, MO 65026
|
- sq. feet
|
- baths - beds |
show details | |

|
#25
Tonka Spring Rd
Camdenton, MO 65020
|
- sq. feet
|
- baths - beds |
show details | |

|
#26
Hays Dr
Eldon, MO 65026
|
- sq. feet
|
- baths - beds |
show details | |

|
#27
Skywater Rd
Gravois Mills, MO 65037
|
- sq. feet
|
- baths - beds |
show details | |

|
#28
Trevino Rd
Gravois Mills, MO 65037
|
- sq. feet
|
- baths - beds |
show details | |

|
#29
E High St
Eldon, MO 65026
|
- sq. feet
|
- baths - beds |
show details | |

|
#30
Lynn Ave
Eldon, MO 65026
|
- sq. feet
|
- baths - beds |
show details |
| Photo | Address | Area | Beds / Baths | Price | Details |
|---|---|---|---|---|---|

|
#31
Mailhack Rd
Macks Creek, MO 65786
|
- sq. feet
|
- baths - beds |
show details | |

|
#32
E Brockman Ave
Eldon, MO 65026
|
- sq. feet
|
- baths - beds |
show details | |

|
#33
Mayfield Rd
Versailles, MO 65084
|
- sq. feet
|
- baths - beds |
show details | |

|
#34
Witt Rd
Eldon, MO 65026
|
- sq. feet
|
- baths - beds |
show details | |

|
#35
Witt Rd
Eldon, MO 65026
|
- sq. feet
|
- baths - beds |
show details | |

|
#36
Highway C
Ulman, MO 65083
|
- sq. feet
|
- baths - beds |
show details | |

|
#37
Alyssa Ln
Eldon, MO 65026
|
- sq. feet
|
- baths - beds |
show details | |

|
#38
Wood River Rd # B
Lake Ozark, MO 65049
|
- sq. feet
|
- baths - beds |
show details | |

|
#39
Ballenger Dr # 2b
Lake Ozark, MO 65049
|
- sq. feet
|
- baths - beds |
show details | |

|
#40
Wilmore Cir, C O Albert Pelate
Lake Ozark, MO 65049
|
- sq. feet
|
- baths - beds |
show details |
| Photo | Address | Area | Beds / Baths | Price | Details |
|---|---|---|---|---|---|

|
#41
State Road Y
Linn Creek, MO 65052
|
- sq. feet
|
- baths - beds |
show details | |

|
#42
Cherokee Rd # 2a
Lake Ozark, MO 65049
|
- sq. feet
|
- baths - beds |
show details | |

|
#43
Black Bear Dr
Linn Creek, MO 65052
|
- sq. feet
|
- baths - beds |
show details | |

|
#44
Matson Ln
Linn Creek, MO 65052
|
- sq. feet
|
- baths - beds |
show details | |

|
#45
Sweetwater Dr
Lake Ozark, MO 65049
|
- sq. feet
|
- baths - beds |
show details | |

|
#46
Highway C
Brumley, MO 65017
|
- sq. feet
|
- baths - beds |
show details | |

|
#47
Village Marina Rd
Eldon, MO 65026
|
- sq. feet
|
- baths - beds |
show details | |

|
#48
Village Marina Rd
Eldon, MO 65026
|
- sq. feet
|
- baths - beds |
show details | |

|
#49
Doc Ridgeway Rd
Roach, MO 65787
|
- sq. feet
|
- baths - beds |
show details | |

|
Check over 1 million property listings on Foreclosure.com!
|
browse all offers | |||


Median year apartment built: 1986
Household type by relationship:
Households: 4,754- Male householders: 970 (276 living alone), Female householders: 693 (228 living alone)
813 spouses (813 opposite-sex spouses), 89 unmarried partners, (89 opposite-sex unmarried partners), 955 children (821 natural, 34 adopted, 100 stepchildren), 41 grandchildren, 164 brothers or sisters, 138 parents, 0 foster children, 108 other relatives, 567 non-relatives
- In group quarters: 211
Size of family households: 700 2-persons, 163 3-persons, 59 4-persons, 89 5-persons, 23 6-persons, 13 7-or-more-persons.
Size of nonfamily households: 522 1-person, 72 2-persons, 41 3-persons, 23 4-persons.
528 married couples with children.
204 single-parent households (64 men, 140 women).
94.9% of residents of Osage Beach speak English at home.
5.5% of residents speak Spanish at home (55% speak English very well, 27% speak English well, 18% speak English not well).
Foreign born population: 101 (2.1%)
(0.0% of them are naturalized citizens)
| Here: | 6.0 |
| State: | 6.4 |
| Here: | 4.3 |
| State: | 4.4 |

- Bedrooms in owner-occupied houses and condos in Osage Beach, Missouri
- 27no bedroom
- 471 bedroom
- 1122 bedrooms
- 6003 bedrooms
- 1424 bedrooms
- 1625+ bedrooms

- Bedrooms in renter-occupied apartments in Osage Beach, Missouri
- 0no bedroom
- 861 bedroom
- 3312 bedrooms
- 1543 bedrooms
- 404 bedrooms
- 05+ bedrooms

- Cars and other vehicles available in Osage Beach in owner-occupied houses/condos
- 4no vehicle
- 2701 vehicle
- 5212 vehicles
- 2743 vehicles
- 124 vehicles
- 85+ vehicles

- Cars and other vehicles available in Osage Beach in renter-occupied apartments
- 8no vehicle
- 2801 vehicle
- 2462 vehicles
- 773 vehicles
- 04 vehicles
- 05+ vehicles

- Rooms in owner-occupied houses in Osage Beach, Missouri
- 271 room
- 342 rooms
- 133 rooms
- 774 rooms
- 2445 rooms
- 2526 rooms
- 1047 rooms
- 418 rooms
- 2979+ rooms

- Rooms in renter-occupied apartments in Osage Beach, Missouri
- 01 room
- 02 rooms
- 883 rooms
- 2714 rooms
- 845 rooms
- 526 rooms
- 857 rooms
- 48 rooms
- 279+ rooms


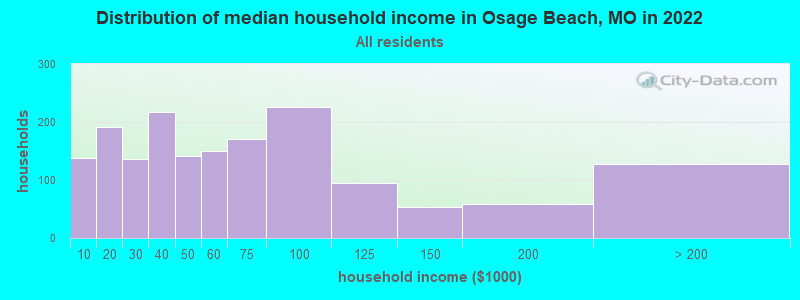
Osage Beach, MO household income distribution

- 138Less than $10,000
- 192$10,000 to $19,999
- 136$20,000 to $29,999
- 217$30,000 to $39,999
- 141$40,000 to $49,999
- 150$50,000 to $59,999
- 171$60,000 to $74,999
- 226$75,000 to $99,999
- 95$100,000 to $124,999
- 54$125,000 to $149,999
- 58$150,000 to $199,999
- 127$200,000 or more
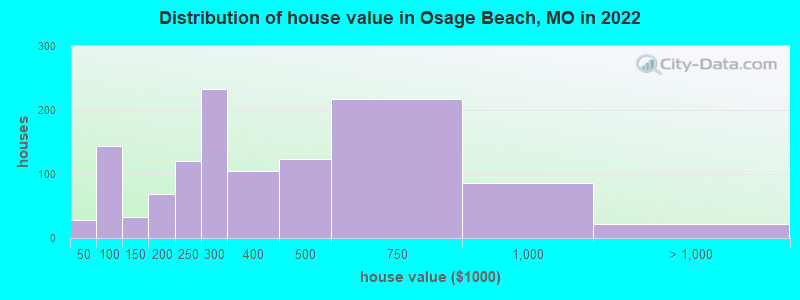
Home value of owner - occupied houses in 2022 in Osage Beach, MO
-
- 22Less than $10,000
- 6$25,000 to $29,999
- 26$50,000 to $59,999
- 44$60,000 to $69,999
- 20$70,000 to $79,999
- 42$80,000 to $89,999
- 9$90,000 to $99,999
- 19$100,000 to $124,999
- 13$125,000 to $149,999
- 33$150,000 to $174,999
- 35$175,000 to $199,999
- 121$200,000 to $249,999
- 232$250,000 to $299,999
- 104$300,000 to $399,999
- 123$400,000 to $499,999
- 217$500,000 to $749,999
- 86$750,000 to $999,999
- 12$1,000,000 to $1,499,999
- 9$1,500,000 to $1,999,999
Rent paid by renters in 2022 in Osage Beach, MO
-
- 15$350 to $399
- 13$400 to $449
- 3$450 to $499
- 39$500 to $549
- 70$550 to $599
- 118$600 to $649
- 25$650 to $699
- 102$700 to $749
- 20$750 to $799
- 19$800 to $899
- 53$900 to $999
- 34$1,000 to $1,249
- 10$1,250 to $1,499
- 63No cash rent


Percentage of workers working in this county: 92.0%
Number of people working at home: 242 (11.9% of all workers)
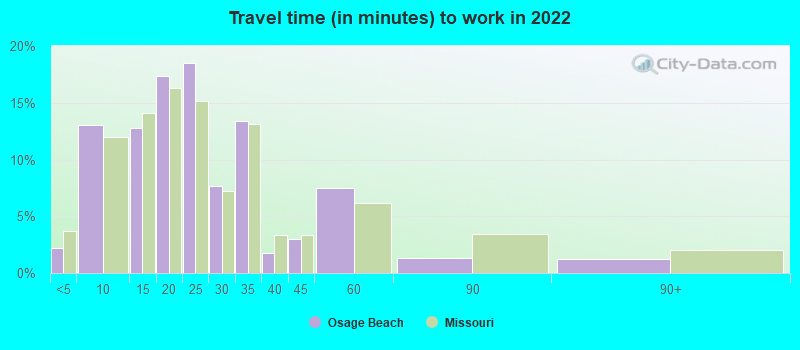
Travel time to work (commute)
- Less than 5 minutes: 84
- 5 to 9 minutes: 462
- 10 to 14 minutes: 335
- 15 to 19 minutes: 440
- 20 to 24 minutes: 230
- 25 to 29 minutes: 50
- 30 to 34 minutes: 22
- 35 to 39 minutes: 9
- 40 to 44 minutes: 22
- 45 to 59 minutes: 93
- 60 to 89 minutes: 3
- 90 or more minutes: 41
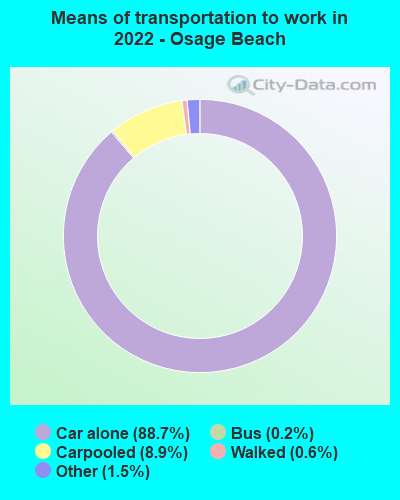
Means of transportation to work:
- Drove a car alone: 6,283 (83.8%)
- Carpooled: 641 (8.5%)
- Bus: 12 (0.2%)
- Taxi: 111 (1.5%)
- Walked: 41 (0.5%)
- Worked at home: 242 (3.2%)

- Unemployment by race in 2022
- Unemployment rate for White non-Hispanic residents
- 15.9%Males
- 0.1%Females
- Unemployment rate for Black residents
- 42.7%Males
- Unemployment rate for two or more race residents
- 21.9%Females

- Year of entry for the foreign-born population in Osage Beach, Missouri
- 192010 or later
- 72000 to 2009
- 681990 to 1999
- 81980 to 1989
- 41970 to 1979
- 28Before 1970

First ancestries reported:
- American: 848 (36.0%)
- Italian: 372 (15.8%)
- German: 296 (12.6%)
- English: 232 (9.9%)
- Irish: 68 (2.9%)
- Scotch-Irish: 54 (2.3%)
- European: 38 (1.6%)
- Dutch: 17 (0.7%)
- Canadian: 13 (0.6%)
- Jamaican: 11 (0.5%)
- Belgian: 8 (0.3%)
Most common places of birth for foreign-born residents (%):
| Osage Beach: | 77.2% (78) |
| Missouri: | 14.9% (38,568) |
| Osage Beach: | 11.9% (12) |
| Missouri: | 1.9% (4,806) |
| Osage Beach: | 9.9% (10) |
| Missouri: | 0.9% (2,341) |
Place of birth for U.S.-born residents:
- This state: 2,819
- Other state: 1,842
- Northeast: 105
- Midwest: 1,011
- South: 380
- West: 345
82.0% of Osage Beach residents lived in the same house 1 years ago.
Out of people who lived in different houses, 34.5% lived in this county.
Out of people who lived in different counties, 69.8% lived in Missouri.
| Osage Beach: | 82.0% |
| State average: | 87.1% |
Education attainment for males 25 years and older:
- No schooling: 0
- Nursery to 4th grade: 5
- 5th and 6th grade: 7
- 7th and 8th grade: 154
- 9th grade: 41
- 10th grade: 166
- 11th grade: 6
- 12th grade, no diploma: 19
- High school graduate (or equivalency): 434
- Less than 1 year of college: 86
- Some college more than 1 year, no degree: 304
- Associate degree: 148
- Bachelor's degree: 263
- Master's degree: 85
- Professional school degree: 0
- Doctorate degree: 84

Education attainment for females 25 years and older:
- No schooling: 0
- Nursery to 4th grade: 0
- 5th and 6th grade: 0
- 7th and 8th grade: 12
- 9th grade: 56
- 10th grade: 3
- 11th grade: 22
- 12th grade, no diploma: 27
- High school graduate (or equivalency): 761
- Less than 1 year of college: 142
- Some college more than 1 year, no degree: 177
- Associate degree: 171
- Bachelor's degree: 242
- Master's degree: 149
- Professional school degree: 7
- Doctorate degree: 0


Housing units in structures:
- One, detached: 1,727
- One, attached: 164
- Two: 162
- 3 or 4: 125
- 5 to 9: 213
- 10 to 19: 1,541
- 20 to 49: 503
- 50 or more: 461
- Mobile homes: 89
Housing units lacking complete kitchen facilities in 2022: 0.7%
House/condo owner moved in on average 7 years ago
Renter moved in on average 1 years ago

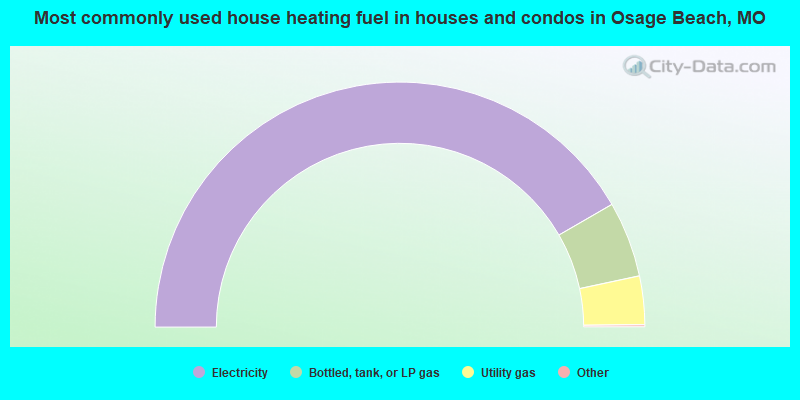
- 83.5%Electricity
- 10.0%Bottled, tank, or LP gas
- 6.4%Utility gas
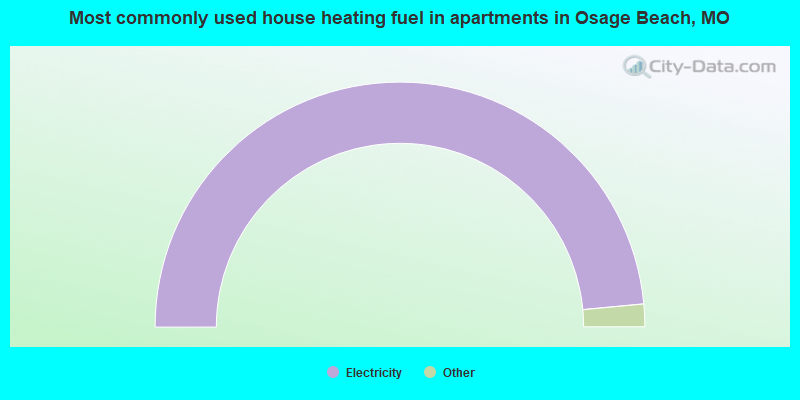
- 97.1%Electricity
- 2.2%No fuel used
- 0.7%Utility gas
Private vs. public school enrollment:
| Here: | 7.7% |
| Missouri: | 15.4% |
| Here: | 3.5% |
| Missouri: | 13.9% |
| Here: | 0.0% |
| Missouri: | 22.6% |


