Osceola, IN (Indiana) Houses and Residents
| Osceola: | $165,799 |
| Indiana: | $208,700 |
Mean price in 2022:
Detached houses: $182,407
Here: $182,407 State: $257,916
Total population: 2,469 (Urban population: 1,747, Rural population: 6 (all nonfarm))
Houses: 1,012 (1,009 occupied: 828 owner occupied, 160 renter occupied)
| % of renters here: | 16% |
| State: | 29% |
Housing density: 741 houses/condos per square mile
Median price asked for vacant for-sale houses and condos in 2022 in this county: $130,706.
Median contract rent in 2022: $1,107 (lower quartile is $1,042, upper quartile is $1,172)
Median rent asked for vacant for-rent units in 2022: $1,149
Median gross rent in Osceola, IN in 2022: $1,337
Housing units in Osceola with a mortgage: 516 (54 second mortgage, 0 home equity loan, 47 both second mortgage and home equity loan)
Houses without a mortgage: 0
Median household income for houses/condos with a mortgage: $97,946
Median household income for apartments without a mortgage: $52,520
Median monthly housing costs: $999
Compare current foreclosures near Osceola, IN:
| Photo | Address | Area | Beds / Baths | Price | Details |
|---|---|---|---|---|---|

|
#1
Ash Rd
Osceola, IN 46561
|
1,288 sq. feet
|
2 baths 3 beds |
show details | |

|
#2
Ireland Rd
Osceola, IN 46561
|
4,176 sq. feet
|
5 baths 2 beds |
show details | |

|
#3
Beverly Ln
Osceola, IN 46561
|
1,032 sq. feet
|
1 baths 3 beds |
show details | |

|
#4
Morning Mist Trl
Osceola, IN 46561
|
1,728 sq. feet
|
1 baths 3 beds |
show details | |

|
#5
Dawn Dr
Osceola, IN 46561
|
2,048 sq. feet
|
2 baths 4 beds |
show details | |

|
#6
Edison Rd
Osceola, IN 46561
|
1,872 sq. feet
|
1 baths 3 beds |
show details | |

|
#7
Guernsey Ave
Osceola, IN 46561
|
1,724 sq. feet
|
2 baths 3 beds |
show details | |

|
#8
Osceola Ave
Osceola, IN 46561
|
1,228 sq. feet
|
1 baths 3 beds |
show details | |

|
#9
W Superior St
Osceola, IN 46561
|
932 sq. feet
|
1 baths 2 beds |
show details | |

|
#10
Sunset Ct
Osceola, IN 46561
|
1,836 sq. feet
|
2 baths 3 beds |
show details |
| Photo | Address | Area | Beds / Baths | Price | Details |
|---|---|---|---|---|---|

|
#11
Ash Rd
Osceola, IN 46561
|
1,303 sq. feet
|
1 baths 3 beds |
show details | |

|
#12
Edison Rd
Osceola, IN 46561
|
1,092 sq. feet
|
1 baths 3 beds |
show details | |

|
#13
Shepherds Cove Dr
Osceola, IN 46561
|
1,886 sq. feet
|
1 baths 3 beds |
show details | |

|
#14
Rivercrest Dr
Osceola, IN 46561
|
1,080 sq. feet
|
1 baths 3 beds |
show details | |

|
#15
8th St
Osceola, IN 46561
|
1,456 sq. feet
|
2 baths 3 beds |
show details | |

|
#16
Birchwood Ct
Osceola, IN 46561
|
2,328 sq. feet
|
2 baths - beds |
show details | |

|
#17
Ash Rd Lot 320
Osceola, IN 46561
|
- sq. feet
|
- baths - beds |
show details | |

|
#18
Bay Char Ct
Osceola, IN 46561
|
- sq. feet
|
- baths - beds |
show details | |

|
#19
Ash Rd Lot 267
Osceola, IN 46561
|
- sq. feet
|
- baths - beds |
show details | |

|
#20
Wooddale Ave
South Bend, IN 46637
|
861 sq. feet
|
1 baths 2 beds |
$34,900
|
show details |
| Photo | Address | Area | Beds / Baths | Price | Details |
|---|---|---|---|---|---|

|
#21
Cleveland Ave
South Bend, IN 46628
|
1,440 sq. feet
|
1 baths 3 beds |
$129,900
|
show details |

|
#22
N Meade St
South Bend, IN 46628
|
1,568 sq. feet
|
2 baths 3 beds |
$176,500
|
show details |

|
#23
Birch Rd
Osceola, IN 46561
|
- sq. feet
|
- baths - beds |
show details | |

|
#24
Cove St
South Bend, IN 46628
|
1,134 sq. feet
|
1 baths 3 beds |
show details | |

|
#25
N Summit Dr
South Bend, IN 46619
|
1,888 sq. feet
|
2 baths 3 beds |
show details | |

|
#26
Thompson Ave
Elkhart, IN 46514
|
1,253 sq. feet
|
2 baths 2 beds |
show details | |

|
#27
Midway Rd
Elkhart, IN 46517
|
- sq. feet
|
2 baths 3 beds |
show details | |

|
#28
Myrtle Ave
South Bend, IN 46637
|
1,809 sq. feet
|
2 baths 4 beds |
show details | |

|
#29
Springwood Dr
Granger, IN 46530
|
4,512 sq. feet
|
3 baths 3 beds |
show details | |

|
#30
Fair Oaks St E
Niles, MI 49120
|
900 sq. feet
|
1 baths 1 beds |
show details |
| Photo | Address | Area | Beds / Baths | Price | Details |
|---|---|---|---|---|---|

|
#31
Lily Rd
South Bend, IN 46637
|
1,768 sq. feet
|
2 baths 3 beds |
show details | |

|
#32
E Fairview Ave
South Bend, IN 46614
|
816 sq. feet
|
1 baths 2 beds |
show details | |

|
#33
State Road 331
Bremen, IN 46506
|
2,708 sq. feet
|
1 baths 3 beds |
show details | |

|
#34
Penn Ave
Mishawaka, IN 46544
|
1,976 sq. feet
|
1 baths 3 beds |
show details | |

|
#35
Bertrand St
South Bend, IN 46628
|
2,604 sq. feet
|
1 baths 2 beds |
show details | |

|
#36
Obrien St
South Bend, IN 46628
|
1,130 sq. feet
|
1 baths 4 beds |
show details | |

|
#37
S Meade St
South Bend, IN 46619
|
972 sq. feet
|
1 baths 2 beds |
show details | |

|
#38
Bonds Ave
South Bend, IN 46628
|
1,691 sq. feet
|
1 baths 2 beds |
show details | |

|
#39
Conrad Rd
Edwardsburg, MI 49112
|
2,500 sq. feet
|
2 baths 3 beds |
show details | |

|
#40
Sagewood Dr
Mishawaka, IN 46545
|
1,974 sq. feet
|
2 baths 3 beds |
show details |
| Photo | Address | Area | Beds / Baths | Price | Details |
|---|---|---|---|---|---|

|
#41
E Angela Blvd
South Bend, IN 46617
|
1,624 sq. feet
|
1 baths 3 beds |
show details | |

|
#42
Hickory St
Niles, MI 49120
|
1,454 sq. feet
|
1 baths 4 beds |
show details | |

|
#43
Pencross Dr
Granger, IN 46530
|
2,885 sq. feet
|
4 baths 5 beds |
show details | |

|
#44
Myrtle Ave
South Bend, IN 46637
|
988 sq. feet
|
1 baths 3 beds |
show details | |

|
#45
Emma Ln
Vandalia, MI 49095
|
560 sq. feet
|
1 baths 1 beds |
show details | |

|
#46
Lindsey St
South Bend, IN 46616
|
1,560 sq. feet
|
1 baths 5 beds |
show details | |

|
#47
Schumacher Dr
Mishawaka, IN 46545
|
1,416 sq. feet
|
2 baths 2 beds |
show details | |

|
#48
Stonebridge Dr
Elkhart, IN 46514
|
2,389 sq. feet
|
2 baths 4 beds |
show details | |

|
#49
Harris St
South Bend, IN 46619
|
1,062 sq. feet
|
1 baths 3 beds |
show details | |

|
Check over 1 million property listings on Foreclosure.com!
|
browse all offers | |||

Latest news about housing in Osceola, IN collected exclusively by city-data.com from local newspapers, TV, and radio stations

 | Weiss Homes (67 replies) |
| Considering Indiana for a potential relocation (122 replies) |
| South Bend Crime (52 replies) |
| Moving to Elkhart... advice? (12 replies) |
| Is south bend scary ?? Moving question ... (46 replies) |
| Are Mishawaka and Granger suburbs of South Bend? (44 replies) |

Median year apartment built: 1956
Household type by relationship:
Households: 2,587- Male householders: 589 (182 living alone), Female householders: 415 (97 living alone)
566 spouses (566 opposite-sex spouses), 43 unmarried partners, (43 opposite-sex unmarried partners), 823 children (728 natural, 10 adopted, 83 stepchildren), 7 grandchildren, 2 brothers or sisters, 15 parents, 8 foster children, 38 other relatives, 72 non-relatives
Size of family households: 310 2-persons, 168 3-persons, 122 4-persons, 43 5-persons, 15 6-persons, 8 7-or-more-persons.
Size of nonfamily households: 270 1-person, 48 2-persons, 5 3-persons, 1 5-persons.
505 married couples with children.
96 single-parent households (25 men, 71 women).
88.6% of residents of Osceola speak English at home.
1.0% of residents speak Spanish at home (36% speak English very well, 64% speak English well).
1.3% of residents speak other Indo-European language at home (100% speak English very well).
3.6% of residents speak Asian or Pacific Island language at home (100% speak English very well).
5.6% of residents speak other language at home (100% speak English very well).
Foreign born population: 195 (7.5%)
(83.6% of them are naturalized citizens)
| Here: | 5.9 |
| State: | 6.6 |
| Here: | 4.0 |
| State: | 4.3 |

- Bedrooms in owner-occupied houses and condos in Osceola, Indiana
- 0no bedroom
- 151 bedroom
- 1402 bedrooms
- 5053 bedrooms
- 1304 bedrooms
- 395+ bedrooms

- Bedrooms in renter-occupied apartments in Osceola, Indiana
- 0no bedroom
- 01 bedroom
- 1472 bedrooms
- 83 bedrooms
- 54 bedrooms
- 05+ bedrooms

- Cars and other vehicles available in Osceola in owner-occupied houses/condos
- 9no vehicle
- 1841 vehicle
- 3712 vehicles
- 2203 vehicles
- 414 vehicles
- 45+ vehicles

- Cars and other vehicles available in Osceola in renter-occupied apartments
- 0no vehicle
- 291 vehicle
- 192 vehicles
- 1123 vehicles
- 04 vehicles
- 05+ vehicles

- Rooms in owner-occupied houses in Osceola, Indiana
- 01 room
- 02 rooms
- 03 rooms
- 644 rooms
- 2855 rooms
- 1946 rooms
- 1257 rooms
- 678 rooms
- 949+ rooms

- Rooms in renter-occupied apartments in Osceola, Indiana
- 01 room
- 02 rooms
- 103 rooms
- 1274 rooms
- 155 rooms
- 46 rooms
- 07 rooms
- 58 rooms
- 09+ rooms


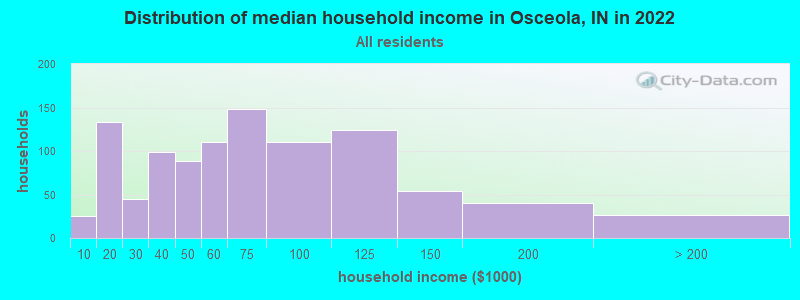
Osceola, IN household income distribution

- 25Less than $10,000
- 133$10,000 to $19,999
- 45$20,000 to $29,999
- 99$30,000 to $39,999
- 89$40,000 to $49,999
- 110$50,000 to $59,999
- 148$60,000 to $74,999
- 110$75,000 to $99,999
- 124$100,000 to $124,999
- 54$125,000 to $149,999
- 40$150,000 to $199,999
- 27$200,000 or more
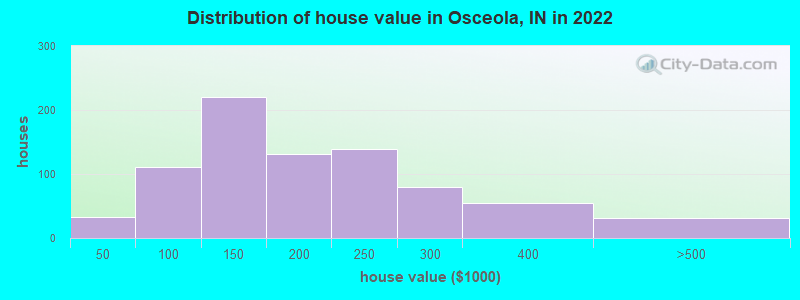
Home value of owner - occupied houses in 2022 in Osceola, IN
-
- 24Less than $10,000
- 3$20,000 to $24,999
- 4$40,000 to $49,999
- 7$50,000 to $59,999
- 6$60,000 to $69,999
- 39$70,000 to $79,999
- 28$80,000 to $89,999
- 23$90,000 to $99,999
- 72$100,000 to $124,999
- 147$125,000 to $149,999
- 58$150,000 to $174,999
- 72$175,000 to $199,999
- 138$200,000 to $249,999
- 79$250,000 to $299,999
- 55$300,000 to $399,999
- 30$400,000 to $499,999
Rent paid by renters in 2022 in Osceola, IN
-
- 12$750 to $799
- 11$800 to $899
- 34$900 to $999
- 106$1,000 to $1,249
- 3No cash rent


Percentage of workers working in this county: 62.4%
Number of people working at home: 152 (11.3% of all workers)
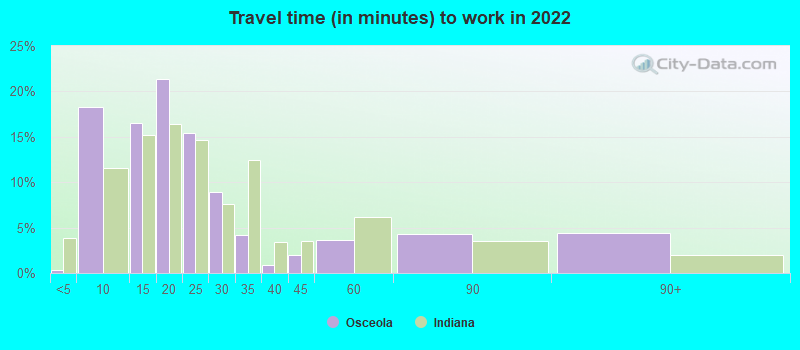
Travel time to work (commute)
- Less than 5 minutes: 21
- 5 to 9 minutes: 130
- 10 to 14 minutes: 145
- 15 to 19 minutes: 309
- 20 to 24 minutes: 144
- 25 to 29 minutes: 57
- 30 to 34 minutes: 200
- 35 to 39 minutes: 52
- 40 to 44 minutes: 23
- 45 to 59 minutes: 44
- 60 to 89 minutes: 19
- 90 or more minutes: 56
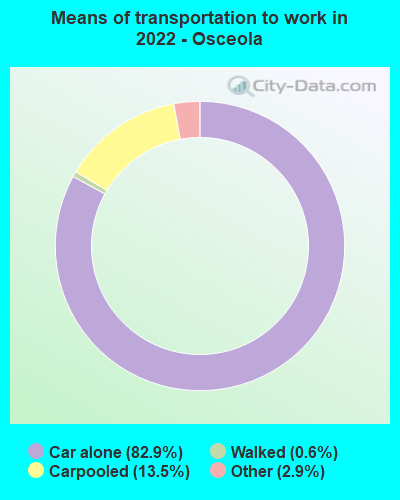
Means of transportation to work:
- Drove a car alone: 622 (67.6%)
- Carpooled: 134 (14.6%)
- Taxi: 22 (2.4%)
- Walked: 4 (0.4%)
- Worked at home: 152 (16.5%)

- Unemployment by race in 2022
- Unemployment rate for White non-Hispanic residents
- 0.6%Males
- 2.2%Females

- Year of entry for the foreign-born population in Osceola, Indiana
- 92010 or later
- 292000 to 2009
- 1281990 to 1999
- 01980 to 1989
- 41970 to 1979
- 26Before 1970

First ancestries reported:
- German: 185 (19.1%)
- American: 112 (11.5%)
- Lebanese: 111 (11.4%)
- English: 108 (11.1%)
- Italian: 53 (5.5%)
- Irish: 31 (3.2%)
- Polish: 31 (3.2%)
- African: 24 (2.5%)
- Serbian: 21 (2.2%)
- Belgian: 16 (1.6%)
- European: 13 (1.3%)
- Swiss: 8 (0.8%)
- Danish: 5 (0.5%)
- Northern European: 4 (0.4%)
- Norwegian: 4 (0.4%)
- Welsh: 4 (0.4%)
- Dutch: 3 (0.3%)
- French: 3 (0.3%)
- Kenyan: 3 (0.3%)
Most common places of birth for foreign-born residents (%):
| Osceola: | 76.6% (141) |
| Indiana: | 0.2% (751) |
| Osceola: | 29.9% (55) |
| Indiana: | 0.4% (1,469) |
| Osceola: | 4.9% (9) |
| Indiana: | 27.0% (101,996) |
| Osceola: | 4.3% (8) |
| Indiana: | 5.3% (19,877) |
| Osceola: | 2.2% (4) |
| Indiana: | 1.7% (6,439) |
Place of birth for U.S.-born residents:
- This state: 1,827
- Other state: 518
- Northeast: 33
- Midwest: 185
- South: 212
- West: 90
83.2% of Osceola residents lived in the same house 1 years ago.
Out of people who lived in different houses, 29.7% lived in this county.
Out of people who lived in different counties, 23.1% lived in Indiana.
| Osceola: | 83.2% |
| State average: | 87.1% |
Education attainment for males 25 years and older:
- No schooling: 0
- Nursery to 4th grade: 0
- 5th and 6th grade: 0
- 7th and 8th grade: 0
- 9th grade: 4
- 10th grade: 38
- 11th grade: 13
- 12th grade, no diploma: 90
- High school graduate (or equivalency): 319
- Less than 1 year of college: 33
- Some college more than 1 year, no degree: 159
- Associate degree: 53
- Bachelor's degree: 201
- Master's degree: 28
- Professional school degree: 0
- Doctorate degree: 0

Education attainment for females 25 years and older:
- No schooling: 0
- Nursery to 4th grade: 0
- 5th and 6th grade: 0
- 7th and 8th grade: 5
- 9th grade: 0
- 10th grade: 8
- 11th grade: 17
- 12th grade, no diploma: 6
- High school graduate (or equivalency): 211
- Less than 1 year of college: 48
- Some college more than 1 year, no degree: 69
- Associate degree: 141
- Bachelor's degree: 252
- Master's degree: 35
- Professional school degree: 12
- Doctorate degree: 3


Housing units in structures:
- One, detached: 960
- One, attached: 17
- Two: 11
- Mobile homes: 24
House/condo owner moved in on average 14 years ago
Renter moved in on average 5 years ago

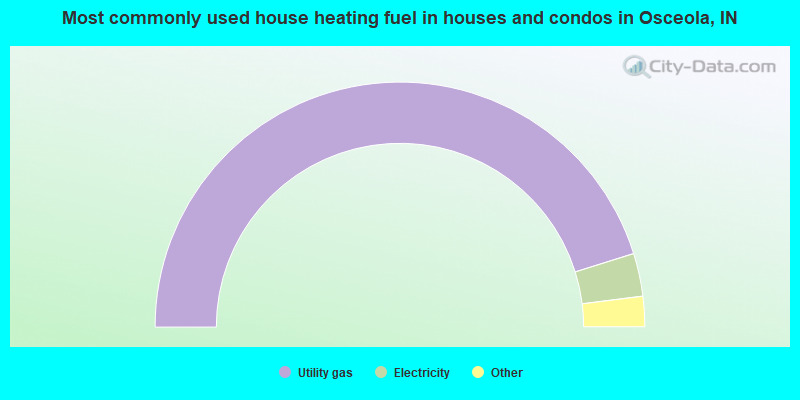
- 90.4%Utility gas
- 5.7%Electricity
- 3.3%Bottled, tank, or LP gas
- 0.6%No fuel used
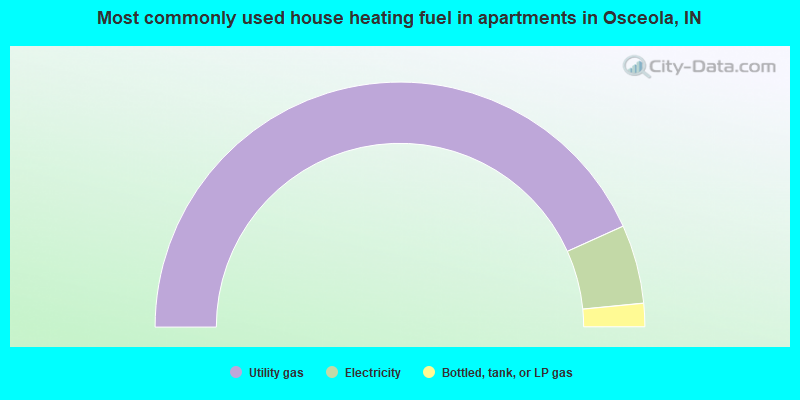
- 86.5%Utility gas
- 10.4%Electricity
- 3.1%Bottled, tank, or LP gas
Private vs. public school enrollment:
| Here: | 14.6% |
| Indiana: | 14.9% |
| Here: | 32.4% |
| Indiana: | 11.4% |
| Here: | 54.4% |
| Indiana: | 22.3% |


