Ossining, NY (New York) Houses and Residents
Estimated median house or condo value in 2022: $439,130 (it was $200,900 in 2000 )
Ossining:
$439,130New York:
$400,400
Lower value quartile - upper value quartile: $312,361 - $526,495Mean price in 2022: Detached houses: $456,828 Here:
$456,828State:
$476,719
Townhouses or other attached units: $398,002 Here:
$398,002State:
$699,270
In 2-unit structures: $525,546 Here:
$525,546State:
$713,077
In 3-to-4-unit structures: $261,118 Here:
$261,118State:
$764,568
In 5-or-more-unit structures: $298,720 Here:
$298,720State:
$912,009
Total population: 25,359 (Urban population: 24,010, Rural population: 0)
Houses: 10,379 (9,881 occupied: 5,345 owner occupied, 4,560 renter occupied )
% of renters here:
46%State:
46%
Housing density: 3,227 houses/condos per square mile
Median price asked for vacant for-sale houses and condos in 2022: $285,152.
Median contract rent in 2022: $1,862 (lower quartile is $1,385, upper quartile is over $2,000)
Median rent asked for vacant for-rent units in 2022: $2,820
Median gross rent in Ossining, NY in 2022: $1,966
Housing units in Ossining with a mortgage: 3,555 (407 second mortgage, 13 home equity loan, 387 both second mortgage and home equity loan )Houses without a mortgage: 33
Median household income for houses/condos with a mortgage: $141,455
Median household income for apartments without a mortgage: $84,112
Median monthly housing costs: $2,195
Data:
Median house or condo value ($)
Median house or condo value ($ change since 2000)
Median house or condo value ($) - White
Median house or condo value ($) - Black or African American
Median house or condo value ($) - Asian
Median house or condo value ($) - Hispanic or Latino
Median house or condo value ($) - American Indian and Alaska Native
Median house or condo value ($) - Multirace
Median house or condo value ($) - Other Race
Median price asked for mobile homes ($)
Household density (households per square mile)
Mean house or condo value by units in structure - 1, detached ($)
Mean house or condo value by units in structure - 1, attached ($)
Mean house or condo value by units in structure - 2 ($)
Mean house or condo value by units in structure by units in structure - 3 or 4 ($)
Mean house or condo value by units in structure - 5 or more ($)
Mean house or condo value by units in structure - Boat, RV, van, etc. ($)
Mean house or condo value by units in structure - Mobile home ($)
Median contract rent ($)
Median contract rent - Lower quartile ($)
Median contract rent - Upper quartile ($)
Median gross rent ($)
Urban houses (%)
Rural houses (%)
Houses occupied (%)
Houses occupied (% change since 2000)
Houses owner occupied (%)
Houses owner occupied (% change since 2000)
Houses renter occupied (%)
Houses renter occupied (% change since 2000)
Vacant housing units - For rent (%)
Vacant housing units - For rent (% change since 2000)
Vacant housing units - For sale only (%)
Vacant housing units - For sale only (% change since 2000)
Vacant housing units - Rented or sold, not occupied (%)
Vacant housing units - Rented or sold, not occupied (% change since 2000)
Vacant housing units - For seasonal, recreational, or occasional use (%)
Vacant housing units - For seasonal, recreational, or occasional use (% change since 2000)
Vacant housing units - For migrant workers (%)
Vacant housing units - For migrant workers (% change since 2000)
Vacant housing units - Other vacant (%)
Vacant housing units - Other vacant (% change since 2000)
Median monthly housing costs ($)
Median household income for houses/condos with a mortgage ($)
Median household income for houses/condos without a mortgage ($)
Median household income ($)
Median household income ($) - White
Median household income ($) - Black or African American
Median household income ($) - Asian
Median household income ($) - Hispanic or Latino
Median household income ($) - American Indian and Alaska Native
Median household income ($) - Multirace
Median household income ($) - Other Race
Mortgage status - with mortgage (%)
Mortgage status - with second mortgage (%)
Mortgage status - with home equity loan (%)
Mortgage status - with both second mortgage and home equity loan (%)
Mortgage status - without a mortgage (%)
Median year house/condo built
Median year apartment built
Household type by relationship - Male householder living alone (%)
Household type by relationship - Male householder not living alone (%)
Household type by relationship - Female householder living alone (%)
Household type by relationship - Female householder not living alone (%)
Household type by relationship - Opposite-Sex spouse (%)
Household type by relationship - Same-Sex spouse (%)
Household type by relationship - Opposite-Sex unmarried partner (%)
Household type by relationship - Same-Sex unmarried partner (%)
Household type by relationship - In group quarters (%)
Size of family households - 2-person household (%)
Size of family households - 3-person household (%)
Size of family households - 4-person household (%)
Size of family households - 5-person household (%)
Size of family households - 6-person household (%)
Size of family households - 7-or-more-person household (%)
Size of nonfamily households - 1-person household (%)
Size of nonfamily households - 2-person household (%)
Size of nonfamily households - 3-person household (%)
Size of nonfamily households - 4-person household (%)
Size of nonfamily households - 5-person household (%)
Size of nonfamily households - 6-person household (%)
Size of nonfamily households - 7-or-moreperson household (%)
Year house built - Built 2010 or later (%)
Year house built - Built 2000 to 2009 (%)
Year house built - Built 1990 to 1999 (%)
Year house built - Built 1980 to 1989 (%)
Year house built - Built 1970 to 1979 (%)
Year house built - Built 1960 to 1969 (%)
Year house built - Built 1950 to 1959 (%)
Year house built - Built 1940 to 1949 (%)
Year house built - Built 1939 or earlier (%)
Median number of rooms in houses and condos
Median number of rooms in apartments
Median number of bedrooms in owner occupied houses
Mean number of bedrooms in owner occupied houses
Median number of bedrooms in renter occupied houses
Mean number of bedrooms in renter occupied houses
Median number of vehichles in owner occupied houses
Mean number of vehichles in owner occupied houses
Median number of vehichles in renter occupied houses
Mean number of vehichles in renter occupied houses
Rooms in owner-occupied houses - 1 room (%)
Rooms in owner-occupied houses - 2 rooms (%)
Rooms in owner-occupied houses - 3 rooms (%)
Rooms in owner-occupied houses - 4 rooms (%)
Rooms in owner-occupied houses - 5 rooms (%)
Rooms in owner-occupied houses - 6 rooms (%)
Rooms in owner-occupied houses - 7 rooms (%)
Rooms in owner-occupied houses - 8 rooms (%)
Rooms in owner-occupied houses - 9+ rooms (%)
Rooms in renter-occupied houses - 1 room (%)
Rooms in renter-occupied houses - 2 rooms (%)
Rooms in renter-occupied houses - 3 rooms (%)
Rooms in renter-occupied houses - 4 rooms (%)
Rooms in renter-occupied houses - 5 rooms (%)
Rooms in renter-occupied houses - 6 rooms (%)
Rooms in renter-occupied houses - 7 rooms (%)
Rooms in renter-occupied houses - 8 rooms (%)
Rooms in renter-occupied houses - 9+ rooms (%)
Bedrooms in owner-occupied houses - no bedrooms (%)
Bedrooms in owner-occupied houses - 1 bedroom (%)
Bedrooms in owner-occupied houses - 2 bedrooms (%)
Bedrooms in owner-occupied houses - 3 bedrooms (%)
Bedrooms in owner-occupied houses - 4 bedrooms (%)
Bedrooms in owner-occupied houses - 5+ bedrooms (%)
Bedrooms in renter-occupied houses - no bedrooms (%)
Bedrooms in renter-occupied houses - 1 bedroom (%)
Bedrooms in renter-occupied houses - 2 bedrooms (%)
Bedrooms in renter-occupied houses - 3 bedrooms (%)
Bedrooms in renter-occupied houses - 4 bedrooms (%)
Bedrooms in renter-occupied houses - 5+ bedrooms (%)
Vehicles available in owner-occupied houses - no vehicle available (%)
Vehicles available in owner-occupied houses - 1 vehicle available(%)
Vehicles available in owner-occupied houses - 2 Vehicles available (%)
Vehicles available in owner-occupied houses - 3 Vehicles available (%)
Vehicles available in owner-occupied houses - 4 Vehicles available (%)
Vehicles available in owner-occupied houses - 5+ Vehicles available (%)
Vehicles available in renter-occupied houses - no vehicle available (%)
Vehicles available in renter-occupied houses - 1 vehicle available (%)
Vehicles available in renter-occupied houses - 2 Vehicles available (%)
Vehicles available in renter-occupied houses - 3 Vehicles available (%)
Vehicles available in renter-occupied houses - 4 Vehicles available (%)
Vehicles available in renter-occupied houses - 5+ Vehicles available (%)
Housing units in structures - 1, detached (%)
Housing units in structures - 1, attached (%)
Housing units in structures - 2 (%)
Housing units in structures - 3 or 4 (%)
Housing units in structures - 5 to 9 (%)
Housing units in structures - 10 to 19 (%)
Housing units in structures - 20 to 49 (%)
Housing units in structures - 50 or more (%)
Housing units in structures - Mobile home (%)
Housing units in structures - Boat, RV, van, etc. (%)
Housing units in structures - Owners - 1, detached (%)
Housing units in structures - Owners - 1, attached (%)
Housing units in structures - Owners - 2 (%)
Housing units in structures - Owners - 3 or 4 (%)
Housing units in structures - Owners - 5 to 9 (%)
Housing units in structures - Owners - 10 to 19 (%)
Housing units in structures - Owners - 20 to 49 (%)
Housing units in structures - Owners - 50 or more (%)
Housing units in structures - Owners - Mobile home (%)
Housing units in structures - Owners - Boat, RV, van, etc. (%)
Housing units in structures - Renters - 1, detached (%)
Housing units in structures - Renters - 1, attached (%)
Housing units in structures - Renters - 2 (%)
Housing units in structures - Renters - 3 or 4 (%)
Housing units in structures - Renters - 5 to 9 (%)
Housing units in structures - Renters - 10 to 19 (%)
Housing units in structures - Renters - 20 to 49 (%)
Housing units in structures - Renters - 50 or more (%)
Housing units in structures - Renters - Mobile home (%)
Housing units in structures - Renters - Boat, RV, van, etc. (%)
House/condo owner moved in on average (years ago)
Renter moved in on average (years ago)
Year householder moved into unit - Moved in 1999 to March 2000 (%)
Year householder moved into unit - Moved in 1999 to March 2000 (%) - White
Year householder moved into unit - Moved in 1999 to March 2000 (%) - Black or African American
Year householder moved into unit - Moved in 1999 to March 2000 (%) - Asian
Year householder moved into unit - Moved in 1999 to March 2000 (%) - Hispanic or Latino
Year householder moved into unit - Moved in 1999 to March 2000 (%) - American Indian and Alaska Native
Year householder moved into unit - Moved in 1999 to March 2000 (%) - Multirace
Year householder moved into unit - Moved in 1999 to March 2000 (%) - Other Race
Year householder moved into unit - Moved in 1995 to 1998 (%)
Year householder moved into unit - Moved in 1995 to 1998 (%) - White
Year householder moved into unit - Moved in 1995 to 1998 (%) - Black or African American
Year householder moved into unit - Moved in 1995 to 1998 (%) - Asian
Year householder moved into unit - Moved in 1995 to 1998 (%) - Hispanic or Latino
Year householder moved into unit - Moved in 1995 to 1998 (%) - American Indian and Alaska Native
Year householder moved into unit - Moved in 1995 to 1998 (%) - Multirace
Year householder moved into unit - Moved in 1995 to 1998 (%) - Other Race
Year householder moved into unit - Moved in 1990 to 1994 (%)
Year householder moved into unit - Moved in 1990 to 1994 (%) - White
Year householder moved into unit - Moved in 1990 to 1994 (%) - Black or African American
Year householder moved into unit - Moved in 1990 to 1994 (%) - Asian
Year householder moved into unit - Moved in 1990 to 1994 (%) - Hispanic or Latino
Year householder moved into unit - Moved in 1990 to 1994 (%) - American Indian and Alaska Native
Year householder moved into unit - Moved in 1990 to 1994 (%) - Multirace
Year householder moved into unit - Moved in 1990 to 1994 (%) - Other Race
Year householder moved into unit - Moved in 1980 to 1989 (%)
Year householder moved into unit - Moved in 1980 to 1989 (%) - White
Year householder moved into unit - Moved in 1980 to 1989 (%) - Black or African American
Year householder moved into unit - Moved in 1980 to 1989 (%) - Asian
Year householder moved into unit - Moved in 1980 to 1989 (%) - Hispanic or Latino
Year householder moved into unit - Moved in 1980 to 1989 (%) - American Indian and Alaska Native
Year householder moved into unit - Moved in 1980 to 1989 (%) - Multirace
Year householder moved into unit - Moved in 1980 to 1989 (%) - Other Race
Year householder moved into unit - Moved in 1970 to 1979 (%)
Year householder moved into unit - Moved in 1970 to 1979 (%) - White
Year householder moved into unit - Moved in 1970 to 1979 (%) - Black or African American
Year householder moved into unit - Moved in 1970 to 1979 (%) - Asian
Year householder moved into unit - Moved in 1970 to 1979 (%) - Hispanic or Latino
Year householder moved into unit - Moved in 1970 to 1979 (%) - American Indian and Alaska Native
Year householder moved into unit - Moved in 1970 to 1979 (%) - Multirace
Year householder moved into unit - Moved in 1970 to 1979 (%) - Other Race
Year householder moved into unit - Moved in 1969 or earlier (%)
Year householder moved into unit - Moved in 1969 or earlier (%) - White
Year householder moved into unit - Moved in 1969 or earlier (%) - Black or African American
Year householder moved into unit - Moved in 1969 or earlier (%) - Asian
Year householder moved into unit - Moved in 1969 or earlier (%) - Hispanic or Latino
Year householder moved into unit - Moved in 1969 or earlier (%) - American Indian and Alaska Native
Year householder moved into unit - Moved in 1969 or earlier (%) - Multirace
Year householder moved into unit - Moved in 1969 or earlier (%) - Other Race
Housing units lacking complete plumbing facilities (%)
Housing units lacking complete kitchen facilities (%)
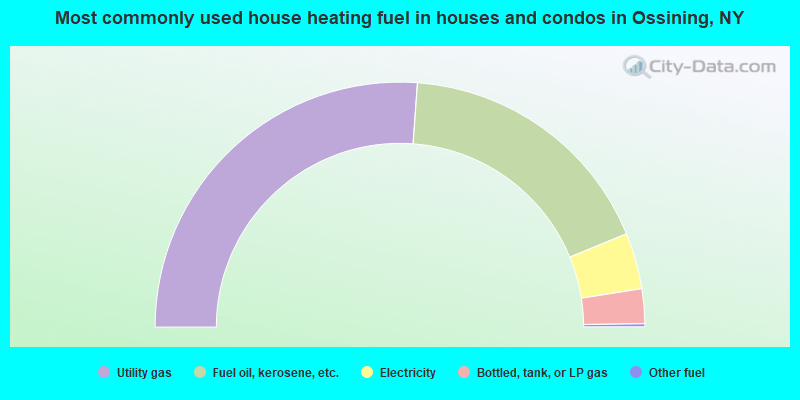
House heating fuel used in houses and condos - Utility gas (%)
House heating fuel used in houses and condos - Bottled, tank, or LP gas (%)
House heating fuel used in houses and condos - Electricity (%)
House heating fuel used in houses and condos - Fuel oil, kerosene, etc. (%)
House heating fuel used in houses and condos - Coal or coke (%)
House heating fuel used in houses and condos - Wood (%)
House heating fuel used in houses and condos - Solar energy (%)
House heating fuel used in houses and condos - Other fuel (%)
House heating fuel used in houses and condos - No fuel used (%)
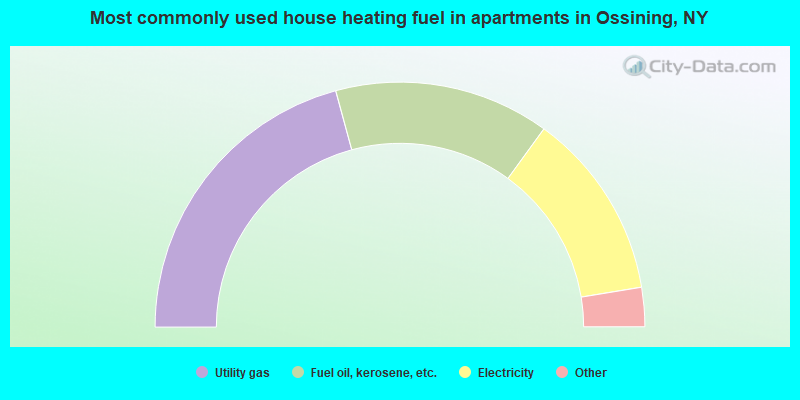
House heating fuel used in apartments - Utility gas (%)
House heating fuel used in apartments - Bottled, tank, or LP gas (%)
House heating fuel used in apartments - Electricity (%)
House heating fuel used in apartments - Fuel oil, kerosene, etc. (%)
House heating fuel used in apartments - Coal or coke (%)
House heating fuel used in apartments - Wood (%)
House heating fuel used in apartments - Solar energy (%)
House heating fuel used in apartments - Other fuel (%)
House heating fuel used in apartments - No fuel used (%)
Latest news about housing in Ossining, NY collected exclusively by city-data.com from local newspapers, TV, and radio stations
Median year house/condo built: 1959Median year apartment built: 1961Household type by relationship:
Households: 26,873
Male householders: 4,928 (1,100 living alone ), Female householders: 4,751 (1,340 living alone )4,709 spouses (4,592 opposite-sex spouses ), 882 unmarried partners , (850 opposite-sex unmarried partners ), 7,083 children (6,696 natural , 297 adopted , 89 stepchildren ), 223 grandchildren , 415 brothers or sisters , 561 parents , 70 foster children , 773 other relatives , 865 non-relatives In group quarters: 1,607
Size of family households: 2,504 2-persons , 1,589 3-persons , 1,176 4-persons , 961 5-persons , 203 6-persons , 64 7-or-more-persons .
Size of nonfamily households: 2,653 1-person , 695 2-persons , 36 3-persons , 11 4-persons , 25 5-persons .
3,495 married couples with children. single-parent households (301 men , 1,006 women ).
53.2% of residents of Ossining speak English at home. of residents speak Spanish at home (48% speak English very well , 22% speak English well , 21% speak English not well , 9% don't speak English at all ).of residents speak other Indo-European language at home (66% speak English very well , 23% speak English well , 10% speak English not well ).of residents speak Asian or Pacific Island language at home (62% speak English very well , 16% speak English well , 19% speak English not well , 3% don't speak English at all ).of residents speak other language at home (100% speak English very well ).
Foreign born population: 8,939 (33.3%)of them are naturalized citizens )
Median number of rooms in houses and condos:
Median number of rooms in apartments
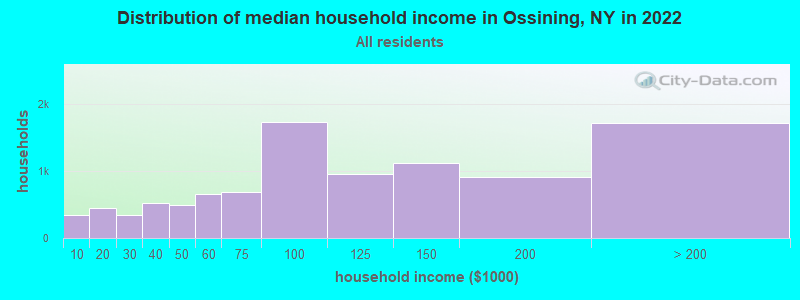
Ossining, NY household income distribution 337 Less than $10,000444 $10,000 to $19,999350 $20,000 to $29,999520 $30,000 to $39,999489 $40,000 to $49,999662 $50,000 to $59,999688 $60,000 to $74,9991,729 $75,000 to $99,999959 $100,000 to $124,9991,119 $125,000 to $149,999912 $150,000 to $199,9991,718 $200,000 or more
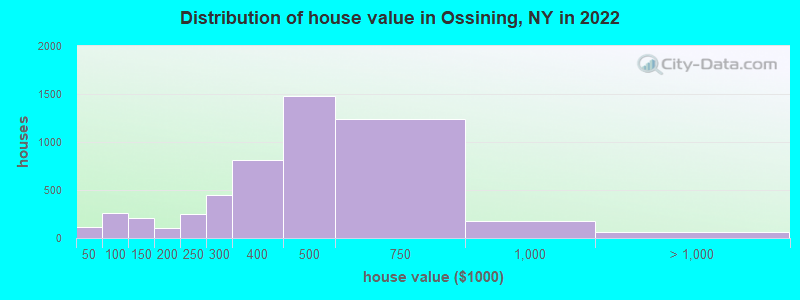
Home value of owner - occupied houses in 2022 in Ossining, NY 47 Less than $10,00066 $40,000 to $49,99918 $50,000 to $59,999107 $60,000 to $69,99915 $70,000 to $79,99951 $80,000 to $89,999126 $100,000 to $124,99977 $125,000 to $149,99949 $150,000 to $174,99955 $175,000 to $199,999250 $200,000 to $249,999449 $250,000 to $299,999811 $300,000 to $399,9991,475 $400,000 to $499,9991,238 $500,000 to $749,999181 $750,000 to $999,99920 $1,000,000 to $1,499,99934 $1,500,000 to $1,999,9994 $2,000,000 or moreRent paid by renters in 2022 in Ossining, NY 14 $250 to $2996 $450 to $4996 $500 to $54918 $550 to $59945 $650 to $69953 $700 to $74964 $800 to $899521 $1,000 to $1,249475 $1,250 to $1,4991,298 $1,500 to $1,9991,115 $2,000 to $2,499503 $2,500 to $2,99987 $3,000 to $3,499195 $3,500 or more73 No cash rent
Percentage of workers working in this county: 72.6%Number of people working at home: 2,110 (15.4% of all workers )
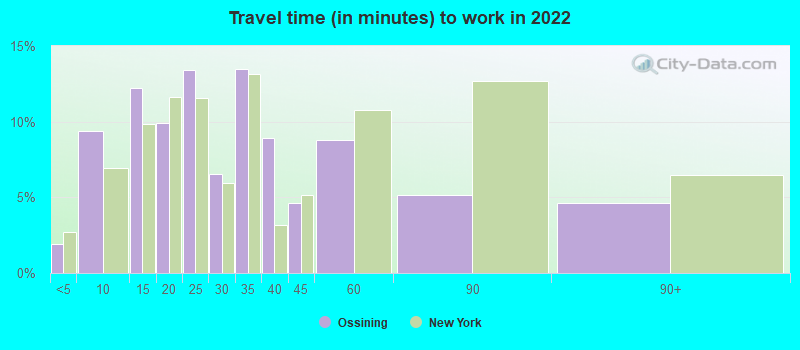
Travel time to work (commute)
Less than 5 minutes: 1625 to 9 minutes: 99410 to 14 minutes: 82415 to 19 minutes: 1,30720 to 24 minutes: 1,47925 to 29 minutes: 66130 to 34 minutes: 1,55935 to 39 minutes: 21640 to 44 minutes: 38945 to 59 minutes: 1,47860 to 89 minutes: 1,30690 or more minutes: 1,080
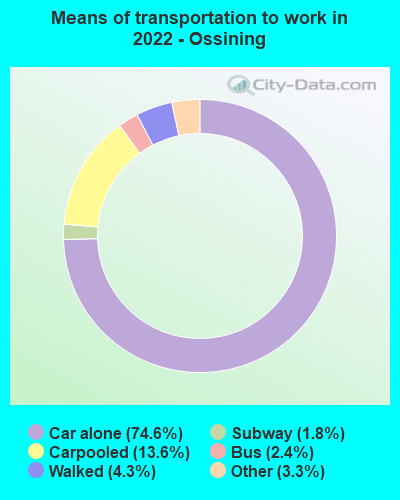
Means of transportation to work:
Drove a car alone: 4,488 (55.5%)Carpooled: 827 (10.2%)Bus : 126 (1.6%)Long-distance train or commuter rail : 81 (1.0%)Taxi: 343 (4.2%)Walked: 257 (3.2%)Worked at home: 2,110 (26.1%)
Unemployment by race in 2022
Unemployment rate for White non-Hispanic residents 4.2% Males1.0% FemalesUnemployment rate for Black residents 21.3% FemalesUnemployment rate for Asian residents 0.2% Males4.8% FemalesUnemployment rate for other race residents 3.8% Males3.2% FemalesUnemployment rate for two or more race residents 2.7% Males6.9% FemalesUnemployment rate for Hispanic or Latino residents 2.4% Males2.8% Females
Year of entry for the foreign-born population in Ossining, New York
2,123 2010 or later 2,428 2000 to 2009 2,061 1990 to 1999 1,959 1980 to 1989 834 1970 to 1979 774 Before 1970
First ancestries reported:
Italian: 1,266 (8.5%)
Irish: 584 (3.9%)
American: 553 (3.7%)
Jamaican: 501 (3.4%)
European: 430 (2.9%)
German: 307 (2.1%)
Albanian: 200 (1.3%)
Hungarian: 180 (1.2%)
Polish: 168 (1.1%)
Portuguese: 152 (1.0%)
Greek: 144 (1.0%)
Haitian: 128 (0.9%)
English: 121 (0.8%)
Iranian: 113 (0.8%)
Slovak: 93 (0.6%)
Norwegian: 88 (0.6%)
Russian: 86 (0.6%)
French: 74 (0.5%)
New Zealander: 67 (0.5%)
African: 56 (0.4%)
Trinidadian and Tobagonian: 36 (0.2%)
Eastern European: 34 (0.2%)
Guyanese: 30 (0.2%)
Ukrainian: 29 (0.2%)
French Canadian: 27 (0.2%)
Swedish: 25 (0.2%)
Jordanian: 24 (0.2%)
Armenian: 23 (0.2%)
Ghanaian: 16 (0.1%)
Croatian: 15 (0.1%)
Northern European: 15 (0.1%)
Scottish: 13 (0.09%)
Austrian: 12 (0.08%)
Dutch: 12 (0.08%)
Palestinian: 11 (0.07%)
West Indian: 11 (0.07%)
Syrian: 9 (0.06%)
Danish: 8 (0.05%)
Nigerian: 7 (0.05%)
Barbadian: 3 (0.02%)
Scandinavian: 2 (0.01%) Most common places of birth for foreign-born residents (%): Ecuador Ossining:
29.6% (2,623)New York:
3.9% (177,448)
Colombia Ossining:
11.2% (995)New York:
2.5% (111,920)
Dominican Republic Ossining:
5.7% (501)New York:
11.1% (501,040)
Jamaica Ossining:
3.8% (332)New York:
5.0% (227,557)
Peru Ossining:
3.6% (315)New York:
1.2% (54,759)
India Ossining:
3.5% (307)New York:
3.5% (158,432)
Mexico Ossining:
3.4% (301)New York:
4.8% (214,559)
Guatemala Ossining:
3.0% (263)New York:
1.4% (61,245)
Honduras Ossining:
2.7% (242)New York:
1.2% (55,571)
El Salvador Ossining:
2.3% (203)New York:
2.4% (108,067)
Norway Ossining:
2.2% (196)New York:
0.1% (2,334)
Uruguay Ossining:
2.2% (192)New York:
0.1% (5,566)
Greece Ossining:
1.8% (162)New York:
0.6% (28,604)
China, excluding Hong Kong and Taiwan Ossining:
1.7% (152)New York:
9.1% (410,910)
Portugal Ossining:
1.6% (144)New York:
0.2% (10,519)
Italy Ossining:
1.6% (143)New York:
1.8% (81,374)
Place of birth for U.S.-born residents:
This state: 14,815Other state: 2,095Northeast: 860Midwest: 489South: 462West: 314 85.6% of Ossining residents lived in the same house 1 years ago.
Out of people who lived in different houses, 35.3% lived in this county.
Out of people who lived in different counties, 86.6% lived in New York.
Ossining:
85.6%State average:
89.6%
Education attainment for males 25 years and older:
No schooling: 504Nursery to 4th grade: 555th and 6th grade: 2057th and 8th grade: 3199th grade: 6210th grade: 11711th grade: 19012th grade, no diploma: 439High school graduate (or equivalency): 2,184Less than 1 year of college: 341Some college more than 1 year, no degree: 1,608Associate degree: 876Bachelor's degree: 1,916Master's degree: 1,206Professional school degree: 364Doctorate degree: 110
Education attainment for females 25 years and older:
No schooling: 620Nursery to 4th grade: 245th and 6th grade: 1597th and 8th grade: 549th grade: 5010th grade: 11411th grade: 13112th grade, no diploma: 189High school graduate (or equivalency): 1,481Less than 1 year of college: 353Some college more than 1 year, no degree: 1,003Associate degree: 574Bachelor's degree: 2,012Master's degree: 1,866Professional school degree: 472Doctorate degree: 183
Housing units in structures:
One, detached: 3,209One, attached: 1,005Two: 1,4943 or 4: 1,0515 to 9: 99310 to 19: 48520 to 49: 46750 or more: 1,663Mobile homes: 8Housing units lacking complete plumbing facilities in 2022: 0.1%Housing units lacking complete kitchen facilities in 2022: 2.0%House/condo owner moved in on average 11 years ago
Renter moved in on average 3 years ago
Private vs. public school enrollment:
Students in private schools in grades 1 to 8 (elementary and middle school): 71 Students in private schools in grades 9 to 12 (high school): 176 Students in private undergraduate colleges: 415