Oswego, IL (Illinois) Houses and Residents
Estimated median house or condo value in 2022: $324,799 (it was $170,800 in 2000 )
Oswego:
$324,799Illinois:
$251,600
Lower value quartile - upper value quartile: $252,417 - $399,853Mean price in 2022: Detached houses: $325,937 Here:
$325,937State:
$310,164
Townhouses or other attached units: $210,339 Here:
$210,339State:
$286,230
In 2-unit structures: $238,038 Here:
$238,038State:
$299,638
In 3-to-4-unit structures: $157,349 Here:
$157,349State:
$330,907
Total population: 33,099 (Urban population: 13,153, Rural population: 147 (all nonfarm) )
Houses: 12,570 (12,566 occupied: 11,099 owner occupied, 1,460 renter occupied )
% of renters here:
12%State:
33%
Housing density: 1,910 houses/condos per square mile
Median price asked for vacant for-sale houses and condos in 2022 in this county: $178,815.
Median contract rent in 2022: $1,445 (lower quartile is $858, upper quartile is over $2,000)
Median rent asked for vacant for-rent units in 2022: $43,010
Median gross rent in Oswego, IL in 2022: $1,575
Housing units in Oswego with a mortgage: 8,290 (720 second mortgage, 29 home equity loan, 448 both second mortgage and home equity loan )Houses without a mortgage: 134
Median household income for houses/condos with a mortgage: $121,425
Median household income for apartments without a mortgage: $86,867
Median monthly housing costs: $1,852
Data:
Median house or condo value ($)
Median house or condo value ($ change since 2000)
Median house or condo value ($) - White
Median house or condo value ($) - Black or African American
Median house or condo value ($) - Asian
Median house or condo value ($) - Hispanic or Latino
Median house or condo value ($) - American Indian and Alaska Native
Median house or condo value ($) - Multirace
Median house or condo value ($) - Other Race
Median price asked for mobile homes ($)
Household density (households per square mile)
Mean house or condo value by units in structure - 1, detached ($)
Mean house or condo value by units in structure - 1, attached ($)
Mean house or condo value by units in structure - 2 ($)
Mean house or condo value by units in structure by units in structure - 3 or 4 ($)
Mean house or condo value by units in structure - 5 or more ($)
Mean house or condo value by units in structure - Boat, RV, van, etc. ($)
Mean house or condo value by units in structure - Mobile home ($)
Median contract rent ($)
Median contract rent - Lower quartile ($)
Median contract rent - Upper quartile ($)
Median gross rent ($)
Urban houses (%)
Rural houses (%)
Houses occupied (%)
Houses occupied (% change since 2000)
Houses owner occupied (%)
Houses owner occupied (% change since 2000)
Houses renter occupied (%)
Houses renter occupied (% change since 2000)
Vacant housing units - For rent (%)
Vacant housing units - For rent (% change since 2000)
Vacant housing units - For sale only (%)
Vacant housing units - For sale only (% change since 2000)
Vacant housing units - Rented or sold, not occupied (%)
Vacant housing units - Rented or sold, not occupied (% change since 2000)
Vacant housing units - For seasonal, recreational, or occasional use (%)
Vacant housing units - For seasonal, recreational, or occasional use (% change since 2000)
Vacant housing units - For migrant workers (%)
Vacant housing units - For migrant workers (% change since 2000)
Vacant housing units - Other vacant (%)
Vacant housing units - Other vacant (% change since 2000)
Median monthly housing costs ($)
Median household income for houses/condos with a mortgage ($)
Median household income for houses/condos without a mortgage ($)
Median household income ($)
Median household income ($) - White
Median household income ($) - Black or African American
Median household income ($) - Asian
Median household income ($) - Hispanic or Latino
Median household income ($) - American Indian and Alaska Native
Median household income ($) - Multirace
Median household income ($) - Other Race
Mortgage status - with mortgage (%)
Mortgage status - with second mortgage (%)
Mortgage status - with home equity loan (%)
Mortgage status - with both second mortgage and home equity loan (%)
Mortgage status - without a mortgage (%)
Median year house/condo built
Median year apartment built
Household type by relationship - Male householder living alone (%)
Household type by relationship - Male householder not living alone (%)
Household type by relationship - Female householder living alone (%)
Household type by relationship - Female householder not living alone (%)
Household type by relationship - Opposite-Sex spouse (%)
Household type by relationship - Same-Sex spouse (%)
Household type by relationship - Opposite-Sex unmarried partner (%)
Household type by relationship - Same-Sex unmarried partner (%)
Household type by relationship - In group quarters (%)
Size of family households - 2-person household (%)
Size of family households - 3-person household (%)
Size of family households - 4-person household (%)
Size of family households - 5-person household (%)
Size of family households - 6-person household (%)
Size of family households - 7-or-more-person household (%)
Size of nonfamily households - 1-person household (%)
Size of nonfamily households - 2-person household (%)
Size of nonfamily households - 3-person household (%)
Size of nonfamily households - 4-person household (%)
Size of nonfamily households - 5-person household (%)
Size of nonfamily households - 6-person household (%)
Size of nonfamily households - 7-or-moreperson household (%)
Year house built - Built 2010 or later (%)
Year house built - Built 2000 to 2009 (%)
Year house built - Built 1990 to 1999 (%)
Year house built - Built 1980 to 1989 (%)
Year house built - Built 1970 to 1979 (%)
Year house built - Built 1960 to 1969 (%)
Year house built - Built 1950 to 1959 (%)
Year house built - Built 1940 to 1949 (%)
Year house built - Built 1939 or earlier (%)
Median number of rooms in houses and condos
Median number of rooms in apartments
Median number of bedrooms in owner occupied houses
Mean number of bedrooms in owner occupied houses
Median number of bedrooms in renter occupied houses
Mean number of bedrooms in renter occupied houses
Median number of vehichles in owner occupied houses
Mean number of vehichles in owner occupied houses
Median number of vehichles in renter occupied houses
Mean number of vehichles in renter occupied houses
Rooms in owner-occupied houses - 1 room (%)
Rooms in owner-occupied houses - 2 rooms (%)
Rooms in owner-occupied houses - 3 rooms (%)
Rooms in owner-occupied houses - 4 rooms (%)
Rooms in owner-occupied houses - 5 rooms (%)
Rooms in owner-occupied houses - 6 rooms (%)
Rooms in owner-occupied houses - 7 rooms (%)
Rooms in owner-occupied houses - 8 rooms (%)
Rooms in owner-occupied houses - 9+ rooms (%)
Rooms in renter-occupied houses - 1 room (%)
Rooms in renter-occupied houses - 2 rooms (%)
Rooms in renter-occupied houses - 3 rooms (%)
Rooms in renter-occupied houses - 4 rooms (%)
Rooms in renter-occupied houses - 5 rooms (%)
Rooms in renter-occupied houses - 6 rooms (%)
Rooms in renter-occupied houses - 7 rooms (%)
Rooms in renter-occupied houses - 8 rooms (%)
Rooms in renter-occupied houses - 9+ rooms (%)
Bedrooms in owner-occupied houses - no bedrooms (%)
Bedrooms in owner-occupied houses - 1 bedroom (%)
Bedrooms in owner-occupied houses - 2 bedrooms (%)
Bedrooms in owner-occupied houses - 3 bedrooms (%)
Bedrooms in owner-occupied houses - 4 bedrooms (%)
Bedrooms in owner-occupied houses - 5+ bedrooms (%)
Bedrooms in renter-occupied houses - no bedrooms (%)
Bedrooms in renter-occupied houses - 1 bedroom (%)
Bedrooms in renter-occupied houses - 2 bedrooms (%)
Bedrooms in renter-occupied houses - 3 bedrooms (%)
Bedrooms in renter-occupied houses - 4 bedrooms (%)
Bedrooms in renter-occupied houses - 5+ bedrooms (%)
Vehicles available in owner-occupied houses - no vehicle available (%)
Vehicles available in owner-occupied houses - 1 vehicle available(%)
Vehicles available in owner-occupied houses - 2 Vehicles available (%)
Vehicles available in owner-occupied houses - 3 Vehicles available (%)
Vehicles available in owner-occupied houses - 4 Vehicles available (%)
Vehicles available in owner-occupied houses - 5+ Vehicles available (%)
Vehicles available in renter-occupied houses - no vehicle available (%)
Vehicles available in renter-occupied houses - 1 vehicle available (%)
Vehicles available in renter-occupied houses - 2 Vehicles available (%)
Vehicles available in renter-occupied houses - 3 Vehicles available (%)
Vehicles available in renter-occupied houses - 4 Vehicles available (%)
Vehicles available in renter-occupied houses - 5+ Vehicles available (%)
Housing units in structures - 1, detached (%)
Housing units in structures - 1, attached (%)
Housing units in structures - 2 (%)
Housing units in structures - 3 or 4 (%)
Housing units in structures - 5 to 9 (%)
Housing units in structures - 10 to 19 (%)
Housing units in structures - 20 to 49 (%)
Housing units in structures - 50 or more (%)
Housing units in structures - Mobile home (%)
Housing units in structures - Boat, RV, van, etc. (%)
Housing units in structures - Owners - 1, detached (%)
Housing units in structures - Owners - 1, attached (%)
Housing units in structures - Owners - 2 (%)
Housing units in structures - Owners - 3 or 4 (%)
Housing units in structures - Owners - 5 to 9 (%)
Housing units in structures - Owners - 10 to 19 (%)
Housing units in structures - Owners - 20 to 49 (%)
Housing units in structures - Owners - 50 or more (%)
Housing units in structures - Owners - Mobile home (%)
Housing units in structures - Owners - Boat, RV, van, etc. (%)
Housing units in structures - Renters - 1, detached (%)
Housing units in structures - Renters - 1, attached (%)
Housing units in structures - Renters - 2 (%)
Housing units in structures - Renters - 3 or 4 (%)
Housing units in structures - Renters - 5 to 9 (%)
Housing units in structures - Renters - 10 to 19 (%)
Housing units in structures - Renters - 20 to 49 (%)
Housing units in structures - Renters - 50 or more (%)
Housing units in structures - Renters - Mobile home (%)
Housing units in structures - Renters - Boat, RV, van, etc. (%)
House/condo owner moved in on average (years ago)
Renter moved in on average (years ago)
Year householder moved into unit - Moved in 1999 to March 2000 (%)
Year householder moved into unit - Moved in 1999 to March 2000 (%) - White
Year householder moved into unit - Moved in 1999 to March 2000 (%) - Black or African American
Year householder moved into unit - Moved in 1999 to March 2000 (%) - Asian
Year householder moved into unit - Moved in 1999 to March 2000 (%) - Hispanic or Latino
Year householder moved into unit - Moved in 1999 to March 2000 (%) - American Indian and Alaska Native
Year householder moved into unit - Moved in 1999 to March 2000 (%) - Multirace
Year householder moved into unit - Moved in 1999 to March 2000 (%) - Other Race
Year householder moved into unit - Moved in 1995 to 1998 (%)
Year householder moved into unit - Moved in 1995 to 1998 (%) - White
Year householder moved into unit - Moved in 1995 to 1998 (%) - Black or African American
Year householder moved into unit - Moved in 1995 to 1998 (%) - Asian
Year householder moved into unit - Moved in 1995 to 1998 (%) - Hispanic or Latino
Year householder moved into unit - Moved in 1995 to 1998 (%) - American Indian and Alaska Native
Year householder moved into unit - Moved in 1995 to 1998 (%) - Multirace
Year householder moved into unit - Moved in 1995 to 1998 (%) - Other Race
Year householder moved into unit - Moved in 1990 to 1994 (%)
Year householder moved into unit - Moved in 1990 to 1994 (%) - White
Year householder moved into unit - Moved in 1990 to 1994 (%) - Black or African American
Year householder moved into unit - Moved in 1990 to 1994 (%) - Asian
Year householder moved into unit - Moved in 1990 to 1994 (%) - Hispanic or Latino
Year householder moved into unit - Moved in 1990 to 1994 (%) - American Indian and Alaska Native
Year householder moved into unit - Moved in 1990 to 1994 (%) - Multirace
Year householder moved into unit - Moved in 1990 to 1994 (%) - Other Race
Year householder moved into unit - Moved in 1980 to 1989 (%)
Year householder moved into unit - Moved in 1980 to 1989 (%) - White
Year householder moved into unit - Moved in 1980 to 1989 (%) - Black or African American
Year householder moved into unit - Moved in 1980 to 1989 (%) - Asian
Year householder moved into unit - Moved in 1980 to 1989 (%) - Hispanic or Latino
Year householder moved into unit - Moved in 1980 to 1989 (%) - American Indian and Alaska Native
Year householder moved into unit - Moved in 1980 to 1989 (%) - Multirace
Year householder moved into unit - Moved in 1980 to 1989 (%) - Other Race
Year householder moved into unit - Moved in 1970 to 1979 (%)
Year householder moved into unit - Moved in 1970 to 1979 (%) - White
Year householder moved into unit - Moved in 1970 to 1979 (%) - Black or African American
Year householder moved into unit - Moved in 1970 to 1979 (%) - Asian
Year householder moved into unit - Moved in 1970 to 1979 (%) - Hispanic or Latino
Year householder moved into unit - Moved in 1970 to 1979 (%) - American Indian and Alaska Native
Year householder moved into unit - Moved in 1970 to 1979 (%) - Multirace
Year householder moved into unit - Moved in 1970 to 1979 (%) - Other Race
Year householder moved into unit - Moved in 1969 or earlier (%)
Year householder moved into unit - Moved in 1969 or earlier (%) - White
Year householder moved into unit - Moved in 1969 or earlier (%) - Black or African American
Year householder moved into unit - Moved in 1969 or earlier (%) - Asian
Year householder moved into unit - Moved in 1969 or earlier (%) - Hispanic or Latino
Year householder moved into unit - Moved in 1969 or earlier (%) - American Indian and Alaska Native
Year householder moved into unit - Moved in 1969 or earlier (%) - Multirace
Year householder moved into unit - Moved in 1969 or earlier (%) - Other Race
Housing units lacking complete plumbing facilities (%)
Housing units lacking complete kitchen facilities (%)
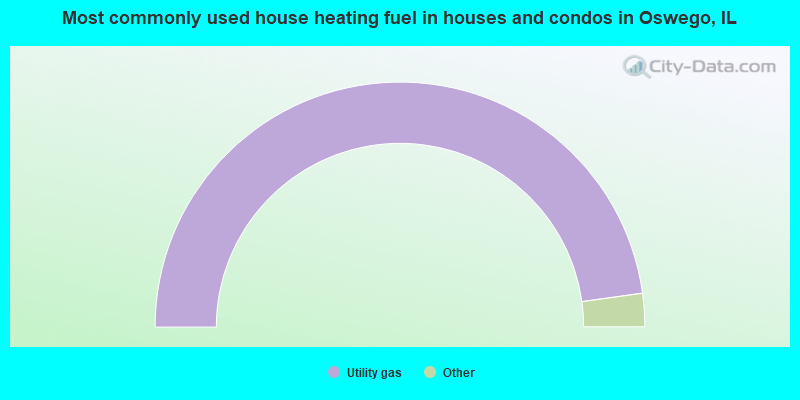
House heating fuel used in houses and condos - Utility gas (%)
House heating fuel used in houses and condos - Bottled, tank, or LP gas (%)
House heating fuel used in houses and condos - Electricity (%)
House heating fuel used in houses and condos - Fuel oil, kerosene, etc. (%)
House heating fuel used in houses and condos - Coal or coke (%)
House heating fuel used in houses and condos - Wood (%)
House heating fuel used in houses and condos - Solar energy (%)
House heating fuel used in houses and condos - Other fuel (%)
House heating fuel used in houses and condos - No fuel used (%)
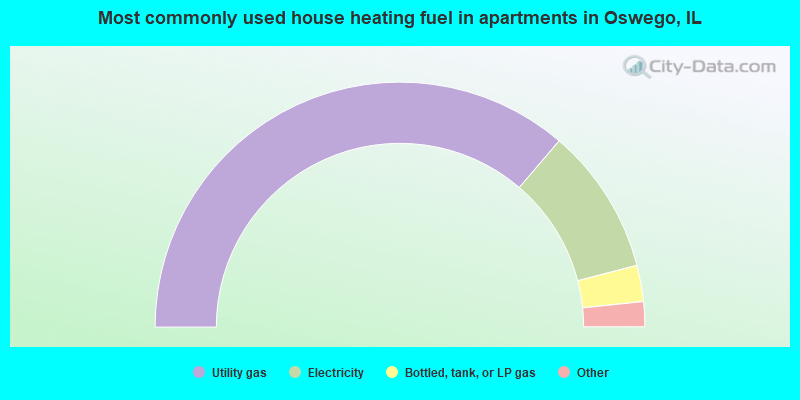
House heating fuel used in apartments - Utility gas (%)
House heating fuel used in apartments - Bottled, tank, or LP gas (%)
House heating fuel used in apartments - Electricity (%)
House heating fuel used in apartments - Fuel oil, kerosene, etc. (%)
House heating fuel used in apartments - Coal or coke (%)
House heating fuel used in apartments - Wood (%)
House heating fuel used in apartments - Solar energy (%)
House heating fuel used in apartments - Other fuel (%)
House heating fuel used in apartments - No fuel used (%)
Latest news about housing in Oswego, IL collected exclusively by city-data.com from local newspapers, TV, and radio stations
Median year house/condo built: 2001Median year apartment built: 2005Household type by relationship:
Households: 35,978
Male householders: 6,383 (671 living alone ), Female householders: 6,229 (1,328 living alone )7,653 spouses (7,603 opposite-sex spouses ), 504 unmarried partners , (504 opposite-sex unmarried partners ), 12,708 children (12,271 natural , 144 adopted , 292 stepchildren ), 402 grandchildren , 464 brothers or sisters , 896 parents , 21 foster children , 395 other relatives , 234 non-relatives In group quarters: 84
Size of family households: 3,726 2-persons , 2,634 3-persons , 1,705 4-persons , 1,119 5-persons , 368 6-persons , 10 7-or-more-persons .
Size of nonfamily households: 2,297 1-person , 614 2-persons .
6,749 married couples with children. single-parent households (262 men , 2,149 women ).
76.9% of residents of Oswego speak English at home. of residents speak Spanish at home (74% speak English very well , 13% speak English well , 11% speak English not well , 2% don't speak English at all ).of residents speak other Indo-European language at home (66% speak English very well , 23% speak English well , 10% speak English not well ).of residents speak Asian or Pacific Island language at home (39% speak English very well , 54% speak English well , 7% speak English not well ).of residents speak other language at home (70% speak English very well , 30% speak English well ).
Foreign born population: 4,712 (13.1%)of them are naturalized citizens )
Median number of rooms in houses and condos:
Median number of rooms in apartments
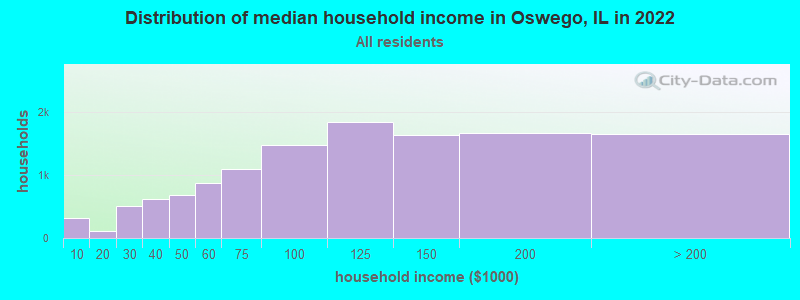
Oswego, IL household income distribution 310 Less than $10,000118 $10,000 to $19,999509 $20,000 to $29,999615 $30,000 to $39,999682 $40,000 to $49,999870 $50,000 to $59,9991,097 $60,000 to $74,9991,482 $75,000 to $99,9991,841 $100,000 to $124,9991,632 $125,000 to $149,9991,659 $150,000 to $199,9991,643 $200,000 or more
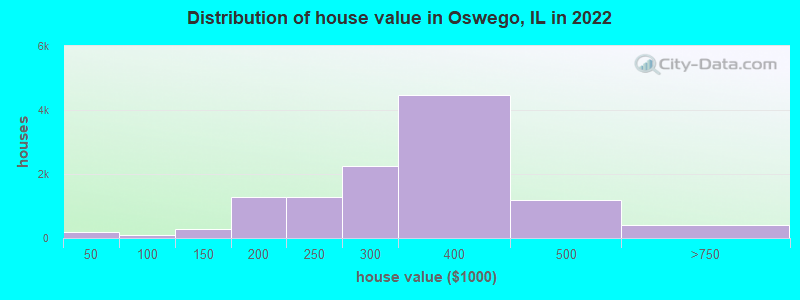
Home value of owner - occupied houses in 2022 in Oswego, IL 78 Less than $10,00015 $20,000 to $24,99939 $30,000 to $34,99915 $35,000 to $39,99951 $40,000 to $49,99914 $50,000 to $59,99934 $90,000 to $99,99939 $100,000 to $124,999252 $125,000 to $149,999524 $150,000 to $174,999760 $175,000 to $199,9991,285 $200,000 to $249,9992,252 $250,000 to $299,9994,474 $300,000 to $399,9991,176 $400,000 to $499,999363 $500,000 to $749,99921 $750,000 to $999,9997 $2,000,000 or moreRent paid by renters in 2022 in Oswego, IL 69 $300 to $34914 $400 to $44921 $450 to $49935 $550 to $59911 $650 to $69913 $700 to $74923 $750 to $79977 $800 to $89977 $900 to $99996 $1,000 to $1,24983 $1,250 to $1,499491 $1,500 to $1,999348 $2,000 to $2,4996 $2,500 to $2,99929 No cash rent
Percentage of workers working in this county: 42.5%Number of people working at home: 3,212 (18.2% of all workers )
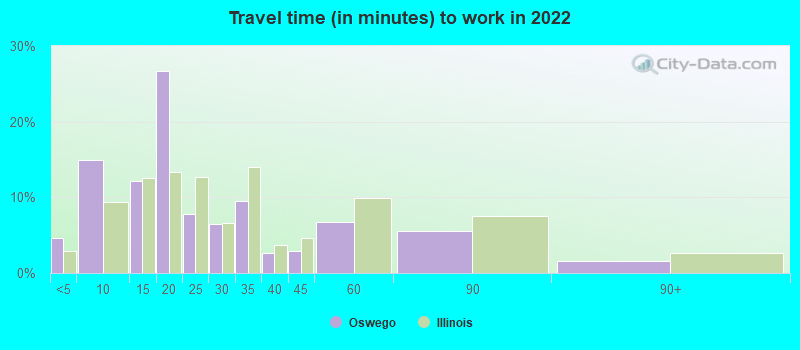
Travel time to work (commute)
Less than 5 minutes: 5305 to 9 minutes: 1,01710 to 14 minutes: 90215 to 19 minutes: 2,28320 to 24 minutes: 1,37725 to 29 minutes: 1,97030 to 34 minutes: 2,44135 to 39 minutes: 42540 to 44 minutes: 41545 to 59 minutes: 2,35960 to 89 minutes: 84590 or more minutes: 611
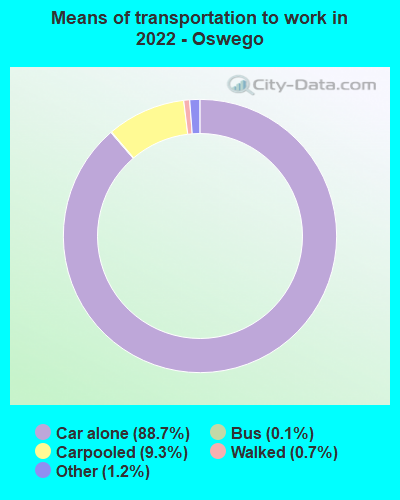
Means of transportation to work:
Drove a car alone: 8,312 (68.2%)Carpooled: 927 (7.6%)Bus : 11 (0.1%)Taxi: 120 (1.0%)Bicycle: 8 (0.1%)Walked: 63 (0.5%)Worked at home: 3,212 (26.4%)
Unemployment by race in 2022
Unemployment rate for White non-Hispanic residents 0.8% Males3.4% FemalesUnemployment rate for Black residents 1.7% Males3.8% FemalesUnemployment rate for other race residents 22.7% MalesUnemployment rate for two or more race residents 5.6% MalesUnemployment rate for Hispanic or Latino residents 7.0% Males
Year of entry for the foreign-born population in Oswego, Illinois
801 2010 or later 1,182 2000 to 2009 888 1990 to 1999 167 1980 to 1989 66 1970 to 1979 179 Before 1970
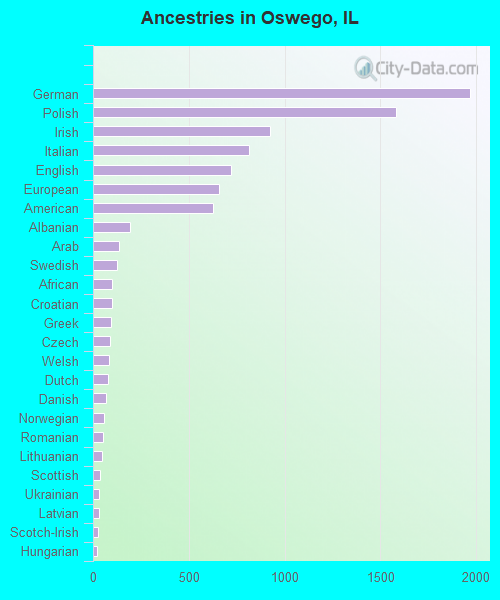
First ancestries reported:
German: 1,968 (12.3%)
Polish: 1,582 (9.9%)
Irish: 923 (5.7%)
Italian: 812 (5.1%)
English: 722 (4.5%)
European: 659 (4.1%)
American: 626 (3.9%)
Albanian: 191 (1.2%)
Arab: 136 (0.8%)
Swedish: 123 (0.8%)
African: 101 (0.6%)
Croatian: 98 (0.6%)
Greek: 96 (0.6%)
Czech: 91 (0.6%)
Welsh: 81 (0.5%)
Dutch: 77 (0.5%)
Danish: 69 (0.4%)
Norwegian: 59 (0.4%)
Romanian: 53 (0.3%)
Lithuanian: 48 (0.3%)
Scottish: 35 (0.2%)
Ukrainian: 33 (0.2%)
Latvian: 31 (0.2%)
Scotch-Irish: 25 (0.2%)
Hungarian: 22 (0.1%)
Northern European: 22 (0.1%)
Luxembourger: 18 (0.1%)
Slovak: 18 (0.1%)
British: 15 (0.09%)
Canadian: 13 (0.08%)
Finnish: 9 (0.06%)
Russian: 9 (0.06%)
Austrian: 8 (0.05%) Most common places of birth for foreign-born residents (%): Mexico Oswego:
47.4% (2,283)Illinois:
34.7% (626,958)
Albania Oswego:
9.2% (441)Illinois:
0.4% (6,488)
Poland Oswego:
8.3% (401)Illinois:
6.9% (124,474)
Philippines Oswego:
5.7% (273)Illinois:
5.2% (93,003)
Italy Oswego:
4.4% (213)Illinois:
0.9% (15,679)
Pakistan Oswego:
4.1% (199)Illinois:
1.6% (29,519)
Ecuador Oswego:
3.4% (163)Illinois:
0.9% (16,844)
Iraq Oswego:
2.8% (133)Illinois:
0.7% (13,214)
India Oswego:
2.5% (122)Illinois:
9.2% (166,409)
Ukraine Oswego:
2.2% (105)Illinois:
1.6% (29,316)
Korea Oswego:
2.1% (103)Illinois:
2.2% (40,393)
Russia Oswego:
1.6% (77)Illinois:
0.9% (16,308)
Venezuela Oswego:
1.6% (76)Illinois:
0.5% (9,688)
Place of birth for U.S.-born residents:
This state: 24,136Other state: 7,244Northeast: 768Midwest: 3,293South: 1,350West: 1,691 89.1% of Oswego residents lived in the same house 1 years ago.
Out of people who lived in different houses, 13.0% lived in this county.
Out of people who lived in different counties, 91.4% lived in Illinois.
Oswego:
89.1%State average:
88.3%
Education attainment for males 25 years and older:
No schooling: 200Nursery to 4th grade: 965th and 6th grade: 3217th and 8th grade: 409th grade: 2910th grade: 1511th grade: 9612th grade, no diploma: 7High school graduate (or equivalency): 2,097Less than 1 year of college: 575Some college more than 1 year, no degree: 2,234Associate degree: 778Bachelor's degree: 2,920Master's degree: 1,321Professional school degree: 171Doctorate degree: 147
Education attainment for females 25 years and older:
No schooling: 85Nursery to 4th grade: 1765th and 6th grade: 3587th and 8th grade: 309th grade: 7710th grade: 511th grade: 1412th grade, no diploma: 312High school graduate (or equivalency): 2,369Less than 1 year of college: 879Some college more than 1 year, no degree: 1,359Associate degree: 1,316Bachelor's degree: 2,793Master's degree: 2,174Professional school degree: 62Doctorate degree: 369
Housing units in structures:
One, detached: 8,846One, attached: 2,645Two: 293 or 4: 2975 to 9: 12410 to 19: 51120 to 49: 2450 or more: 89Housing units lacking complete kitchen facilities in 2022: 0.0%Private vs. public school enrollment:
Students in private schools in grades 1 to 8 (elementary and middle school): 485 Students in private schools in grades 9 to 12 (high school): 68 Students in private undergraduate colleges: 441