Oswego, NY (New York) Houses and Residents
Estimated median house or condo value in 2022: $114,874 (it was $69,000 in 2000 )
Oswego:
$114,874New York:
$400,400
Lower value quartile - upper value quartile: $81,188 - $161,705Mean price in 2022: Detached houses: $150,437 Here:
$150,437State:
$476,719
Townhouses or other attached units: $149,847 Here:
$149,847State:
$699,270
In 2-unit structures: $104,602 Here:
$104,602State:
$713,077
In 5-or-more-unit structures: $179,089 Here:
$179,089State:
$912,009
Mobile homes: $57,318 Here:
$57,318State:
$88,925
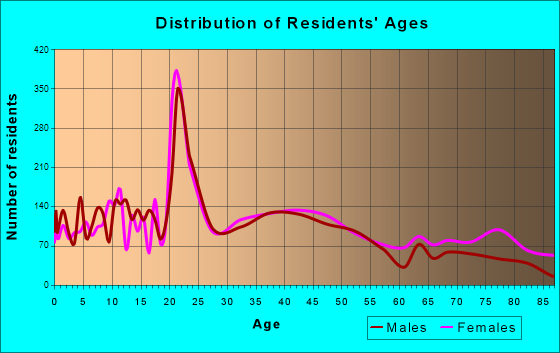
Total population: 17,988 (Urban population: 17,954 (all inside urban clusters), Rural population: 0)
Houses: 8,572 (7,400 occupied: 3,678 owner occupied, 3,820 renter occupied )
% of renters here:
51%State:
46%
Housing density: 1,119 houses/condos per square mile
Median price asked for vacant for-sale houses and condos in 2022: $91,747.
Median contract rent in 2022: $765 (lower quartile is $554, upper quartile is $1,031)
Median rent asked for vacant for-rent units in 2022: $459
Median gross rent in Oswego, NY in 2022: $948
Housing units in Oswego with a mortgage: 2,002 (264 second mortgage, 3 home equity loan, 276 both second mortgage and home equity loan )Houses without a mortgage: 83
Median household income for houses/condos with a mortgage: $93,598
Median household income for apartments without a mortgage: $57,760
Median monthly housing costs: $984
Data:
Median house or condo value ($)
Median house or condo value ($ change since 2000)
Median house or condo value ($) - White
Median house or condo value ($) - Black or African American
Median house or condo value ($) - Asian
Median house or condo value ($) - Hispanic or Latino
Median house or condo value ($) - American Indian and Alaska Native
Median house or condo value ($) - Multirace
Median house or condo value ($) - Other Race
Median price asked for mobile homes ($)
Household density (households per square mile)
Mean house or condo value by units in structure - 1, detached ($)
Mean house or condo value by units in structure - 1, attached ($)
Mean house or condo value by units in structure - 2 ($)
Mean house or condo value by units in structure by units in structure - 3 or 4 ($)
Mean house or condo value by units in structure - 5 or more ($)
Mean house or condo value by units in structure - Boat, RV, van, etc. ($)
Mean house or condo value by units in structure - Mobile home ($)
Median contract rent ($)
Median contract rent - Lower quartile ($)
Median contract rent - Upper quartile ($)
Median gross rent ($)
Urban houses (%)
Rural houses (%)
Houses occupied (%)
Houses occupied (% change since 2000)
Houses owner occupied (%)
Houses owner occupied (% change since 2000)
Houses renter occupied (%)
Houses renter occupied (% change since 2000)
Vacant housing units - For rent (%)
Vacant housing units - For rent (% change since 2000)
Vacant housing units - For sale only (%)
Vacant housing units - For sale only (% change since 2000)
Vacant housing units - Rented or sold, not occupied (%)
Vacant housing units - Rented or sold, not occupied (% change since 2000)
Vacant housing units - For seasonal, recreational, or occasional use (%)
Vacant housing units - For seasonal, recreational, or occasional use (% change since 2000)
Vacant housing units - For migrant workers (%)
Vacant housing units - For migrant workers (% change since 2000)
Vacant housing units - Other vacant (%)
Vacant housing units - Other vacant (% change since 2000)
Median monthly housing costs ($)
Median household income for houses/condos with a mortgage ($)
Median household income for houses/condos without a mortgage ($)
Median household income ($)
Median household income ($) - White
Median household income ($) - Black or African American
Median household income ($) - Asian
Median household income ($) - Hispanic or Latino
Median household income ($) - American Indian and Alaska Native
Median household income ($) - Multirace
Median household income ($) - Other Race
Mortgage status - with mortgage (%)
Mortgage status - with second mortgage (%)
Mortgage status - with home equity loan (%)
Mortgage status - with both second mortgage and home equity loan (%)
Mortgage status - without a mortgage (%)
Median year house/condo built
Median year apartment built
Household type by relationship - Male householder living alone (%)
Household type by relationship - Male householder not living alone (%)
Household type by relationship - Female householder living alone (%)
Household type by relationship - Female householder not living alone (%)
Household type by relationship - Opposite-Sex spouse (%)
Household type by relationship - Same-Sex spouse (%)
Household type by relationship - Opposite-Sex unmarried partner (%)
Household type by relationship - Same-Sex unmarried partner (%)
Household type by relationship - In group quarters (%)
Size of family households - 2-person household (%)
Size of family households - 3-person household (%)
Size of family households - 4-person household (%)
Size of family households - 5-person household (%)
Size of family households - 6-person household (%)
Size of family households - 7-or-more-person household (%)
Size of nonfamily households - 1-person household (%)
Size of nonfamily households - 2-person household (%)
Size of nonfamily households - 3-person household (%)
Size of nonfamily households - 4-person household (%)
Size of nonfamily households - 5-person household (%)
Size of nonfamily households - 6-person household (%)
Size of nonfamily households - 7-or-moreperson household (%)
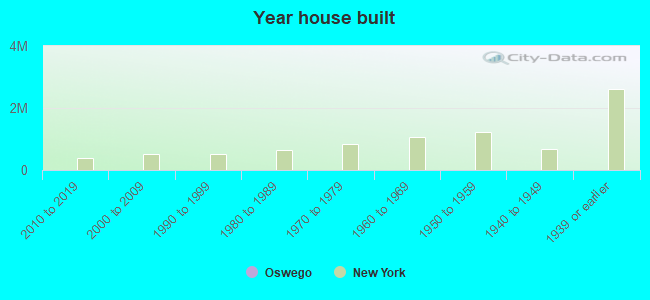
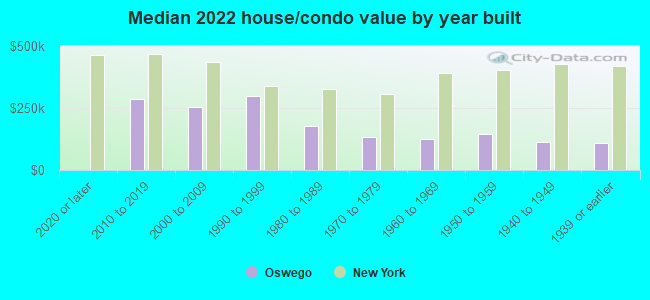
Year house built - Built 2010 or later (%)
Year house built - Built 2000 to 2009 (%)
Year house built - Built 1990 to 1999 (%)
Year house built - Built 1980 to 1989 (%)
Year house built - Built 1970 to 1979 (%)
Year house built - Built 1960 to 1969 (%)
Year house built - Built 1950 to 1959 (%)
Year house built - Built 1940 to 1949 (%)
Year house built - Built 1939 or earlier (%)
Median number of rooms in houses and condos
Median number of rooms in apartments
Median number of bedrooms in owner occupied houses
Mean number of bedrooms in owner occupied houses
Median number of bedrooms in renter occupied houses
Mean number of bedrooms in renter occupied houses
Median number of vehichles in owner occupied houses
Mean number of vehichles in owner occupied houses
Median number of vehichles in renter occupied houses
Mean number of vehichles in renter occupied houses
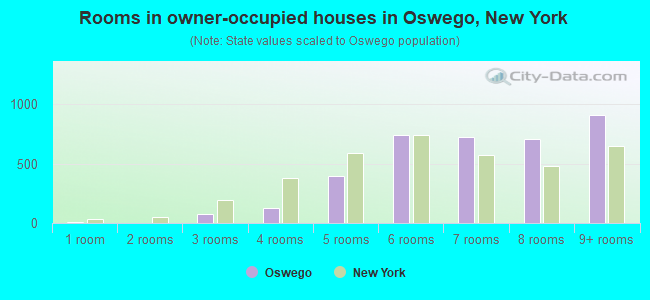
Rooms in owner-occupied houses - 1 room (%)
Rooms in owner-occupied houses - 2 rooms (%)
Rooms in owner-occupied houses - 3 rooms (%)
Rooms in owner-occupied houses - 4 rooms (%)
Rooms in owner-occupied houses - 5 rooms (%)
Rooms in owner-occupied houses - 6 rooms (%)
Rooms in owner-occupied houses - 7 rooms (%)
Rooms in owner-occupied houses - 8 rooms (%)
Rooms in owner-occupied houses - 9+ rooms (%)
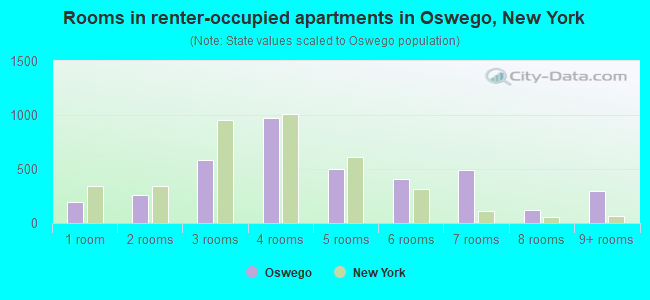
Rooms in renter-occupied houses - 1 room (%)
Rooms in renter-occupied houses - 2 rooms (%)
Rooms in renter-occupied houses - 3 rooms (%)
Rooms in renter-occupied houses - 4 rooms (%)
Rooms in renter-occupied houses - 5 rooms (%)
Rooms in renter-occupied houses - 6 rooms (%)
Rooms in renter-occupied houses - 7 rooms (%)
Rooms in renter-occupied houses - 8 rooms (%)
Rooms in renter-occupied houses - 9+ rooms (%)
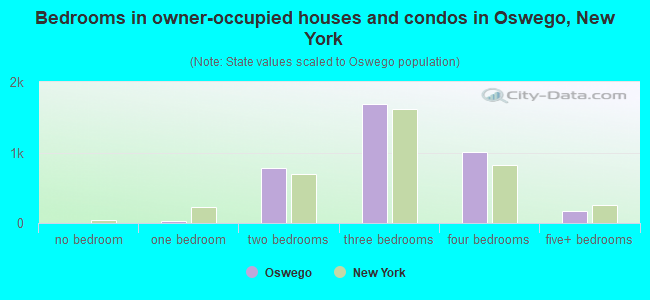
Bedrooms in owner-occupied houses - no bedrooms (%)
Bedrooms in owner-occupied houses - 1 bedroom (%)
Bedrooms in owner-occupied houses - 2 bedrooms (%)
Bedrooms in owner-occupied houses - 3 bedrooms (%)
Bedrooms in owner-occupied houses - 4 bedrooms (%)
Bedrooms in owner-occupied houses - 5+ bedrooms (%)
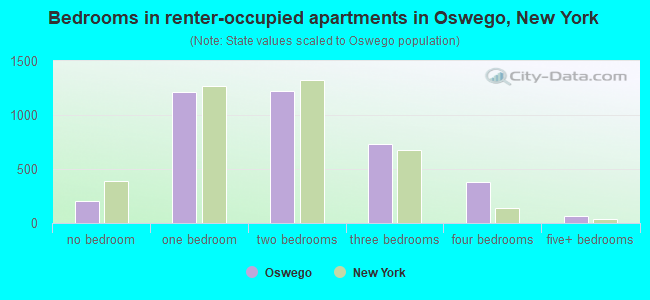
Bedrooms in renter-occupied houses - no bedrooms (%)
Bedrooms in renter-occupied houses - 1 bedroom (%)
Bedrooms in renter-occupied houses - 2 bedrooms (%)
Bedrooms in renter-occupied houses - 3 bedrooms (%)
Bedrooms in renter-occupied houses - 4 bedrooms (%)
Bedrooms in renter-occupied houses - 5+ bedrooms (%)
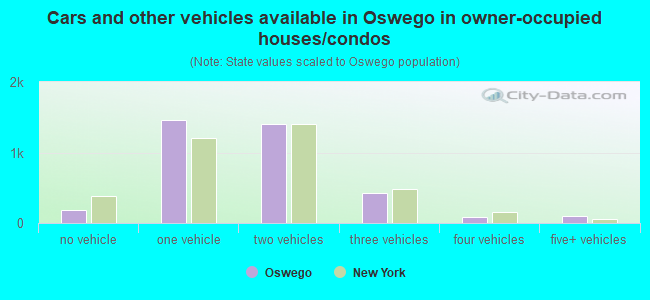
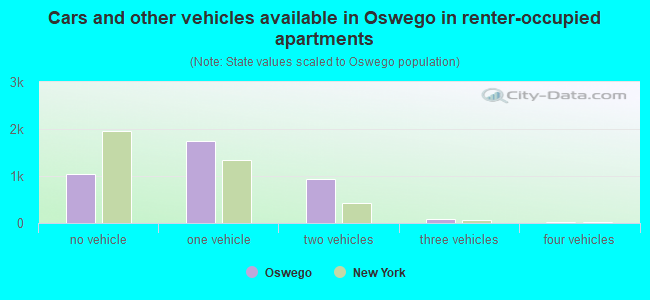
Vehicles available in owner-occupied houses - no vehicle available (%)
Vehicles available in owner-occupied houses - 1 vehicle available(%)
Vehicles available in owner-occupied houses - 2 Vehicles available (%)
Vehicles available in owner-occupied houses - 3 Vehicles available (%)
Vehicles available in owner-occupied houses - 4 Vehicles available (%)
Vehicles available in owner-occupied houses - 5+ Vehicles available (%)
Vehicles available in renter-occupied houses - no vehicle available (%)
Vehicles available in renter-occupied houses - 1 vehicle available (%)
Vehicles available in renter-occupied houses - 2 Vehicles available (%)
Vehicles available in renter-occupied houses - 3 Vehicles available (%)
Vehicles available in renter-occupied houses - 4 Vehicles available (%)
Vehicles available in renter-occupied houses - 5+ Vehicles available (%)
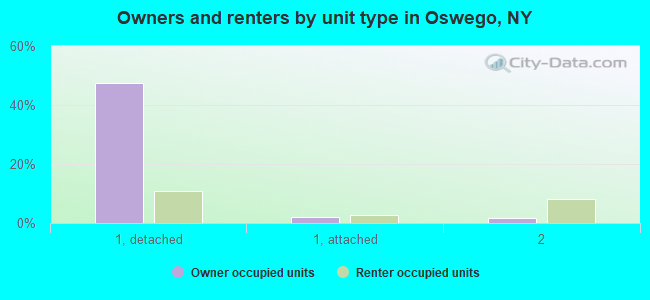
Housing units in structures - 1, detached (%)
Housing units in structures - 1, attached (%)
Housing units in structures - 2 (%)
Housing units in structures - 3 or 4 (%)
Housing units in structures - 5 to 9 (%)
Housing units in structures - 10 to 19 (%)
Housing units in structures - 20 to 49 (%)
Housing units in structures - 50 or more (%)
Housing units in structures - Mobile home (%)
Housing units in structures - Boat, RV, van, etc. (%)
Housing units in structures - Owners - 1, detached (%)
Housing units in structures - Owners - 1, attached (%)
Housing units in structures - Owners - 2 (%)
Housing units in structures - Owners - 3 or 4 (%)
Housing units in structures - Owners - 5 to 9 (%)
Housing units in structures - Owners - 10 to 19 (%)
Housing units in structures - Owners - 20 to 49 (%)
Housing units in structures - Owners - 50 or more (%)
Housing units in structures - Owners - Mobile home (%)
Housing units in structures - Owners - Boat, RV, van, etc. (%)
Housing units in structures - Renters - 1, detached (%)
Housing units in structures - Renters - 1, attached (%)
Housing units in structures - Renters - 2 (%)
Housing units in structures - Renters - 3 or 4 (%)
Housing units in structures - Renters - 5 to 9 (%)
Housing units in structures - Renters - 10 to 19 (%)
Housing units in structures - Renters - 20 to 49 (%)
Housing units in structures - Renters - 50 or more (%)
Housing units in structures - Renters - Mobile home (%)
Housing units in structures - Renters - Boat, RV, van, etc. (%)
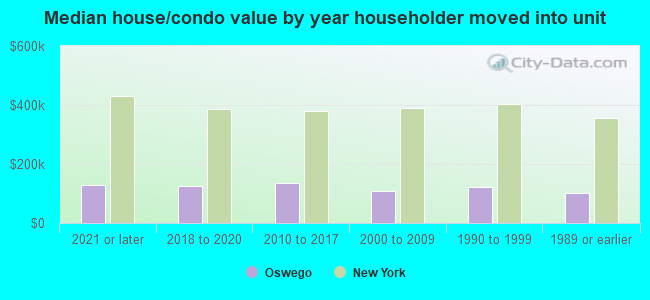
House/condo owner moved in on average (years ago)
Renter moved in on average (years ago)
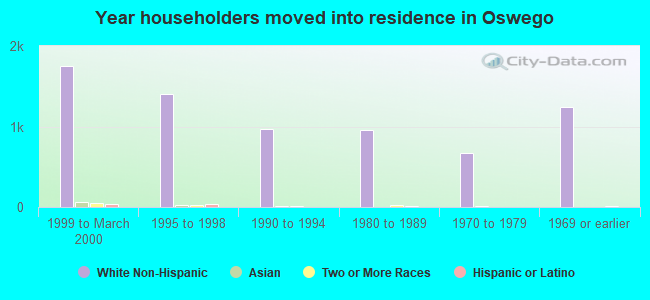
Year householder moved into unit - Moved in 1999 to March 2000 (%)
Year householder moved into unit - Moved in 1999 to March 2000 (%) - White
Year householder moved into unit - Moved in 1999 to March 2000 (%) - Black or African American
Year householder moved into unit - Moved in 1999 to March 2000 (%) - Asian
Year householder moved into unit - Moved in 1999 to March 2000 (%) - Hispanic or Latino
Year householder moved into unit - Moved in 1999 to March 2000 (%) - American Indian and Alaska Native
Year householder moved into unit - Moved in 1999 to March 2000 (%) - Multirace
Year householder moved into unit - Moved in 1999 to March 2000 (%) - Other Race
Year householder moved into unit - Moved in 1995 to 1998 (%)
Year householder moved into unit - Moved in 1995 to 1998 (%) - White
Year householder moved into unit - Moved in 1995 to 1998 (%) - Black or African American
Year householder moved into unit - Moved in 1995 to 1998 (%) - Asian
Year householder moved into unit - Moved in 1995 to 1998 (%) - Hispanic or Latino
Year householder moved into unit - Moved in 1995 to 1998 (%) - American Indian and Alaska Native
Year householder moved into unit - Moved in 1995 to 1998 (%) - Multirace
Year householder moved into unit - Moved in 1995 to 1998 (%) - Other Race
Year householder moved into unit - Moved in 1990 to 1994 (%)
Year householder moved into unit - Moved in 1990 to 1994 (%) - White
Year householder moved into unit - Moved in 1990 to 1994 (%) - Black or African American
Year householder moved into unit - Moved in 1990 to 1994 (%) - Asian
Year householder moved into unit - Moved in 1990 to 1994 (%) - Hispanic or Latino
Year householder moved into unit - Moved in 1990 to 1994 (%) - American Indian and Alaska Native
Year householder moved into unit - Moved in 1990 to 1994 (%) - Multirace
Year householder moved into unit - Moved in 1990 to 1994 (%) - Other Race
Year householder moved into unit - Moved in 1980 to 1989 (%)
Year householder moved into unit - Moved in 1980 to 1989 (%) - White
Year householder moved into unit - Moved in 1980 to 1989 (%) - Black or African American
Year householder moved into unit - Moved in 1980 to 1989 (%) - Asian
Year householder moved into unit - Moved in 1980 to 1989 (%) - Hispanic or Latino
Year householder moved into unit - Moved in 1980 to 1989 (%) - American Indian and Alaska Native
Year householder moved into unit - Moved in 1980 to 1989 (%) - Multirace
Year householder moved into unit - Moved in 1980 to 1989 (%) - Other Race
Year householder moved into unit - Moved in 1970 to 1979 (%)
Year householder moved into unit - Moved in 1970 to 1979 (%) - White
Year householder moved into unit - Moved in 1970 to 1979 (%) - Black or African American
Year householder moved into unit - Moved in 1970 to 1979 (%) - Asian
Year householder moved into unit - Moved in 1970 to 1979 (%) - Hispanic or Latino
Year householder moved into unit - Moved in 1970 to 1979 (%) - American Indian and Alaska Native
Year householder moved into unit - Moved in 1970 to 1979 (%) - Multirace
Year householder moved into unit - Moved in 1970 to 1979 (%) - Other Race
Year householder moved into unit - Moved in 1969 or earlier (%)
Year householder moved into unit - Moved in 1969 or earlier (%) - White
Year householder moved into unit - Moved in 1969 or earlier (%) - Black or African American
Year householder moved into unit - Moved in 1969 or earlier (%) - Asian
Year householder moved into unit - Moved in 1969 or earlier (%) - Hispanic or Latino
Year householder moved into unit - Moved in 1969 or earlier (%) - American Indian and Alaska Native
Year householder moved into unit - Moved in 1969 or earlier (%) - Multirace
Year householder moved into unit - Moved in 1969 or earlier (%) - Other Race
Housing units lacking complete plumbing facilities (%)
Housing units lacking complete kitchen facilities (%)
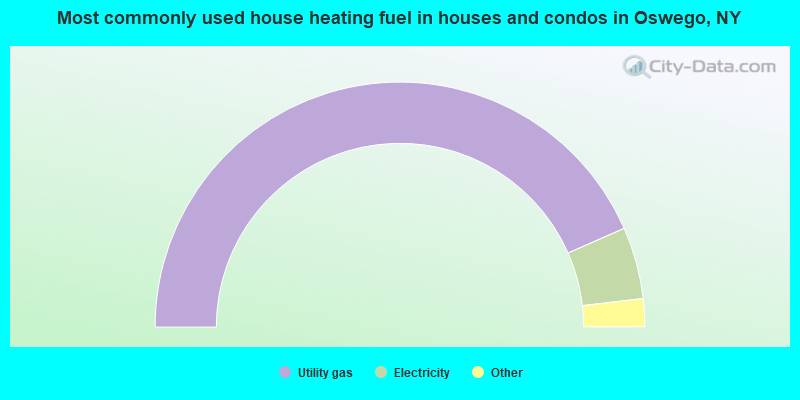
House heating fuel used in houses and condos - Utility gas (%)
House heating fuel used in houses and condos - Bottled, tank, or LP gas (%)
House heating fuel used in houses and condos - Electricity (%)
House heating fuel used in houses and condos - Fuel oil, kerosene, etc. (%)
House heating fuel used in houses and condos - Coal or coke (%)
House heating fuel used in houses and condos - Wood (%)
House heating fuel used in houses and condos - Solar energy (%)
House heating fuel used in houses and condos - Other fuel (%)
House heating fuel used in houses and condos - No fuel used (%)
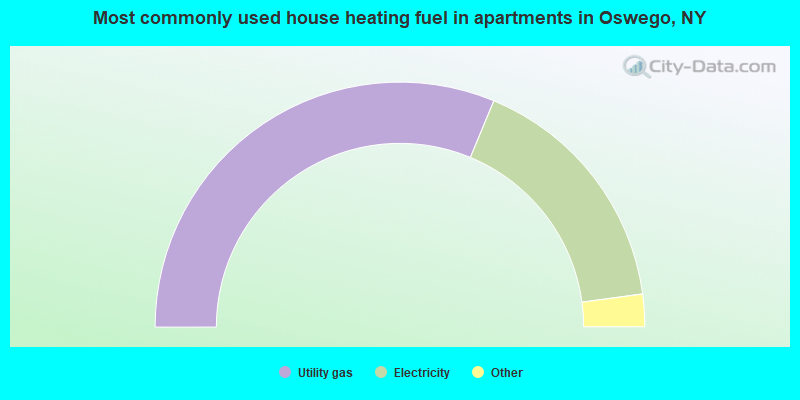
House heating fuel used in apartments - Utility gas (%)
House heating fuel used in apartments - Bottled, tank, or LP gas (%)
House heating fuel used in apartments - Electricity (%)
House heating fuel used in apartments - Fuel oil, kerosene, etc. (%)
House heating fuel used in apartments - Coal or coke (%)
House heating fuel used in apartments - Wood (%)
House heating fuel used in apartments - Solar energy (%)
House heating fuel used in apartments - Other fuel (%)
House heating fuel used in apartments - No fuel used (%)
Latest news about housing in Oswego, NY collected exclusively by city-data.com from local newspapers, TV, and radio stations
Median year house/condo built: 1938Median year apartment built: 1947Household type by relationship:
Households: 17,128
Male householders: 3,262 (1,264 living alone ), Female householders: 4,105 (1,468 living alone )2,423 spouses (2,406 opposite-sex spouses ), 700 unmarried partners , (647 opposite-sex unmarried partners ), 4,211 children (4,011 natural , 54 adopted , 146 stepchildren ), 455 grandchildren , 132 brothers or sisters , 118 parents , 0 foster children , 164 other relatives , 820 non-relatives In group quarters: 732
Size of family households: 1,620 2-persons , 845 3-persons , 603 4-persons , 468 5-persons , 119 6-persons , 89 7-or-more-persons .
Size of nonfamily households: 2,985 1-person , 590 2-persons , 132 3-persons , 149 4-persons , 21 5-persons , 8 6-persons .
1,488 married couples with children. single-parent households (244 men , 1,471 women ).
95.1% of residents of Oswego speak English at home. of residents speak Spanish at home (86% speak English very well , 14% speak English well ).of residents speak other Indo-European language at home (87% speak English very well , 13% speak English well ).of residents speak Asian or Pacific Island language at home (59% speak English very well , 22% speak English well , 19% speak English not well ).of residents speak other language at home (100% speak English very well ).
Foreign born population: 338 (2.0%)of them are naturalized citizens )
Median number of rooms in houses and condos:
Median number of rooms in apartments
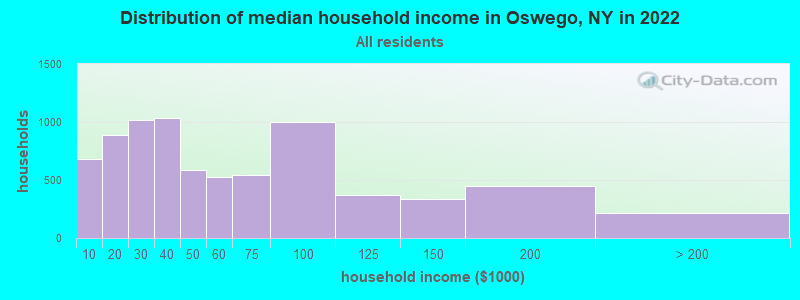
Oswego, NY household income distribution 681 Less than $10,000884 $10,000 to $19,9991,015 $20,000 to $29,9991,034 $30,000 to $39,999590 $40,000 to $49,999525 $50,000 to $59,999547 $60,000 to $74,999996 $75,000 to $99,999371 $100,000 to $124,999337 $125,000 to $149,999448 $150,000 to $199,999218 $200,000 or more
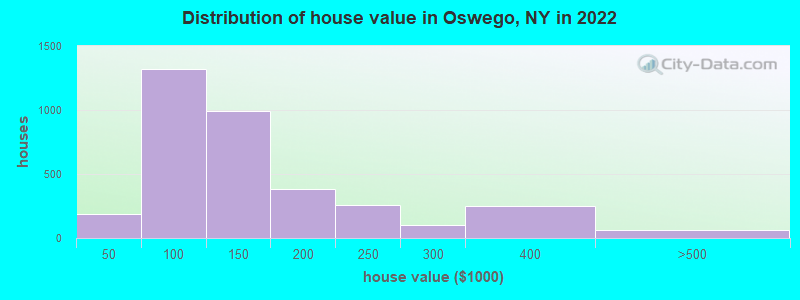
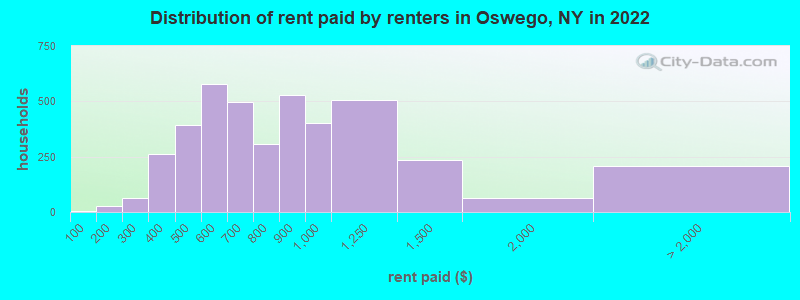
Home value of owner - occupied houses in 2022 in Oswego, NY 35 Less than $10,00012 $15,000 to $19,99916 $20,000 to $24,9994 $25,000 to $29,99967 $30,000 to $34,99910 $35,000 to $39,99940 $40,000 to $49,999279 $50,000 to $59,999182 $60,000 to $69,999209 $70,000 to $79,999242 $80,000 to $89,999362 $90,000 to $99,999664 $100,000 to $124,999325 $125,000 to $149,999245 $150,000 to $174,999134 $175,000 to $199,999254 $200,000 to $249,999105 $250,000 to $299,999251 $300,000 to $399,99943 $400,000 to $499,99919 $500,000 to $749,999Rent paid by renters in 2022 in Oswego, NY 6 Less than $10025 $150 to $19937 $200 to $24926 $250 to $299263 $350 to $399172 $400 to $449217 $450 to $499343 $500 to $549235 $550 to $599202 $600 to $649295 $650 to $699134 $700 to $749173 $750 to $799529 $800 to $899402 $900 to $999505 $1,000 to $1,249237 $1,250 to $1,49963 $1,500 to $1,99997 $2,000 to $2,49914 $3,500 or more94 No cash rent
Percentage of workers working in this county: 86.9%Number of people working at home: 544 (7.5% of all workers )
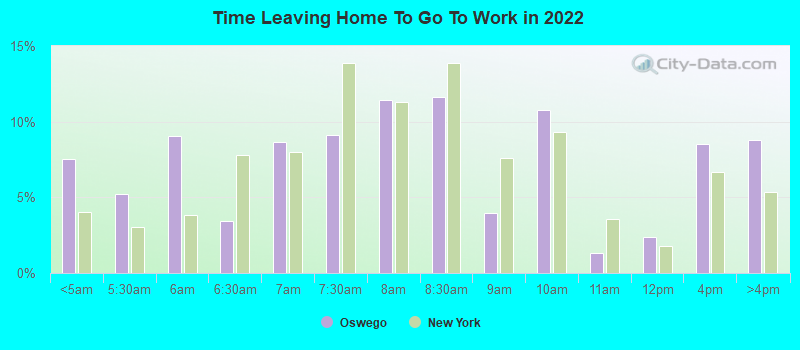
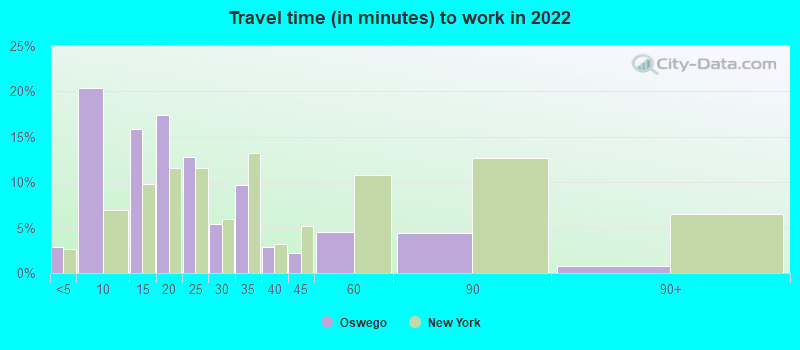
Travel time to work (commute)
Less than 5 minutes: 2795 to 9 minutes: 1,64110 to 14 minutes: 1,03115 to 19 minutes: 93520 to 24 minutes: 62525 to 29 minutes: 26230 to 34 minutes: 39435 to 39 minutes: 31840 to 44 minutes: 14745 to 59 minutes: 54060 to 89 minutes: 7490 or more minutes: 83
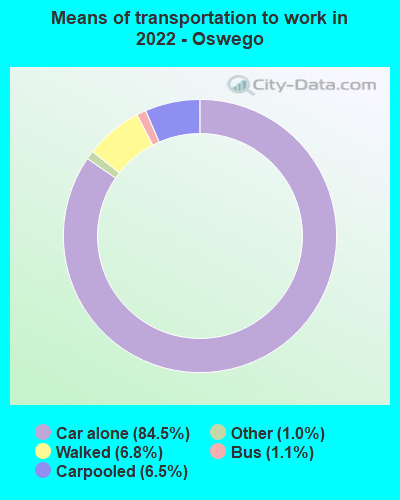
Means of transportation to work:
Drove a car alone: 7,850 (78.1%)Carpooled: 642 (6.4%)Bus : 106 (1.1%)Light rail, streetcar or trolley : 1 (0.0%)Taxi: 119 (1.2%)Walked: 639 (6.4%)Worked at home: 635 (6.3%)
Unemployment by race in 2022
Unemployment rate for White non-Hispanic residents 8.2% Males10.3% FemalesUnemployment rate for Asian residents 5.7% MalesUnemployment rate for other race residents 93.2% MalesUnemployment rate for two or more race residents 17.6% Males2.2% FemalesUnemployment rate for Hispanic or Latino residents 37.7% Males
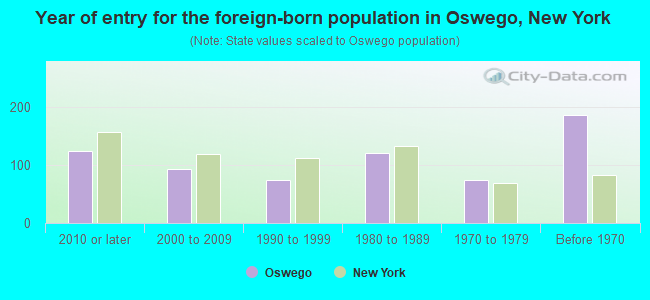
Year of entry for the foreign-born population in Oswego, New York
125 2010 or later 93 2000 to 2009 75 1990 to 1999 121 1980 to 1989 74 1970 to 1979 187 Before 1970
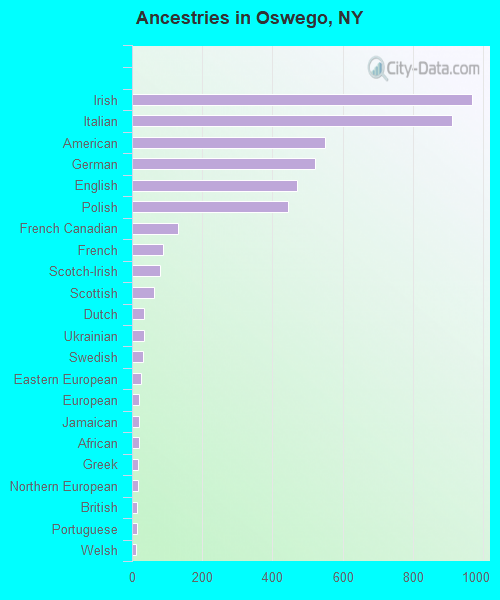
First ancestries reported:
Irish: 968 (19.2%)
Italian: 912 (18.1%)
American: 550 (10.9%)
German: 522 (10.4%)
English: 470 (9.3%)
Polish: 444 (8.8%)
French Canadian: 130 (2.6%)
French: 89 (1.8%)
Scotch-Irish: 79 (1.6%)
Scottish: 63 (1.2%)
Dutch: 33 (0.7%)
Ukrainian: 33 (0.7%)
Swedish: 31 (0.6%)
Eastern European: 27 (0.5%)
European: 21 (0.4%)
Jamaican: 21 (0.4%)
African: 19 (0.4%)
Greek: 18 (0.4%)
Northern European: 18 (0.4%)
British: 15 (0.3%)
Portuguese: 14 (0.3%)
Welsh: 10 (0.2%)
Brazilian: 8 (0.2%)
Ethiopian: 8 (0.2%)
Yugoslavian: 8 (0.2%)
Canadian: 7 (0.1%)
Lithuanian: 6 (0.1%)
Haitian: 6 (0.1%)
Russian: 4 (0.08%)
Norwegian: 3 (0.06%) Most common places of birth for foreign-born residents (%): India Oswego:
8.9% (42)New York:
3.5% (158,432)
Korea Oswego:
8.7% (41)New York:
1.8% (82,786)
Jamaica Oswego:
7.9% (37)New York:
5.0% (227,557)
Canada Oswego:
7.9% (37)New York:
1.3% (59,107)
Scotland Oswego:
7.0% (33)New York:
0.1% (5,087)
Hong Kong Oswego:
5.9% (28)New York:
0.9% (42,220)
Georgia Oswego:
5.1% (24)New York:
0.2% (11,219)
Ukraine Oswego:
4.9% (23)New York:
1.7% (78,421)
Italy Oswego:
4.9% (23)New York:
1.8% (81,374)
China, excluding Hong Kong and Taiwan Oswego:
4.9% (23)New York:
9.1% (410,910)
Uzbekistan Oswego:
4.2% (20)New York:
0.7% (32,906)
Nepal Oswego:
4.0% (19)New York:
0.4% (17,363)
Zimbabwe Oswego:
3.4% (16)New York:
0.0% (1,643)
Spain Oswego:
2.8% (13)New York:
0.3% (14,949)
Sri Lanka Oswego:
2.8% (13)New York:
0.2% (7,915)
Philippines Oswego:
1.9% (9)New York:
2.0% (91,070)
Brazil Oswego:
1.9% (9)New York:
0.7% (30,658)
Place of birth for U.S.-born residents:
This state: 14,355Other state: 2,288Northeast: 755Midwest: 263South: 909West: 290 83.5% of Oswego residents lived in the same house 1 years ago.
Out of people who lived in different houses, 38.6% lived in this county.
Out of people who lived in different counties, 70.8% lived in New York.
Oswego:
83.5%State average:
89.6%
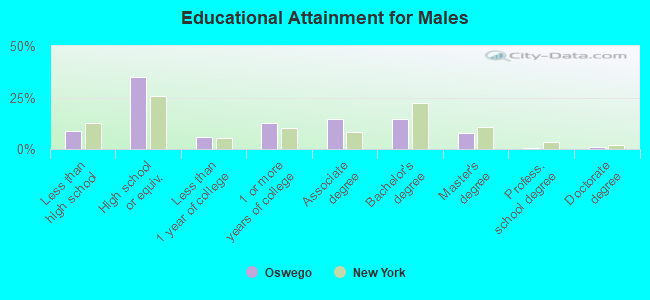
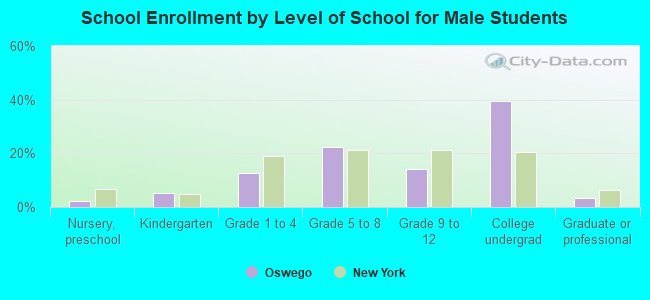
Education attainment for males 25 years and older:
No schooling: 147Nursery to 4th grade: 15th and 6th grade: 107th and 8th grade: 599th grade: 7810th grade: 3811th grade: 3112th grade, no diploma: 83High school graduate (or equivalency): 1,840Less than 1 year of college: 294Some college more than 1 year, no degree: 655Associate degree: 772Bachelor's degree: 763Master's degree: 396Professional school degree: 28Doctorate degree: 59
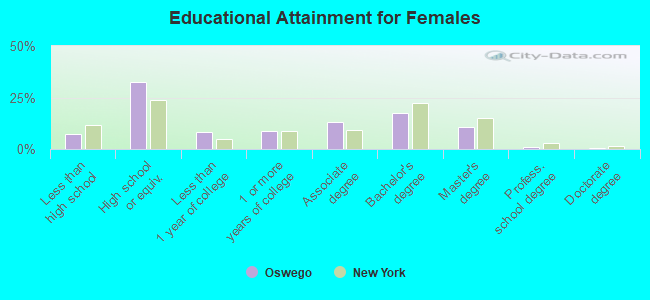
Education attainment for females 25 years and older:
No schooling: 54Nursery to 4th grade: 05th and 6th grade: 07th and 8th grade: 459th grade: 3010th grade: 13511th grade: 1612th grade, no diploma: 129High school graduate (or equivalency): 1,811Less than 1 year of college: 468Some college more than 1 year, no degree: 488Associate degree: 726Bachelor's degree: 974Master's degree: 580Professional school degree: 48Doctorate degree: 36
Housing units in structures:
One, detached: 5,298One, attached: 345Two: 7833 or 4: 7095 to 9: 60510 to 19: 5720 to 49: 16850 or more: 515Mobile homes: 83Boats, RVs, vans, etc.: 5Housing units lacking complete plumbing facilities in 2022: 1.1%Housing units lacking complete kitchen facilities in 2022: 4.5%House/condo owner moved in on average 15 years ago
Renter moved in on average 1 years ago
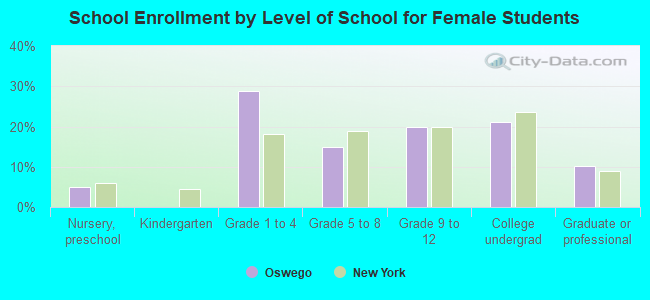
Private vs. public school enrollment:
Students in private schools in grades 1 to 8 (elementary and middle school): 369 Students in private schools in grades 9 to 12 (high school): 16 Students in private undergraduate colleges: 102