Owensville, IN (Indiana) Houses and Residents
| Owensville: | $127,880 |
| Indiana: | $208,700 |
Mean price in 2022:
Detached houses: $151,140
Here: $151,140 State: $257,916 Mobile homes: $44,764
Here: $44,764 State: $67,116
Total population: 1,287 (Urban population: 0, Rural population: 1,318 (all nonfarm))
Houses: 597 (514 occupied: 378 owner occupied, 142 renter occupied)
| % of renters here: | 27% |
| State: | 29% |
Housing density: 1,204 houses/condos per square mile
Median price asked for vacant for-sale houses and condos in 2022 in this county: $86,212.
Median contract rent in 2022: $432
Median rent asked for vacant for-rent units in 2022: $1,170
Median gross rent in Owensville, IN in 2022: $448
Housing units in Owensville with a mortgage: 211 (7 second mortgage, 0 home equity loan, 7 both second mortgage and home equity loan)
Houses without a mortgage: 0
Median household income for houses/condos with a mortgage: $73,636
Median household income for apartments without a mortgage: $35,496
Median monthly housing costs: $745
Compare current foreclosures near Owensville, IN:
| Photo | Address | Area | Beds / Baths | Price | Details |
|---|---|---|---|---|---|

|
#1
N Main St
Owensville, IN 47665
|
1,120 sq. feet
|
1 baths 2 beds |
show details | |

|
#2
W 450 S
Owensville, IN 47665
|
1,861 sq. feet
|
1 baths - beds |
show details | |

|
#3
S Highway 65
Owensville, IN 47665
|
- sq. feet
|
- baths - beds |
show details | |

|
#4
E Brummitt St
Owensville, IN 47665
|
- sq. feet
|
- baths - beds |
show details | |

|
#5
N Main St
Owensville, IN 47665
|
- sq. feet
|
- baths - beds |
show details | |

|
#6
W 550 S
Owensville, IN 47665
|
- sq. feet
|
- baths - beds |
show details | |

|
#7
S 1225 W
Owensville, IN 47665
|
- sq. feet
|
- baths - beds |
show details | |

|
#8
W Stalheim Ave
Owensville, IN 47665
|
- sq. feet
|
- baths - beds |
show details | |

|
#9
N 1st St
Owensville, IN 47665
|
- sq. feet
|
- baths - beds |
show details | |

|
#10
S State Road 165
Owensville, IN 47665
|
- sq. feet
|
- baths - beds |
show details |
| Photo | Address | Area | Beds / Baths | Price | Details |
|---|---|---|---|---|---|

|
#11
E Montgomery St
Owensville, IN 47665
|
- sq. feet
|
- baths - beds |
show details | |

|
#12
Wade Rd
Wadesville, IN 47638
|
2,160 sq. feet
|
2 baths 4 beds |
$339,900
|
show details |

|
#13
E Boonville New Harmony Rd
Evansville, IN 47725
|
3,392 sq. feet
|
3 baths 4 beds |
$385,000
|
show details |

|
#14
S 950 W
Owensville, IN 47665
|
- sq. feet
|
- baths - beds |
show details | |

|
#15
Blyth Dr
Evansville, IN 47725
|
- sq. feet
|
2 baths 4 beds |
show details | |

|
#16
Darmstadt Rd
Evansville, IN 47710
|
2,513 sq. feet
|
2 baths 5 beds |
show details | |

|
#17
N Main St
Grayville, IL 62844
|
- sq. feet
|
- baths - beds |
$17,900
|
show details |

|
#18
E Poplar St
Fort Branch, IN 47648
|
2,628 sq. feet
|
2 baths 4 beds |
show details | |

|
#19
Indiana St
Elberfeld, IN 47613
|
- sq. feet
|
1 baths 2 beds |
show details | |

|
#20
Young Rd
Evansville, IN 47725
|
960 sq. feet
|
2 baths 3 beds |
show details |
| Photo | Address | Area | Beds / Baths | Price | Details |
|---|---|---|---|---|---|

|
#21
Southlane Dr
Elberfeld, IN 47613
|
1,800 sq. feet
|
1 baths 3 beds |
show details | |

|
#22
Mary Lee Dr
Princeton, IN 47670
|
1,836 sq. feet
|
2 baths 4 beds |
show details | |

|
#23
E Water St
Princeton, IN 47670
|
1,080 sq. feet
|
1 baths 3 beds |
show details | |

|
#24
W 350 N
Patoka, IN 47666
|
2,519 sq. feet
|
3 baths 4 beds |
show details | |

|
#25
Kremer Rd
Evansville, IN 47720
|
2,054 sq. feet
|
2 baths 3 beds |
show details | |

|
#26
Gish Dr
Evansville, IN 47711
|
1,892 sq. feet
|
2 baths 3 beds |
show details | |

|
#27
Mesker Park Dr
Evansville, IN 47720
|
1,898 sq. feet
|
1 baths 2 beds |
show details | |

|
#28
Crater Dr
Evansville, IN 47725
|
1,695 sq. feet
|
2 baths 3 beds |
show details | |

|
#29
W Grave St
Patoka, IN 47666
|
952 sq. feet
|
1 baths 2 beds |
show details | |

|
#30
Petersburg Rd
Evansville, IN 47725
|
1,189 sq. feet
|
1 baths 3 beds |
show details |
| Photo | Address | Area | Beds / Baths | Price | Details |
|---|---|---|---|---|---|

|
#31
Haverhill Dr
Evansville, IN 47725
|
2,980 sq. feet
|
2 baths 4 beds |
show details | |

|
#32
Rolling Meadows Dr
Evansville, IN 47725
|
1,684 sq. feet
|
2 baths 3 beds |
show details | |

|
#33
Brookcrest Dr
Evansville, IN 47711
|
2,284 sq. feet
|
2 baths 3 beds |
show details | |

|
#34
E Baseline Rd
Evansville, IN 47725
|
1,241 sq. feet
|
1 baths 2 beds |
show details | |

|
#35
E 115 S
Francisco, IN 47649
|
1,363 sq. feet
|
2 baths 3 beds |
show details | |

|
#36
E Water St
Princeton, IN 47670
|
1,386 sq. feet
|
1 baths 3 beds |
show details | |

|
#37
Hoing Rd
Evansville, IN 47725
|
1,280 sq. feet
|
1 baths 3 beds |
show details | |

|
#38
Damm Rd
Wadesville, IN 47638
|
3,073 sq. feet
|
3 baths 3 beds |
show details | |

|
#39
Highway 66
New Harmony, IN 47631
|
952 sq. feet
|
1 baths 1 beds |
show details | |

|
#40
S State Road 57
Elberfeld, IN 47613
|
3,344 sq. feet
|
1 baths 3 beds |
show details |
| Photo | Address | Area | Beds / Baths | Price | Details |
|---|---|---|---|---|---|

|
#41
Radio Ave
Evansville, IN 47725
|
960 sq. feet
|
1 baths 3 beds |
show details | |

|
#42
E Pine St
Princeton, IN 47670
|
1,426 sq. feet
|
2 baths 2 beds |
show details | |

|
#43
Radio Ave
Evansville, IN 47725
|
1,235 sq. feet
|
1 baths 2 beds |
show details | |

|
#44
W Oak St
Princeton, IN 47670
|
2,160 sq. feet
|
1 baths 4 beds |
show details | |

|
#45
E 200 S
Princeton, IN 47670
|
1,161 sq. feet
|
1 baths 3 beds |
show details | |

|
#46
S Mccreary St
Fort Branch, IN 47648
|
1,020 sq. feet
|
1 baths 3 beds |
show details | |

|
#47
N Main St
Fort Branch, IN 47648
|
1,372 sq. feet
|
1 baths 2 beds |
show details | |

|
#48
S Walters St
Fort Branch, IN 47648
|
1,305 sq. feet
|
1 baths 2 beds |
show details | |

|
#49
Darmstadt Rd
Evansville, IN 47710
|
2,526 sq. feet
|
2 baths 3 beds |
show details | |

|
Check over 1 million property listings on Foreclosure.com!
|
browse all offers | |||

Latest news about housing in Owensville, IN collected exclusively by city-data.com from local newspapers, TV, and radio stations

 | California to Sullivan County, IN - Info please? (15 replies) |
| Moving to Evansville soon & have some questions (13 replies) |

Median year apartment built: 1988
Household type by relationship:
Households: 1,143- Male householders: 261 (92 living alone), Female householders: 248 (98 living alone)
208 spouses (208 opposite-sex spouses), 22 unmarried partners, (22 opposite-sex unmarried partners), 291 children (264 natural, 11 adopted, 15 stepchildren), 5 grandchildren, 0 brothers or sisters, 7 parents, 0 foster children, 24 other relatives, 5 non-relatives
- In group quarters: 69
Size of family households: 139 2-persons, 106 3-persons, 52 4-persons, 11 5-persons, 4 6-persons.
Size of nonfamily households: 196 1-person, 11 2-persons.
155 married couples with children.
51 single-parent households (14 men, 37 women).
98.5% of residents of Owensville speak English at home.
1.0% of residents speak Spanish at home (82% speak English very well, 18% speak English well).
Foreign born population: 13 (1.1%)
(30.8% of them are naturalized citizens)
| Here: | 6.1 |
| State: | 6.6 |
| Here: | 3.9 |
| State: | 4.3 |

- Bedrooms in owner-occupied houses and condos in Owensville, Indiana
- 0no bedroom
- 281 bedroom
- 1402 bedrooms
- 1633 bedrooms
- 474 bedrooms
- 05+ bedrooms

- Bedrooms in renter-occupied apartments in Owensville, Indiana
- 0no bedroom
- 531 bedroom
- 532 bedrooms
- 323 bedrooms
- 04 bedrooms
- 45+ bedrooms

- Cars and other vehicles available in Owensville in owner-occupied houses/condos
- 6no vehicle
- 1171 vehicle
- 1352 vehicles
- 853 vehicles
- 294 vehicles
- 65+ vehicles

- Cars and other vehicles available in Owensville in renter-occupied apartments
- 20no vehicle
- 881 vehicle
- 322 vehicles
- 03 vehicles
- 04 vehicles
- 35+ vehicles

- Rooms in owner-occupied houses in Owensville, Indiana
- 01 room
- 62 rooms
- 263 rooms
- 204 rooms
- 715 rooms
- 1086 rooms
- 757 rooms
- 378 rooms
- 369+ rooms

- Rooms in renter-occupied apartments in Owensville, Indiana
- 01 room
- 32 rooms
- 423 rooms
- 484 rooms
- 255 rooms
- 136 rooms
- 77 rooms
- 08 rooms
- 49+ rooms


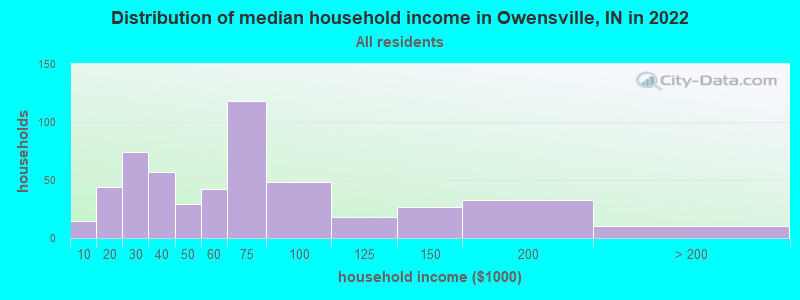
Owensville, IN household income distribution

- 15Less than $10,000
- 44$10,000 to $19,999
- 74$20,000 to $29,999
- 57$30,000 to $39,999
- 29$40,000 to $49,999
- 42$50,000 to $59,999
- 118$60,000 to $74,999
- 48$75,000 to $99,999
- 18$100,000 to $124,999
- 27$125,000 to $149,999
- 33$150,000 to $199,999
- 10$200,000 or more
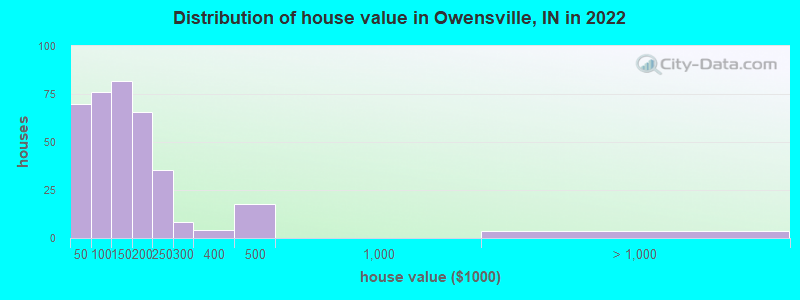
Home value of owner - occupied houses in 2022 in Owensville, IN
-
- 32Less than $10,000
- 6$10,000 to $14,999
- 7$15,000 to $19,999
- 12$35,000 to $39,999
- 10$40,000 to $49,999
- 8$50,000 to $59,999
- 8$60,000 to $69,999
- 16$70,000 to $79,999
- 22$80,000 to $89,999
- 9$90,000 to $99,999
- 65$100,000 to $124,999
- 16$125,000 to $149,999
- 51$150,000 to $174,999
- 13$175,000 to $199,999
- 35$200,000 to $249,999
- 8$250,000 to $299,999
- 4$300,000 to $399,999
- 17$400,000 to $499,999
- 3$1,000,000 to $1,499,999
Rent paid by renters in 2022 in Owensville, IN
-
- 2Less than $100
- 10$100 to $149
- 15$150 to $199
- 3$200 to $249
- 16$250 to $299
- 3$300 to $349
- 16$400 to $449
- 9$450 to $499
- 10$500 to $549
- 3$600 to $649
- 3$650 to $699
- 12$700 to $749
- 14$3,500 or more
- 7No cash rent


Percentage of workers working in this county: 72.6%
Number of people working at home: 28 (5.2% of all workers)
Travel time to work (commute)
- Less than 5 minutes: 20
- 5 to 9 minutes: 52
- 10 to 14 minutes: 75
- 15 to 19 minutes: 107
- 20 to 24 minutes: 57
- 25 to 29 minutes: 61
- 30 to 34 minutes: 37
- 35 to 39 minutes: 3
- 40 to 44 minutes: 5
- 45 to 59 minutes: 78
- 60 to 89 minutes: 8
- 90 or more minutes: 0
Means of transportation to work:
- Drove a car alone: 429 (82.0%)
- Carpooled: 65 (12.4%)
- Bicycle: 1 (0.2%)
- Walked: 8 (1.5%)
- Other means: 13 (2.5%)
- Worked at home: 7 (1.3%)

- Unemployment by race in 2022
- Unemployment rate for White non-Hispanic residents
- 1.3%Males
- 7.0%Females

- Year of entry for the foreign-born population in Owensville, Indiana
- 02010 or later
- 122000 to 2009
- 01990 to 1999
- 71980 to 1989
- 01970 to 1979
- 0Before 1970

First ancestries reported:
- German: 120 (27.1%)
- English: 54 (12.2%)
- American: 44 (9.9%)
- Welsh: 44 (9.9%)
- European: 36 (8.1%)
- Irish: 33 (7.5%)
- Dutch: 23 (5.2%)
- Polish: 22 (5.0%)
- Lithuanian: 6 (1.4%)
- Brazilian: 4 (0.9%)
- Italian: 4 (0.9%)
- Swiss: 3 (0.7%)
- Norwegian: 2 (0.5%)
Most common places of birth for foreign-born residents (%):
| Owensville: | 46.2% (6) |
| Indiana: | 0.7% (2,504) |
| Owensville: | 38.5% (5) |
| Indiana: | 0.7% (2,626) |
Place of birth for U.S.-born residents:
- This state: 922
- Other state: 200
- Northeast: 0
- Midwest: 133
- South: 55
- West: 10
94.7% of Owensville residents lived in the same house 1 years ago.
Out of people who lived in different houses, 39.3% lived in this county.
Out of people who lived in different counties, 15.0% lived in Indiana.
| Owensville: | 94.7% |
| State average: | 87.1% |
Education attainment for males 25 years and older:
- No schooling: 0
- Nursery to 4th grade: 0
- 5th and 6th grade: 0
- 7th and 8th grade: 7
- 9th grade: 9
- 10th grade: 2
- 11th grade: 5
- 12th grade, no diploma: 0
- High school graduate (or equivalency): 199
- Less than 1 year of college: 46
- Some college more than 1 year, no degree: 43
- Associate degree: 7
- Bachelor's degree: 54
- Master's degree: 0
- Professional school degree: 0
- Doctorate degree: 0

Education attainment for females 25 years and older:
- No schooling: 8
- Nursery to 4th grade: 0
- 5th and 6th grade: 0
- 7th and 8th grade: 36
- 9th grade: 0
- 10th grade: 3
- 11th grade: 12
- 12th grade, no diploma: 0
- High school graduate (or equivalency): 181
- Less than 1 year of college: 19
- Some college more than 1 year, no degree: 41
- Associate degree: 77
- Bachelor's degree: 48
- Master's degree: 18
- Professional school degree: 0
- Doctorate degree: 0


Housing units in structures:
- One, detached: 378
- Two: 14
- 3 or 4: 3
- 5 to 9: 4
- 10 to 19: 11
- 20 to 49: 38
- Mobile homes: 141
- Boats, RVs, vans, etc.: 6
Housing units lacking complete kitchen facilities in 2022: 1.7%
House/condo owner moved in on average 9 years ago
Renter moved in on average 6 years ago

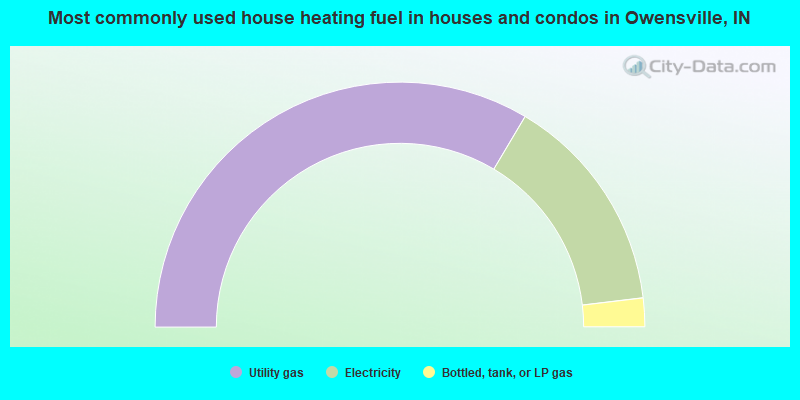
- 67.1%Utility gas
- 29.1%Electricity
- 3.8%Bottled, tank, or LP gas
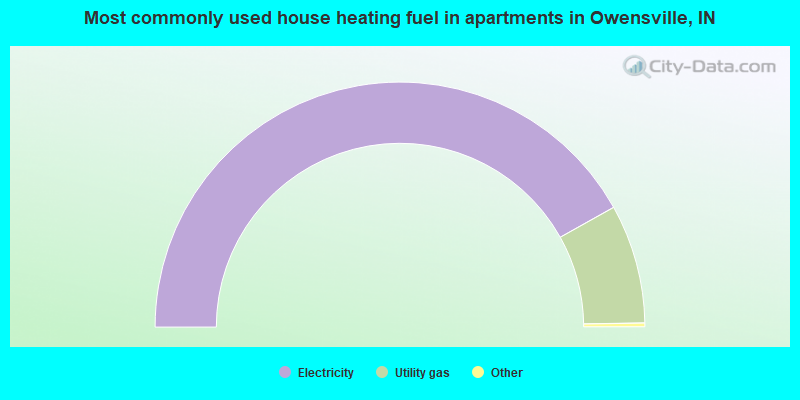
- 84.2%Electricity
- 15.8%Utility gas
Private vs. public school enrollment:
| Here: | 0.0% |
| Indiana: | 14.9% |
| Here: | 0.0% |
| Indiana: | 11.4% |
| Here: | 0.0% |
| Indiana: | 22.3% |


