Paducah, KY (Kentucky) Houses and Residents
| Paducah: | $170,313 |
| Kentucky: | $196,300 |
Mean price in 2022:
Detached houses: $242,832
Here: $242,832 State: $256,452 Townhouses or other attached units: $286,888
Here: $286,888 State: $264,090 In 2-unit structures: $322,532
Here: $322,532 State: $211,203 In 3-to-4-unit structures: $646,352
Here: $646,352 State: $169,074 In 5-or-more-unit structures: $364,721
Here: $364,721 State: $245,174 Mobile homes: $29,814
Here: $29,814 State: $84,635
Total population: 24,978 (All urban)
Houses: 13,904 (11,487 occupied: 6,140 owner occupied, 5,289 renter occupied)
| % of renters here: | 46% |
| State: | 31% |
Housing density: 714 houses/condos per square mile
Median price asked for vacant for-sale houses and condos in 2022: $108,833.
Median contract rent in 2022: $639 (lower quartile is $361, upper quartile is $745)
Median rent asked for vacant for-rent units in 2022: $1,183
Median gross rent in Paducah, KY in 2022: $719
Housing units in Paducah with a mortgage: 4,266 (142 second mortgage, 0 home equity loan, 144 both second mortgage and home equity loan)
Houses without a mortgage: 53
Median household income for houses/condos with a mortgage: $91,184
Median household income for apartments without a mortgage: $52,079
Median monthly housing costs: $824
Compare current foreclosures in Paducah, KY:
| Photo | Address | Area | Beds / Baths | Price | Details |
|---|---|---|---|---|---|

|
#1
Greenfield Dr
Paducah, KY 42003
|
2,488 sq. feet
|
2 baths 3 beds |
show details | |

|
#2
Forest Cir
Paducah, KY 42001
|
1,618 sq. feet
|
2 baths 3 beds |
show details | |

|
#3
Carson Way
Paducah, KY 42003
|
2,610 sq. feet
|
4 baths 5 beds |
show details | |

|
#4
Clay St
Paducah, KY 42001
|
1,319 sq. feet
|
1 baths 3 beds |
show details | |

|
#5
Westchester Ln
Paducah, KY 42003
|
1,810 sq. feet
|
2 baths 3 beds |
show details | |

|
#6
Six Oaks Dr
Paducah, KY 42003
|
2,240 sq. feet
|
2 baths 3 beds |
show details | |

|
#7
Geraldine Dr
Paducah, KY 42003
|
1,775 sq. feet
|
2 baths 3 beds |
show details | |

|
#8
Culp Rd
Paducah, KY 42003
|
1,778 sq. feet
|
1 baths 3 beds |
show details | |

|
#9
Cold Springs Rd
Paducah, KY 42003
|
2,318 sq. feet
|
2 baths 3 beds |
show details | |

|
#10
N 24th St
Paducah, KY 42001
|
1,987 sq. feet
|
1 baths 3 beds |
show details |
| Photo | Address | Area | Beds / Baths | Price | Details |
|---|---|---|---|---|---|

|
#11
Robinwood Dr
Paducah, KY 42001
|
3,916 sq. feet
|
4 baths 4 beds |
show details | |

|
#12
Greyhound Cir
Paducah, KY 42003
|
1,591 sq. feet
|
2 baths 3 beds |
show details | |

|
#13
Gholson Rd
Paducah, KY 42001
|
968 sq. feet
|
1 baths 2 beds |
show details | |

|
#14
N 23rd St
Paducah, KY 42001
|
1,120 sq. feet
|
1 baths 3 beds |
show details | |

|
#15
Rebecca Ln
Paducah, KY 42001
|
1,491 sq. feet
|
2 baths 3 beds |
show details | |

|
#16
Tuck Rd
Paducah, KY 42001
|
1,526 sq. feet
|
2 baths 3 beds |
show details | |

|
#17
Spring Valley Road
Paducah, KY 42003
|
1,962 sq. feet
|
2 baths 3 beds |
show details | |

|
#18
Myrna Dr
Paducah, KY 42003
|
1,342 sq. feet
|
2 baths 3 beds |
show details | |

|
#19
Harrison St
Paducah, KY 42001
|
1,800 sq. feet
|
1 baths 3 beds |
show details | |

|
#20
Wilton Cir
Paducah, KY 42003
|
1,482 sq. feet
|
2 baths 3 beds |
show details |
| Photo | Address | Area | Beds / Baths | Price | Details |
|---|---|---|---|---|---|

|
#21
Kentucky Dam Rd
Paducah, KY 42003
|
2,088 sq. feet
|
1 baths 3 beds |
show details | |

|
#22
Harris Rd
Paducah, KY 42001
|
1,983 sq. feet
|
4 baths 6 beds |
show details | |

|
#23
Watson Rd
Paducah, KY 42003
|
1,737 sq. feet
|
2 baths 3 beds |
show details | |

|
#24
Longview Dr
Paducah, KY 42001
|
1,545 sq. feet
|
1 baths 3 beds |
show details | |

|
#25
Greenfield Dr
Paducah, KY 42003
|
2,488 sq. feet
|
2 baths 3 beds |
show details | |

|
#26
Illinois St
Paducah, KY 42003
|
- sq. feet
|
2 baths 4 beds |
show details | |

|
#27
Oaks Rd # B
Paducah, KY 42003
|
- sq. feet
|
2 baths 4 beds |
show details | |

|
#28
Shawnee Ln
Paducah, KY 42001
|
1,579 sq. feet
|
1 baths - beds |
show details | |

|
#29
Calvert Dr
Paducah, KY 42003
|
- sq. feet
|
2 baths 3 beds |
show details | |

|
#30
Calvert Dr
Paducah, KY 42003
|
1,198 sq. feet
|
1 baths - beds |
show details |
| Photo | Address | Area | Beds / Baths | Price | Details |
|---|---|---|---|---|---|

|
#31
Jefferson St
Paducah, KY 42001
|
1,664 sq. feet
|
4 baths - beds |
show details | |

|
#32
Bryants Ford Rd
Paducah, KY 42003
|
860 sq. feet
|
1 baths - beds |
show details | |

|
#33
Homewood Ave
Paducah, KY 42003
|
1,231 sq. feet
|
1 baths - beds |
show details | |

|
#34
Century Ln
Paducah, KY 42003
|
1,272 sq. feet
|
- baths 3 beds |
show details | |

|
#35
Park Ave
Paducah, KY 42001
|
1,822 sq. feet
|
1 baths - beds |
show details | |

|
#36
Oscar Cross Ave
Paducah, KY 42003
|
1,208 sq. feet
|
1 baths - beds |
show details | |

|
#37
S 8th St
Paducah, KY 42003
|
950 sq. feet
|
1 baths - beds |
show details | |

|
#38
Mayfield Metropolis Rd
Paducah, KY 42001
|
- sq. feet
|
- baths - beds |
show details | |

|
#39
Avondale Rd
Paducah, KY 42003
|
- sq. feet
|
- baths - beds |
show details | |

|
#40
Boyd St Apt 5
Paducah, KY 42001
|
- sq. feet
|
- baths - beds |
show details |
| Photo | Address | Area | Beds / Baths | Price | Details |
|---|---|---|---|---|---|

|
#41
Lovelaceville Rd
Paducah, KY 42001
|
- sq. feet
|
- baths - beds |
show details | |

|
#42
Clay St Apt 33
Paducah, KY 42001
|
- sq. feet
|
- baths - beds |
show details | |

|
#43
S 9th St Apt 2
Paducah, KY 42003
|
- sq. feet
|
- baths - beds |
show details | |

|
#44
Davis Ave # B
Paducah, KY 42001
|
- sq. feet
|
- baths - beds |
show details | |

|
#45
Glenwood Dr
Paducah, KY 42003
|
- sq. feet
|
- baths - beds |
show details | |

|
#46
Trimble St
Paducah, KY 42001
|
- sq. feet
|
- baths - beds |
show details | |

|
#47
Of View Apartments #29
Paducah, KY 42001
|
- sq. feet
|
- baths - beds |
show details | |

|
#48
Fairmont St
Paducah, KY 42003
|
- sq. feet
|
- baths - beds |
show details | |

|
#49
Dundale Rd
Paducah, KY 42003
|
- sq. feet
|
- baths - beds |
show details | |

|
Check over 1 million property listings on Foreclosure.com!
|
browse all offers | |||

Latest news about housing in Paducah, KY collected exclusively by city-data.com from local newspapers, TV, and radio stations

 | Looking for Apt. or Home to Rent around the Airport Area south metro. (5 replies) |
| mid century homes (2 replies) |
| Retire in 2020 and moving to Paducah (1 reply) |
| Can anyone give me a run down on each popular city in KY? The good, bad, and ugly of living in KY? (32 replies) |
| Maybe moving to Paducah? (25 replies) |
| Bad home inspector (9 replies) |

Median year apartment built: 1969
Household type by relationship:
Households: 26,835- Male householders: 5,074 (1,910 living alone), Female householders: 6,343 (2,564 living alone)
3,976 spouses (3,928 opposite-sex spouses), 995 unmarried partners, (849 opposite-sex unmarried partners), 6,802 children (6,121 natural, 400 adopted, 280 stepchildren), 856 grandchildren, 378 brothers or sisters, 345 parents, 16 foster children, 223 other relatives, 738 non-relatives
- In group quarters: 1,083
Size of family households: 3,135 2-persons, 1,473 3-persons, 1,076 4-persons, 305 5-persons, 67 6-persons, 78 7-or-more-persons.
Size of nonfamily households: 4,735 1-person, 861 2-persons, 106 3-persons, 13 4-persons.
2,613 married couples with children.
2,215 single-parent households (296 men, 1,919 women).
97.5% of residents of Paducah speak English at home.
1.4% of residents speak Spanish at home (85% speak English very well, 12% speak English well, 3% don't speak English at all).
0.4% of residents speak other Indo-European language at home (95% speak English very well, 5% speak English not well).
0.6% of residents speak Asian or Pacific Island language at home (71% speak English very well, 21% speak English well, 8% speak English not well).
Foreign born population: 341 (1.3%)
(66.9% of them are naturalized citizens)
| Here: | 6.6 |
| State: | 6.4 |
| Here: | 4.4 |
| State: | 4.4 |

- Bedrooms in owner-occupied houses and condos in Paducah, Kentucky
- 0no bedroom
- 661 bedroom
- 1,3412 bedrooms
- 3,0563 bedrooms
- 1,2264 bedrooms
- 4525+ bedrooms

- Bedrooms in renter-occupied apartments in Paducah, Kentucky
- 239no bedroom
- 1,4591 bedroom
- 2,6152 bedrooms
- 8843 bedrooms
- 684 bedrooms
- 255+ bedrooms

- Cars and other vehicles available in Paducah in owner-occupied houses/condos
- 309no vehicle
- 1,8931 vehicle
- 2,7902 vehicles
- 8453 vehicles
- 2264 vehicles
- 785+ vehicles

- Cars and other vehicles available in Paducah in renter-occupied apartments
- 1,290no vehicle
- 2,9261 vehicle
- 8292 vehicles
- 1793 vehicles
- 554 vehicles
- 105+ vehicles

- Rooms in owner-occupied houses in Paducah, Kentucky
- 01 room
- 42 rooms
- 3773 rooms
- 4964 rooms
- 1,1205 rooms
- 1,2636 rooms
- 1,1087 rooms
- 7928 rooms
- 9829+ rooms

- Rooms in renter-occupied apartments in Paducah, Kentucky
- 2281 room
- 5702 rooms
- 1,3003 rooms
- 1,4864 rooms
- 8505 rooms
- 5736 rooms
- 2437 rooms
- 358 rooms
- 59+ rooms


Paducah, KY household income distribution

- 891Less than $10,000
- 1,824$10,000 to $19,999
- 2,072$20,000 to $29,999
- 754$30,000 to $39,999
- 730$40,000 to $49,999
- 816$50,000 to $59,999
- 809$60,000 to $74,999
- 1,069$75,000 to $99,999
- 1,188$100,000 to $124,999
- 594$125,000 to $149,999
- 549$150,000 to $199,999
- 664$200,000 or more

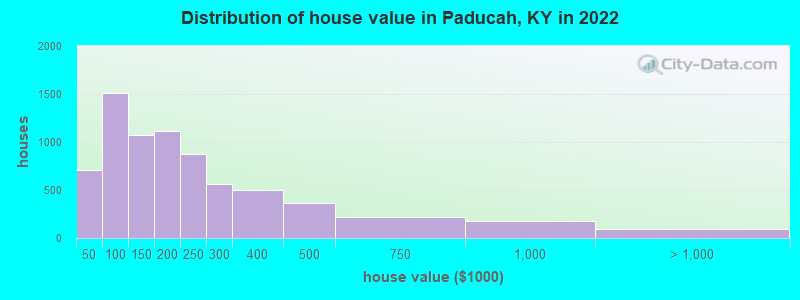
Home value of owner - occupied houses in 2022 in Paducah, KY
-
- 55Less than $10,000
- 138$10,000 to $14,999
- 52$15,000 to $19,999
- 39$20,000 to $24,999
- 49$25,000 to $29,999
- 26$30,000 to $34,999
- 40$35,000 to $39,999
- 308$40,000 to $49,999
- 317$50,000 to $59,999
- 357$60,000 to $69,999
- 88$70,000 to $79,999
- 247$80,000 to $89,999
- 192$90,000 to $99,999
- 698$100,000 to $124,999
- 373$125,000 to $149,999
- 363$150,000 to $174,999
- 748$175,000 to $199,999
- 869$200,000 to $249,999
- 562$250,000 to $299,999
- 499$300,000 to $399,999
- 360$400,000 to $499,999
- 223$500,000 to $749,999
- 175$750,000 to $999,999
- 23$1,000,000 to $1,499,999
- 53$1,500,000 to $1,999,999
- 12$2,000,000 or more
Rent paid by renters in 2022 in Paducah, KY
-
- 40Less than $100
- 94$100 to $149
- 61$150 to $199
- 426$200 to $249
- 111$250 to $299
- 292$300 to $349
- 208$350 to $399
- 176$400 to $449
- 150$450 to $499
- 301$500 to $549
- 123$550 to $599
- 241$600 to $649
- 194$650 to $699
- 710$700 to $749
- 412$750 to $799
- 371$800 to $899
- 184$900 to $999
- 345$1,000 to $1,249
- 33$1,250 to $1,499
- 93$1,500 to $1,999
- 169No cash rent


Percentage of workers working in this county: 84.0%
Number of people working at home: 931 (7.6% of all workers)

Travel time to work (commute)
- Less than 5 minutes: 517
- 5 to 9 minutes: 2,940
- 10 to 14 minutes: 2,213
- 15 to 19 minutes: 1,710
- 20 to 24 minutes: 537
- 25 to 29 minutes: 503
- 30 to 34 minutes: 1,321
- 35 to 39 minutes: 169
- 40 to 44 minutes: 233
- 45 to 59 minutes: 495
- 60 to 89 minutes: 448
- 90 or more minutes: 260
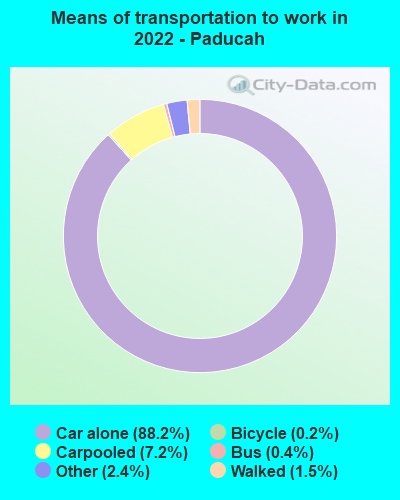
Means of transportation to work:
- Drove a car alone: 24,632 (83.0%)
- Carpooled: 2,226 (7.5%)
- Bus: 80 (0.3%)
- Light rail, streetcar or trolley: 7 (0.0%)
- Taxi: 810 (2.7%)
- Bicycle: 55 (0.2%)
- Walked: 417 (1.4%)
- Worked at home: 931 (3.1%)

- Unemployment by race in 2022
- Unemployment rate for White non-Hispanic residents
- 6.7%Males
- 1.1%Females
- Unemployment rate for Black residents
- 4.3%Males
- 11.0%Females
- Unemployment rate for American Indian and Alaska Native residents
- 14.9%Males
- Unemployment rate for two or more race residents
- 17.3%Females
- Unemployment rate for Hispanic or Latino residents
- 20.2%Females

- Year of entry for the foreign-born population in Paducah, Kentucky
- 1182010 or later
- 792000 to 2009
- 2341990 to 1999
- 591980 to 1989
- 631970 to 1979
- 34Before 1970

First ancestries reported:
- English: 5,930 (38.6%)
- American: 1,366 (8.9%)
- German: 758 (4.9%)
- African: 735 (4.8%)
- Irish: 568 (3.7%)
- Scotch-Irish: 204 (1.3%)
- European: 162 (1.1%)
- Italian: 140 (0.9%)
- Scottish: 138 (0.9%)
- Ethiopian: 127 (0.8%)
- Polish: 91 (0.6%)
- Norwegian: 87 (0.6%)
- Scandinavian: 67 (0.4%)
- Nigerian: 29 (0.2%)
- British: 18 (0.1%)
- French: 16 (0.1%)
- Dutch: 15 (0.10%)
- Arab: 14 (0.09%)
- Swedish: 14 (0.09%)
- Jamaican: 14 (0.09%)
- Russian: 13 (0.08%)
- Romanian: 10 (0.07%)
- Welsh: 9 (0.06%)
- Eastern European: 8 (0.05%)
- Czech: 5 (0.03%)
- French Canadian: 4 (0.03%)
- Northern European: 4 (0.03%)
- Iranian: 3 (0.02%)
- Lithuanian: 1 (0.01%)
Most common places of birth for foreign-born residents (%):
| Paducah: | 25.9% (147) |
| Kentucky: | 15.8% (29,070) |
| Paducah: | 12.0% (68) |
| Kentucky: | 4.2% (7,734) |
| Paducah: | 8.6% (49) |
| Kentucky: | 2.3% (4,303) |
| Paducah: | 7.2% (41) |
| Kentucky: | 7.3% (13,454) |
| Paducah: | 7.1% (40) |
| Kentucky: | 0.4% (802) |
| Paducah: | 6.5% (37) |
| Kentucky: | 0.9% (1,604) |
| Paducah: | 6.3% (36) |
| Kentucky: | 0.8% (1,529) |
| Paducah: | 5.6% (32) |
| Kentucky: | 1.9% (3,585) |
| Paducah: | 5.3% (30) |
| Kentucky: | 1.6% (2,893) |
| Paducah: | 4.1% (23) |
| Kentucky: | 0.9% (1,743) |
| Paducah: | 2.6% (15) |
| Kentucky: | 0.4% (804) |
| Paducah: | 2.3% (13) |
| Kentucky: | 0.8% (1,397) |
Place of birth for U.S.-born residents:
- This state: 16,729
- Other state: 9,314
- Northeast: 725
- Midwest: 4,889
- South: 3,158
- West: 455
88.8% of Paducah residents lived in the same house 1 years ago.
Out of people who lived in different houses, 37.3% lived in this county.
Out of people who lived in different counties, 38.7% lived in Kentucky.
| Paducah: | 88.8% |
| State average: | 87.2% |
Education attainment for males 25 years and older:
- No schooling: 106
- Nursery to 4th grade: 0
- 5th and 6th grade: 33
- 7th and 8th grade: 253
- 9th grade: 150
- 10th grade: 582
- 11th grade: 176
- 12th grade, no diploma: 60
- High school graduate (or equivalency): 2,878
- Less than 1 year of college: 515
- Some college more than 1 year, no degree: 829
- Associate degree: 450
- Bachelor's degree: 1,450
- Master's degree: 997
- Professional school degree: 468
- Doctorate degree: 181

Education attainment for females 25 years and older:
- No schooling: 26
- Nursery to 4th grade: 14
- 5th and 6th grade: 35
- 7th and 8th grade: 197
- 9th grade: 57
- 10th grade: 230
- 11th grade: 194
- 12th grade, no diploma: 154
- High school graduate (or equivalency): 2,279
- Less than 1 year of college: 1,277
- Some college more than 1 year, no degree: 2,140
- Associate degree: 824
- Bachelor's degree: 1,591
- Master's degree: 998
- Professional school degree: 144
- Doctorate degree: 113


Housing units in structures:
- One, detached: 8,518
- One, attached: 283
- Two: 886
- 3 or 4: 1,152
- 5 to 9: 1,072
- 10 to 19: 350
- 20 to 49: 282
- 50 or more: 795
- Mobile homes: 554
- Boats, RVs, vans, etc.: 8
Median worth of mobile homes: $58,775
Housing units lacking complete kitchen facilities in 2022: 4.4%
House/condo owner moved in on average 9 years ago
Renter moved in on average 1 years ago

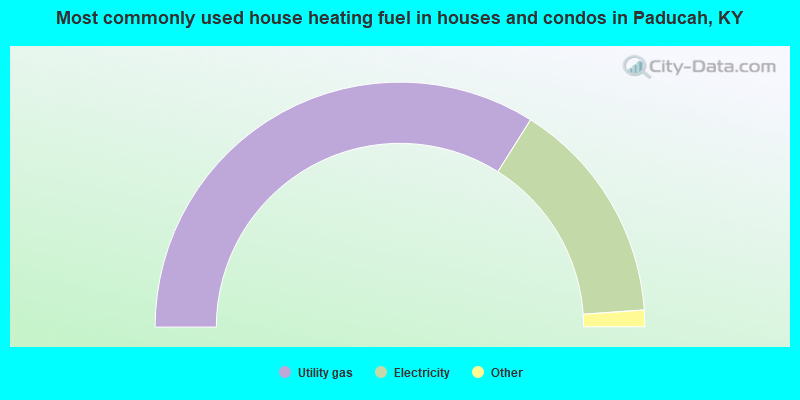
- 67.9%Utility gas
- 29.9%Electricity
- 1.2%Bottled, tank, or LP gas
- 0.5%Other fuel
- 0.3%Wood
- 0.3%Fuel oil, kerosene, etc.
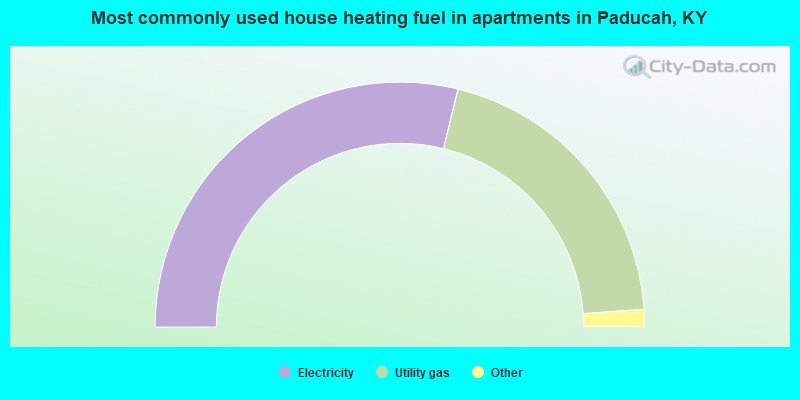
- 57.7%Electricity
- 40.1%Utility gas
- 1.1%No fuel used
- 1.0%Bottled, tank, or LP gas
Private vs. public school enrollment:
| Here: | 6.8% |
| Kentucky: | 17.2% |
| Here: | 15.6% |
| Kentucky: | 15.2% |
| Here: | 6.7% |
| Kentucky: | 19.6% |


