Palatine, IL (Illinois) Houses and Residents
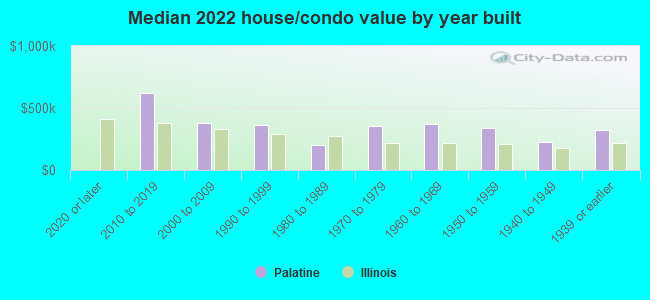
| Palatine: | $333,000 |
| Illinois: | $251,600 |
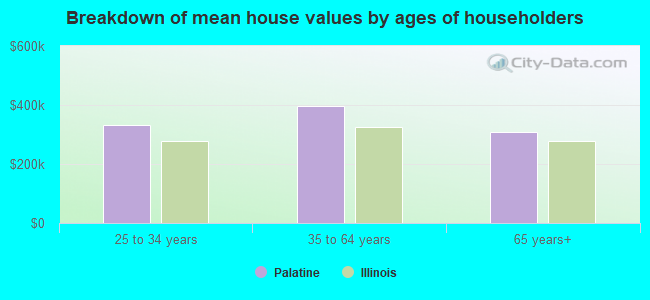
Mean price in 2022:
Detached houses: $430,382
Here: $430,382 State: $310,164 Townhouses or other attached units: $278,482
Here: $278,482 State: $286,230 In 2-unit structures: $157,877
Here: $157,877 State: $299,638 In 3-to-4-unit structures: $194,179
Here: $194,179 State: $330,907 In 5-or-more-unit structures: $175,269
Here: $175,269 State: $318,887 Mobile homes: $1,240,688
Here: $1,240,688 State: $78,855
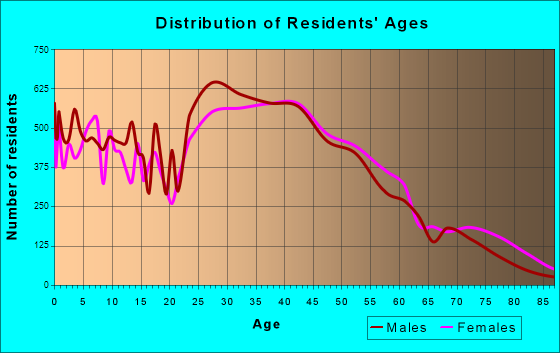
Total population: 69,387 (Urban population: 65,156, Rural population: 0)
Houses: 27,492 (26,570 occupied: 17,715 owner occupied, 8,855 renter occupied)
| % of renters here: | 33% |
| State: | 33% |
Housing density: 2,119 houses/condos per square mile
Median price asked for vacant for-sale houses and condos in 2022: $275,453.
Median contract rent in 2022: $1,307 (lower quartile is $1,080, upper quartile is $1,644)
Median rent asked for vacant for-rent units in 2022: $1,996
Median gross rent in Palatine, IL in 2022: $1,435
Housing units in Palatine with a mortgage: 10,621 (312 second mortgage, 0 home equity loan, 312 both second mortgage and home equity loan)
Houses without a mortgage: 178
Median household income for houses/condos with a mortgage: $127,168
Median household income for apartments without a mortgage: $92,006
Median monthly housing costs: $1,528
Compare current foreclosures in Palatine, IL:
| Photo | Address | Area | Beds / Baths | Price | Details |
|---|---|---|---|---|---|

|
#1
S Hart St
Palatine, IL 60067
|
1,183 sq. feet
|
1 baths 3 beds |
show details | |

|
#2
W Washington St
Palatine, IL 60067
|
1,040 sq. feet
|
1 baths 3 beds |
show details | |

|
#3
W Washington St
Palatine, IL 60067
|
1,040 sq. feet
|
1 baths - beds |
show details | |

|
#4
N Franklin Ave
Palatine, IL 60067
|
1,437 sq. feet
|
1 baths - beds |
show details | |

|
#5
Inverway
Palatine, IL 60067
|
2,524 sq. feet
|
2 baths - beds |
show details | |

|
#6
N Benton St
Palatine, IL 60067
|
1,584 sq. feet
|
1 baths - beds |
show details | |

|
#7
E Meadow Lake Dr
Palatine, IL 60074
|
1,050 sq. feet
|
2 baths - beds |
show details | |

|
#8
N Norman Dr
Palatine, IL 60074
|
1,254 sq. feet
|
2 baths - beds |
show details | |

|
#9
E Gilbert Rd
Palatine, IL 60067
|
1,189 sq. feet
|
1 baths - beds |
show details | |

|
#10
S Insignia Ct
Palatine, IL 60067
|
1,976 sq. feet
|
1 baths - beds |
show details |
| Photo | Address | Area | Beds / Baths | Price | Details |
|---|---|---|---|---|---|

|
#11
W King George Ct
Palatine, IL 60067
|
2,400 sq. feet
|
2 baths - beds |
show details | |

|
#12
N Middleton Ave
Palatine, IL 60067
|
2,530 sq. feet
|
2 baths - beds |
show details | |

|
#13
W Sutton Ct
Palatine, IL 60067
|
2,012 sq. feet
|
1 baths - beds |
show details | |

|
#14
E Forest Knoll Dr
Palatine, IL 60074
|
1,632 sq. feet
|
1 baths - beds |
show details | |

|
#15
N Whitcomb Dr
Palatine, IL 60074
|
1,248 sq. feet
|
1 baths - beds |
show details | |

|
#16
N Goldengate Ln
Palatine, IL 60067
|
1,200 sq. feet
|
2 baths - beds |
show details | |

|
#17
S Hale St
Palatine, IL 60067
|
1,008 sq. feet
|
1 baths - beds |
show details | |

|
#18
E Aster Ave
Palatine, IL 60074
|
1,129 sq. feet
|
1 baths - beds |
show details | |

|
#19
W Kenilworth Ave
Palatine, IL 60067
|
2,200 sq. feet
|
2 baths - beds |
show details | |

|
#20
E Palatine Rd Unit 10
Palatine, IL 60067
|
1,146 sq. feet
|
1 baths - beds |
show details |
| Photo | Address | Area | Beds / Baths | Price | Details |
|---|---|---|---|---|---|

|
#21
E Home Ave
Palatine, IL 60074
|
3,056 sq. feet
|
2 baths - beds |
show details | |

|
#22
E Meadow Ln
Palatine, IL 60074
|
1,223 sq. feet
|
1 baths - beds |
show details | |

|
#23
W Pleasant Hill Blvd
Palatine, IL 60067
|
1,158 sq. feet
|
2 baths - beds |
show details | |

|
#24
E Forest Knoll Dr
Palatine, IL 60074
|
1,452 sq. feet
|
2 baths - beds |
show details | |

|
#25
N Maple Ave
Palatine, IL 60067
|
1,669 sq. feet
|
1 baths - beds |
show details | |

|
#26
N Knollwood Dr
Palatine, IL 60067
|
1,155 sq. feet
|
1 baths - beds |
show details | |

|
#27
E Baldwin Rd
Palatine, IL 60074
|
1,690 sq. feet
|
2 baths - beds |
show details | |

|
#28
N Morris Dr
Palatine, IL 60074
|
1,248 sq. feet
|
1 baths - beds |
show details | |

|
#29
N Rohlwing Rd
Palatine, IL 60074
|
1,248 sq. feet
|
1 baths - beds |
show details | |

|
#30
E Old Virginia Rd
Palatine, IL 60074
|
1,773 sq. feet
|
2 baths - beds |
show details |
| Photo | Address | Area | Beds / Baths | Price | Details |
|---|---|---|---|---|---|

|
#31
E Lincoln St
Palatine, IL 60074
|
1,049 sq. feet
|
1 baths - beds |
show details | |

|
#32
E Pennsylvania Dr Apt 27-5
Palatine, IL 60074
|
- sq. feet
|
- baths - beds |
show details | |

|
#33
N Enlund Dr Unit 7
Palatine, IL 60074
|
- sq. feet
|
- baths - beds |
show details | |

|
#34
W Johnson St Apt 1
Palatine, IL 60067
|
- sq. feet
|
- baths - beds |
show details | |

|
#35
N Hidden Crk Ci 3
Palatine, IL 60074
|
- sq. feet
|
- baths - beds |
show details | |

|
#36
E Northwest Hwy
Palatine, IL 60067
|
- sq. feet
|
- baths - beds |
show details | |

|
#37
W King George Ct Apt 101
Palatine, IL 60067
|
- sq. feet
|
- baths - beds |
show details | |

|
#38
Evergreen Dr
Palatine, IL 60074
|
- sq. feet
|
- baths - beds |
show details | |

|
#39
N Sterling Ave Apt 109
Palatine, IL 60067
|
- sq. feet
|
- baths - beds |
show details | |

|
#40
Rand Grove Ln Apt 3a
Palatine, IL 60074
|
- sq. feet
|
- baths - beds |
show details |
| Photo | Address | Area | Beds / Baths | Price | Details |
|---|---|---|---|---|---|

|
#41
Lily Ln
Palatine, IL 60074
|
- sq. feet
|
- baths - beds |
show details | |

|
#42
W Palatine Rd Apt 11
Palatine, IL 60067
|
- sq. feet
|
- baths - beds |
show details | |

|
#43
Cambridge Ct Apt 1b
Palatine, IL 60074
|
- sq. feet
|
- baths - beds |
show details | |

|
#44
N Rand Rd Apt 110
Palatine, IL 60074
|
- sq. feet
|
- baths - beds |
show details | |

|
#45
E Palatine Rd
Palatine, IL 60074
|
- sq. feet
|
- baths - beds |
show details | |

|
#46
E Country Club Ct
Palatine, IL 60067
|
- sq. feet
|
- baths - beds |
show details | |

|
#47
N Sterling Ave Apt 203
Palatine, IL 60067
|
- sq. feet
|
- baths - beds |
show details | |

|
#48
W Wilson St Apt 101
Palatine, IL 60067
|
- sq. feet
|
- baths - beds |
show details | |

|
#49
E Evergreen Dr Apt 101
Palatine, IL 60074
|
- sq. feet
|
- baths - beds |
show details | |

|
Check over 1 million property listings on Foreclosure.com!
|
browse all offers | |||

Latest news about housing in Palatine, IL collected exclusively by city-data.com from local newspapers, TV, and radio stations


Median year apartment built: 1977
Household type by relationship:
Households: 65,428- Male householders: 14,164 (3,535 living alone), Female householders: 12,406 (3,632 living alone)
12,822 spouses (12,587 opposite-sex spouses), 2,274 unmarried partners, (2,274 opposite-sex unmarried partners), 18,300 children (16,797 natural, 322 adopted, 1,181 stepchildren), 872 grandchildren, 841 brothers or sisters, 1,190 parents, 0 foster children, 1,005 other relatives, 1,349 non-relatives
- In group quarters: 205
Size of family households: 6,830 2-persons, 4,582 3-persons, 2,763 4-persons, 2,177 5-persons, 442 6-persons, 85 7-or-more-persons.
Size of nonfamily households: 7,167 1-person, 2,214 2-persons, 310 3-persons.
9,151 married couples with children.
3,526 single-parent households (1,309 men, 2,217 women).
63.4% of residents of Palatine speak English at home.
16.5% of residents speak Spanish at home (57% speak English very well, 18% speak English well, 17% speak English not well, 8% don't speak English at all).
13.4% of residents speak other Indo-European language at home (65% speak English very well, 23% speak English well, 10% speak English not well, 2% don't speak English at all).
6.2% of residents speak Asian or Pacific Island language at home (67% speak English very well, 22% speak English well, 9% speak English not well, 2% don't speak English at all).
0.6% of residents speak other language at home (48% speak English very well, 40% speak English well, 5% speak English not well, 7% don't speak English at all).
Foreign born population: 15,267 (23.3%)
(64.7% of them are naturalized citizens)
| Here: | 6.1 |
| State: | 6.4 |
| Here: | 4.2 |
| State: | 4.1 |
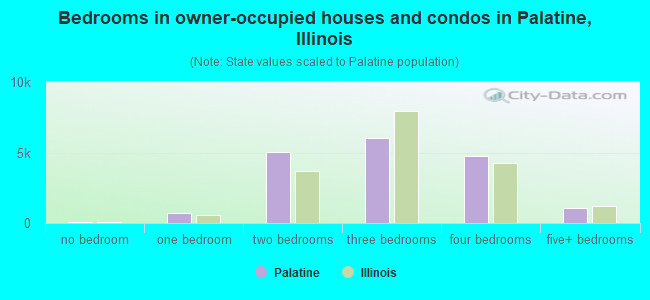
- Bedrooms in owner-occupied houses and condos in Palatine, Illinois
- 92no bedroom
- 7211 bedroom
- 5,0542 bedrooms
- 6,0483 bedrooms
- 4,7344 bedrooms
- 1,0665+ bedrooms
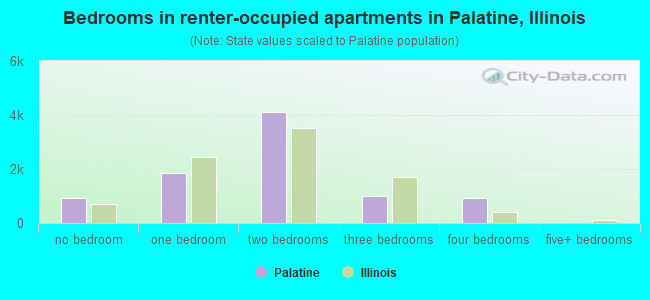
- Bedrooms in renter-occupied apartments in Palatine, Illinois
- 920no bedroom
- 1,8651 bedroom
- 4,1292 bedrooms
- 1,0043 bedrooms
- 9374 bedrooms
- 05+ bedrooms
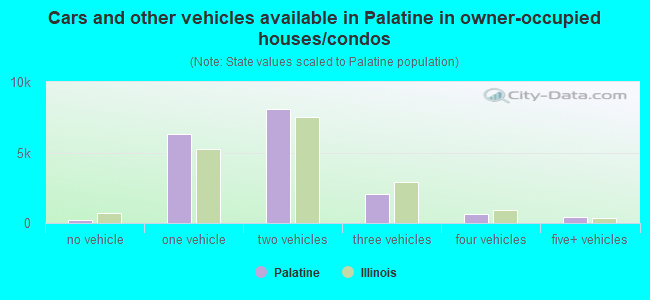
- Cars and other vehicles available in Palatine in owner-occupied houses/condos
- 206no vehicle
- 6,3031 vehicle
- 8,1032 vehicles
- 2,0283 vehicles
- 6244 vehicles
- 4515+ vehicles
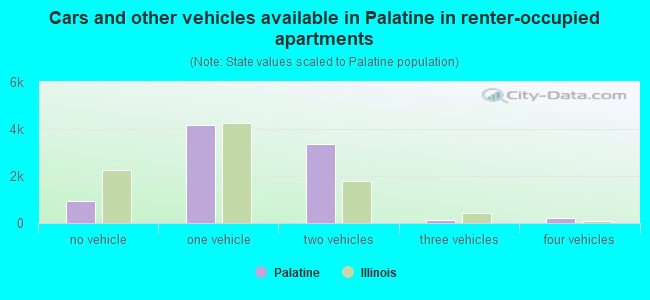
- Cars and other vehicles available in Palatine in renter-occupied apartments
- 946no vehicle
- 4,1901 vehicle
- 3,3592 vehicles
- 1423 vehicles
- 2184 vehicles
- 05+ vehicles
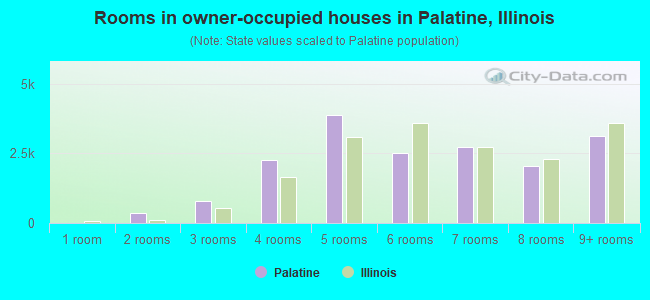
- Rooms in owner-occupied houses in Palatine, Illinois
- 01 room
- 3582 rooms
- 7843 rooms
- 2,2744 rooms
- 3,8795 rooms
- 2,5196 rooms
- 2,7147 rooms
- 2,0518 rooms
- 3,1369+ rooms
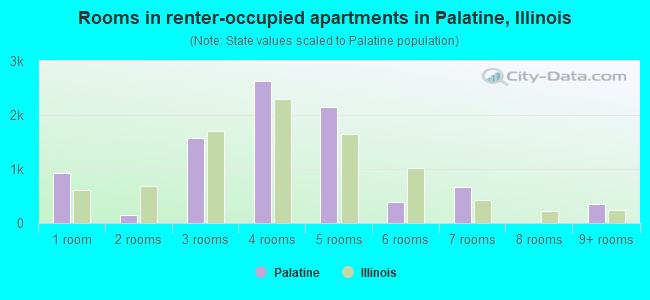
- Rooms in renter-occupied apartments in Palatine, Illinois
- 9201 room
- 1572 rooms
- 1,5743 rooms
- 2,6284 rooms
- 2,1565 rooms
- 3916 rooms
- 6757 rooms
- 08 rooms
- 3549+ rooms
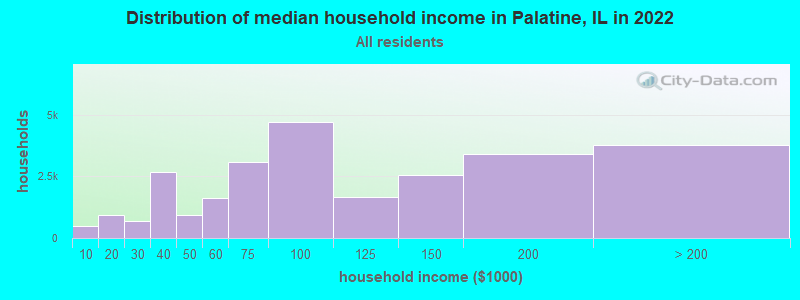
Palatine, IL household income distribution

- 473Less than $10,000
- 939$10,000 to $19,999
- 672$20,000 to $29,999
- 2,681$30,000 to $39,999
- 947$40,000 to $49,999
- 1,626$50,000 to $59,999
- 3,088$60,000 to $74,999
- 4,713$75,000 to $99,999
- 1,679$100,000 to $124,999
- 2,555$125,000 to $149,999
- 3,425$150,000 to $199,999
- 3,772$200,000 or more
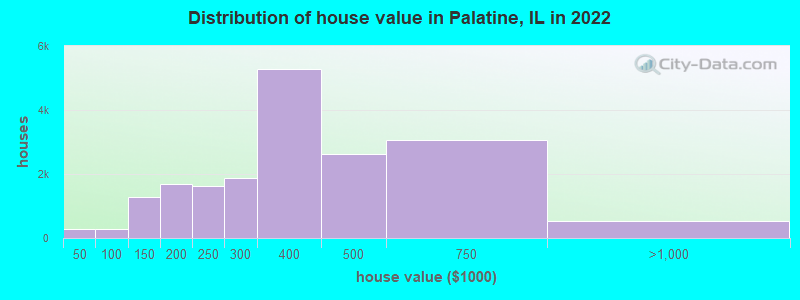
Home value of owner - occupied houses in 2022 in Palatine, IL
-
- 60Less than $10,000
- 9$10,000 to $14,999
- 58$15,000 to $19,999
- 68$20,000 to $24,999
- 26$25,000 to $29,999
- 9$30,000 to $34,999
- 38$35,000 to $39,999
- 12$40,000 to $49,999
- 41$50,000 to $59,999
- 31$60,000 to $69,999
- 39$70,000 to $79,999
- 68$80,000 to $89,999
- 82$90,000 to $99,999
- 512$100,000 to $124,999
- 760$125,000 to $149,999
- 1,063$150,000 to $174,999
- 625$175,000 to $199,999
- 1,631$200,000 to $249,999
- 1,875$250,000 to $299,999
- 5,276$300,000 to $399,999
- 2,627$400,000 to $499,999
- 3,047$500,000 to $749,999
- 467$750,000 to $999,999
- 24$1,000,000 to $1,499,999
- 31$2,000,000 or more
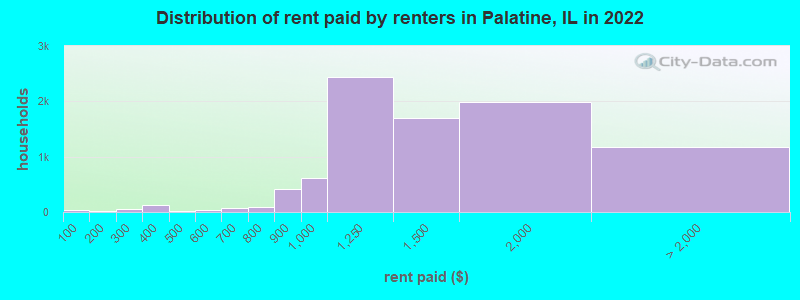
Rent paid by renters in 2022 in Palatine, IL
-
- 42Less than $100
- 13$100 to $149
- 51$200 to $249
- 13$300 to $349
- 117$350 to $399
- 14$400 to $449
- 6$450 to $499
- 9$500 to $549
- 22$550 to $599
- 79$600 to $649
- 36$700 to $749
- 48$750 to $799
- 421$800 to $899
- 611$900 to $999
- 2,442$1,000 to $1,249
- 1,707$1,250 to $1,499
- 1,990$1,500 to $1,999
- 678$2,000 to $2,499
- 253$2,500 to $2,999
- 30$3,000 to $3,499
- 31$3,500 or more
- 173No cash rent
Percentage of workers working in this county: 81.2%
Number of people working at home: 7,880 (21.4% of all workers)
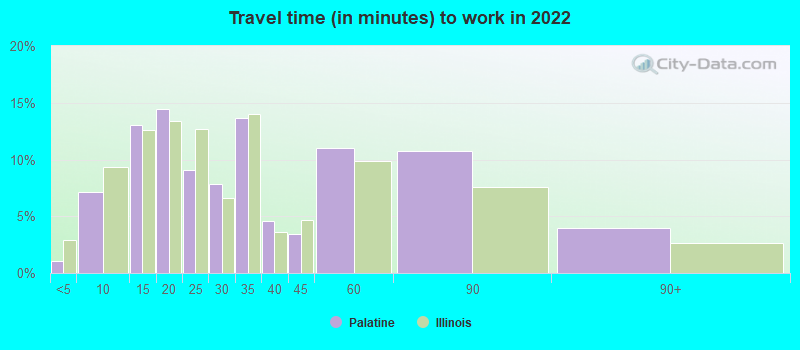
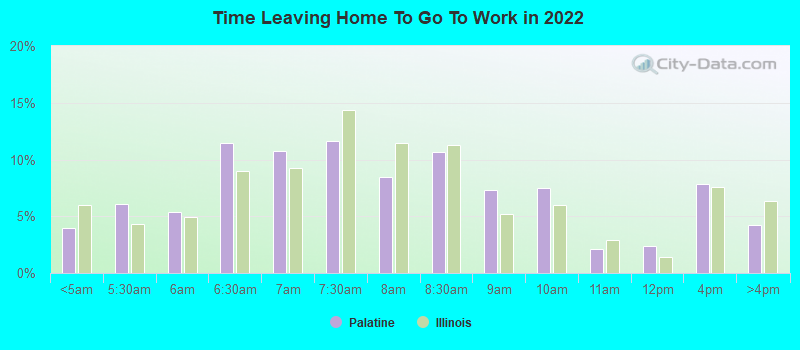
Travel time to work (commute)
- Less than 5 minutes: 310
- 5 to 9 minutes: 2,038
- 10 to 14 minutes: 3,804
- 15 to 19 minutes: 4,527
- 20 to 24 minutes: 3,016
- 25 to 29 minutes: 3,118
- 30 to 34 minutes: 2,905
- 35 to 39 minutes: 1,940
- 40 to 44 minutes: 2,048
- 45 to 59 minutes: 2,458
- 60 to 89 minutes: 2,063
- 90 or more minutes: 787
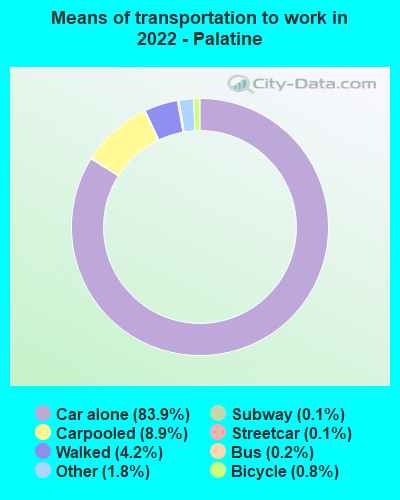
Means of transportation to work:
- Drove a car alone: 17,327 (63.9%)
- Carpooled: 1,968 (7.3%)
- Bus: 33 (0.1%)
- Subway or elevated rail: 17 (0.1%)
- Long-distance train or commuter rail: 14 (0.1%)
- Taxi: 373 (1.4%)
- Bicycle: 185 (0.7%)
- Walked: 895 (3.3%)
- Worked at home: 7,880 (29.1%)
- Unemployment by race in 2022
- Unemployment rate for White non-Hispanic residents
- 2.7%Males
- 1.8%Females
- Unemployment rate for Black residents
- 13.0%Males
- 8.1%Females
- Unemployment rate for American Indian and Alaska Native residents
- 32.7%Males
- Unemployment rate for Asian residents
- 2.6%Males
- 0.2%Females
- Unemployment rate for other race residents
- 10.1%Males
- 3.0%Females
- Unemployment rate for two or more race residents
- 1.0%Males
- 1.6%Females
- Unemployment rate for Hispanic or Latino residents
- 8.3%Males
- 2.8%Females
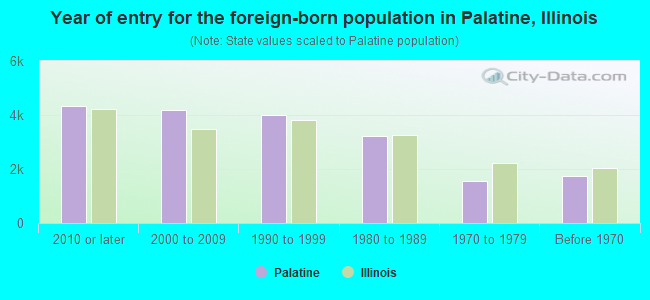
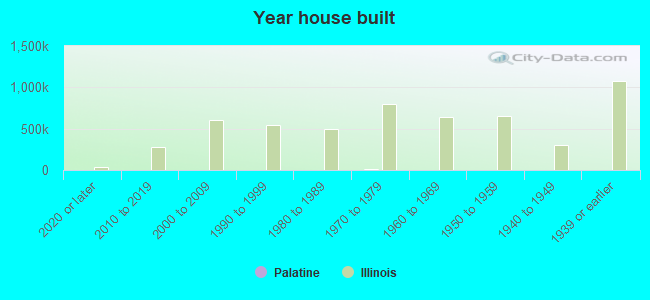
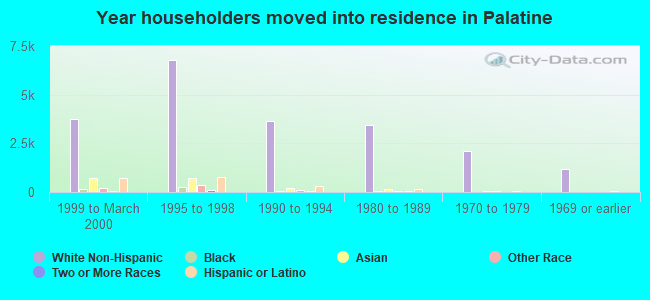
- Year of entry for the foreign-born population in Palatine, Illinois
- 4,3152010 or later
- 4,1922000 to 2009
- 4,0051990 to 1999
- 3,2231980 to 1989
- 1,5721970 to 1979
- 1,738Before 1970
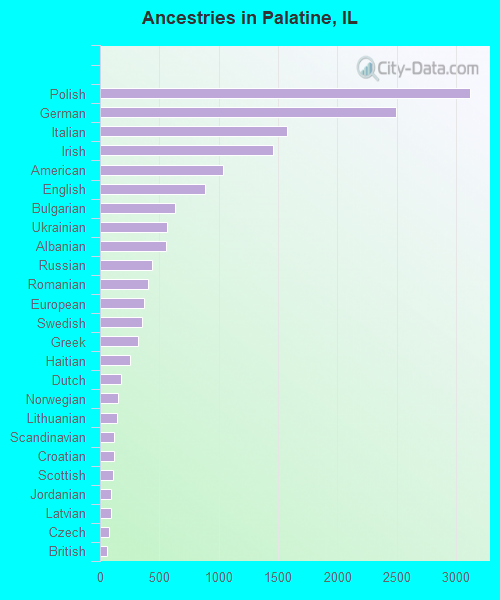
First ancestries reported:
- Polish: 3,122 (9.2%)
- German: 2,491 (7.3%)
- Italian: 1,573 (4.6%)
- Irish: 1,458 (4.3%)
- American: 1,035 (3.1%)
- English: 885 (2.6%)
- Bulgarian: 628 (1.9%)
- Ukrainian: 566 (1.7%)
- Albanian: 559 (1.6%)
- Russian: 435 (1.3%)
- Romanian: 406 (1.2%)
- European: 370 (1.1%)
- Swedish: 353 (1.0%)
- Greek: 321 (0.9%)
- Haitian: 254 (0.7%)
- Dutch: 174 (0.5%)
- Norwegian: 149 (0.4%)
- Lithuanian: 147 (0.4%)
- Scandinavian: 121 (0.4%)
- Croatian: 117 (0.3%)
- Scottish: 111 (0.3%)
- Jordanian: 91 (0.3%)
- Latvian: 90 (0.3%)
- Czech: 74 (0.2%)
- British: 62 (0.2%)
- Jamaican: 56 (0.2%)
- Iraqi: 52 (0.2%)
- Canadian: 44 (0.1%)
- Eastern European: 38 (0.1%)
- Scotch-Irish: 37 (0.1%)
- Slovak: 36 (0.1%)
- Hungarian: 35 (0.1%)
- Serbian: 34 (0.1%)
- African: 33 (0.10%)
- Iranian: 29 (0.09%)
- Swiss: 29 (0.09%)
- Cape Verdean: 27 (0.08%)
- Welsh: 25 (0.07%)
- Nigerian: 19 (0.06%)
- French: 19 (0.06%)
- French Canadian: 18 (0.05%)
- Northern European: 16 (0.05%)
- Austrian: 15 (0.04%)
- Assyrian: 14 (0.04%)
- Brazilian: 14 (0.04%)
- Yugoslavian: 11 (0.03%)
- Liberian: 10 (0.03%)
- West Indian: 8 (0.02%)
- Slovene: 7 (0.02%)
- Danish: 6 (0.02%)
- Macedonian: 5 (0.01%)
- Lebanese: 5 (0.01%)
- Egyptian: 5 (0.01%)
- Finnish: 3 (0.01%)
- Armenian: 3 (0.01%)
- Zimbabwean: 3 (0.01%)
Most common places of birth for foreign-born residents (%):
| Palatine: | 24.1% (3,930) |
| Illinois: | 34.7% (626,958) |
| Palatine: | 15.1% (2,456) |
| Illinois: | 9.2% (166,409) |
| Palatine: | 9.1% (1,489) |
| Illinois: | 6.9% (124,474) |
| Palatine: | 5.2% (856) |
| Illinois: | 2.2% (40,393) |
| Palatine: | 4.8% (782) |
| Illinois: | 1.6% (29,316) |
| Palatine: | 3.6% (592) |
| Illinois: | 0.8% (14,165) |
| Palatine: | 3.3% (539) |
| Illinois: | 5.2% (93,003) |
| Palatine: | 2.9% (469) |
| Illinois: | 0.6% (10,943) |
| Palatine: | 2.7% (448) |
| Illinois: | 1.6% (29,519) |
| Palatine: | 2.5% (414) |
| Illinois: | 4.1% (74,364) |
| Palatine: | 1.8% (286) |
| Illinois: | 0.9% (16,308) |
| Palatine: | 1.7% (281) |
| Illinois: | 0.5% (8,235) |
Place of birth for U.S.-born residents:
- This state: 39,366
- Other state: 10,386
- Northeast: 929
- Midwest: 4,798
- South: 2,835
- West: 1,824
86.8% of Palatine residents lived in the same house 1 years ago.
Out of people who lived in different houses, 39.8% lived in this county.
Out of people who lived in different counties, 56.5% lived in Illinois.
| Palatine: | 86.8% |
| State average: | 88.3% |
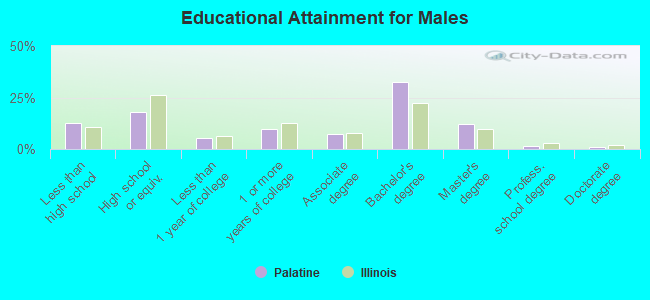
Education attainment for males 25 years and older:
- No schooling: 1,252
- Nursery to 4th grade: 70
- 5th and 6th grade: 859
- 7th and 8th grade: 117
- 9th grade: 110
- 10th grade: 0
- 11th grade: 164
- 12th grade, no diploma: 317
- High school graduate (or equivalency): 3,992
- Less than 1 year of college: 1,216
- Some college more than 1 year, no degree: 2,170
- Associate degree: 1,638
- Bachelor's degree: 7,320
- Master's degree: 2,758
- Professional school degree: 296
- Doctorate degree: 212
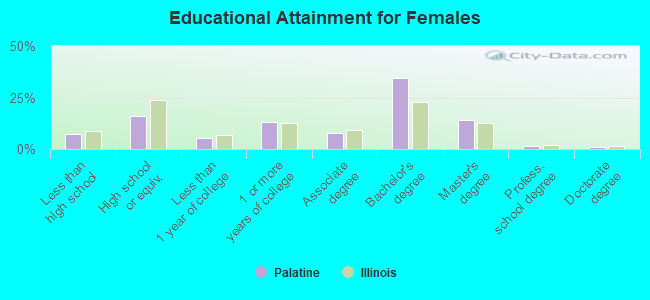
Education attainment for females 25 years and older:
- No schooling: 169
- Nursery to 4th grade: 51
- 5th and 6th grade: 776
- 7th and 8th grade: 0
- 9th grade: 82
- 10th grade: 151
- 11th grade: 109
- 12th grade, no diploma: 326
- High school graduate (or equivalency): 3,782
- Less than 1 year of college: 1,204
- Some college more than 1 year, no degree: 3,090
- Associate degree: 1,768
- Bachelor's degree: 8,064
- Master's degree: 3,247
- Professional school degree: 305
- Doctorate degree: 180
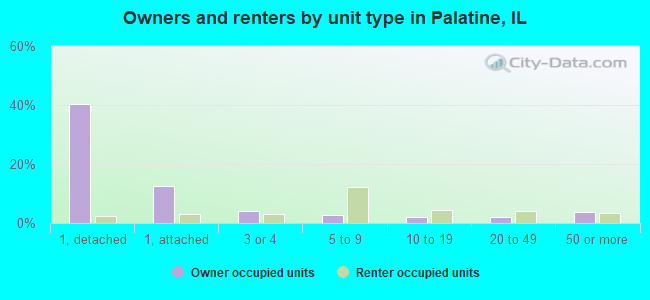
Housing units in structures:
- One, detached: 10,419
- One, attached: 4,348
- Two: 595
- 3 or 4: 1,949
- 5 to 9: 4,578
- 10 to 19: 1,346
- 20 to 49: 2,041
- 50 or more: 1,968
- Mobile homes: 248
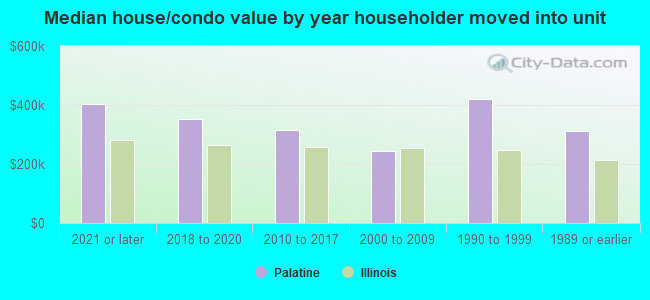
House/condo owner moved in on average 12 years ago
Renter moved in on average 2 years ago
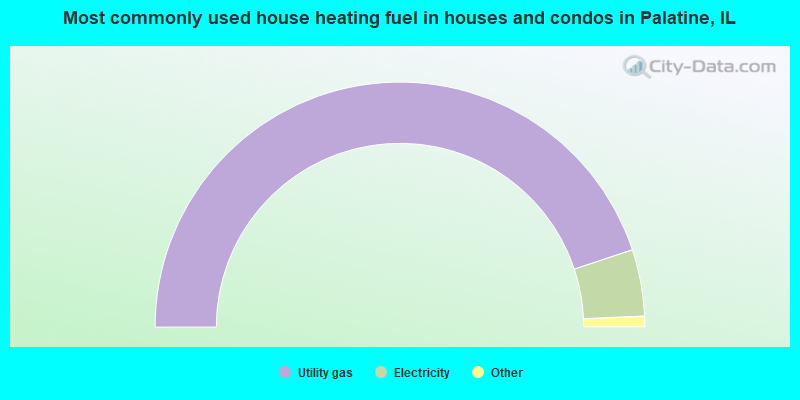
- 89.8%Utility gas
- 8.8%Electricity
- 0.8%Bottled, tank, or LP gas
- 0.3%Other fuel
- 0.2%No fuel used
- 0.1%Solar energy
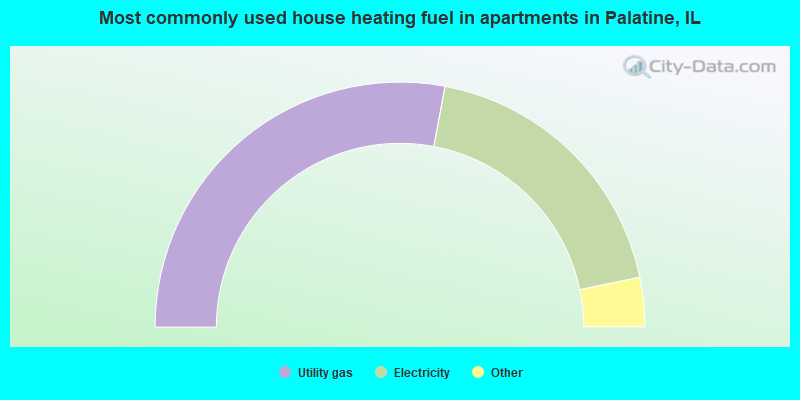
- 55.9%Utility gas
- 37.6%Electricity
- 3.4%No fuel used
- 2.4%Bottled, tank, or LP gas
- 0.7%Other fuel
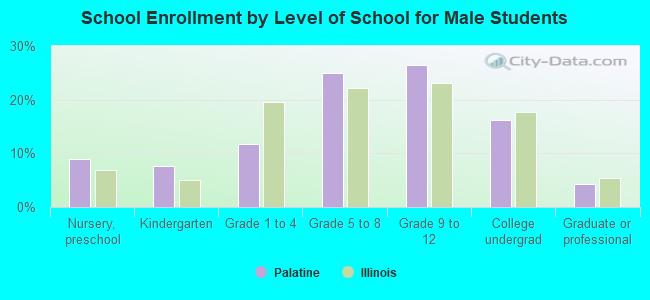
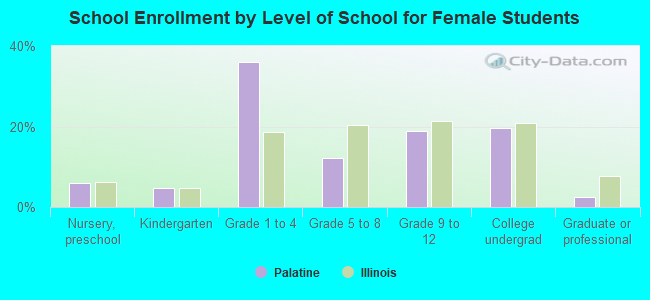
Private vs. public school enrollment:
| Here: | 8.4% |
| Illinois: | 13.3% |
| Here: | 0.1% |
| Illinois: | 9.9% |
| Here: | 10.5% |
| Illinois: | 27.4% |