Palestine, IL (Illinois) Houses and Residents
| Palestine: | $74,712 |
| Illinois: | $251,600 |
Mean price in 2022:
Detached houses: $84,135
Here: $84,135 State: $310,164 Mobile homes: $70,104
Here: $70,104 State: $78,855
Total population: 1,330 (Urban population: 0, Rural population: 1,368 (all nonfarm))
Houses: 669 (594 occupied: 515 owner occupied, 86 renter occupied)
| % of renters here: | 14% |
| State: | 33% |
Housing density: 897 houses/condos per square mile
Median price asked for vacant for-sale houses and condos in 2022 in this county: $140,039.
Median contract rent in 2022: $555 (lower quartile is $426, upper quartile is $901)
Median rent asked for vacant for-rent units in 2022: $458
Median gross rent in Palestine, IL in 2022: $780
Housing units in Palestine with a mortgage: 245 (17 second mortgage, 0 home equity loan, 11 both second mortgage and home equity loan)
Houses without a mortgage: 0
Median household income for houses/condos with a mortgage: $79,153
Median household income for apartments without a mortgage: $47,169
Median monthly housing costs: $650
Compare current foreclosures near Palestine, IL:
| Photo | Address | Area | Beds / Baths | Price | Details |
|---|---|---|---|---|---|

|
#1
S Main St
Palestine, IL 62451
|
- sq. feet
|
- baths - beds |
show details | |

|
#2
N Steele St
Palestine, IL 62451
|
- sq. feet
|
- baths - beds |
show details | |

|
#3
E Franklin St
Palestine, IL 62451
|
- sq. feet
|
- baths - beds |
show details | |

|
#4
S Holson St
Sullivan, IN 47882
|
1,542 sq. feet
|
1 baths 3 beds |
show details | |

|
#5
E Laurel Ln
Robinson, IL 62454
|
1,574 sq. feet
|
2 baths 4 beds |
show details | |

|
#6
W Graysville St
Sullivan, IN 47882
|
1,080 sq. feet
|
1 baths 2 beds |
show details | |

|
#7
S County Road 5 E
Sullivan, IN 47882
|
- sq. feet
|
2 baths 3 beds |
show details | |

|
#8
W Iowa St
Oblong, IL 62449
|
907 sq. feet
|
1 baths 2 beds |
show details | |

|
#9
Church St
Oaktown, IN 47561
|
1,476 sq. feet
|
1 baths 3 beds |
show details | |

|
#10
E Angling Rd
West Union, IL 62477
|
1,958 sq. feet
|
1 baths - beds |
show details |
| Photo | Address | Area | Beds / Baths | Price | Details |
|---|---|---|---|---|---|

|
#11
Oakwood Rd
Carlisle, IN 47838
|
1,293 sq. feet
|
3 baths 3 beds |
show details | |

|
#12
N Turman St
Carlisle, IN 47838
|
2,004 sq. feet
|
1 baths 3 beds |
show details | |

|
#13
S State St
Sullivan, IN 47882
|
1,040 sq. feet
|
1 baths 3 beds |
show details | |

|
#14
W Giles St
Sullivan, IN 47882
|
1,704 sq. feet
|
2 baths 4 beds |
show details | |

|
#15
N Broad St
Sullivan, IN 47882
|
1,768 sq. feet
|
1 baths 3 beds |
show details | |

|
#16
W Indiana Ave
Sullivan, IN 47882
|
- sq. feet
|
1 baths 2 beds |
show details | |

|
#17
N West St
Sullivan, IN 47882
|
1,864 sq. feet
|
1 baths 3 beds |
show details | |

|
#18
Maple Ave
Oaktown, IN 47561
|
1,474 sq. feet
|
1 baths 3 beds |
show details | |

|
#19
N North Main St
Sullivan, IN 47882
|
1,104 sq. feet
|
1 baths 3 beds |
show details | |

|
#20
E Northwood Dr
Sullivan, IN 47882
|
1,428 sq. feet
|
2 baths - beds |
show details |
| Photo | Address | Area | Beds / Baths | Price | Details |
|---|---|---|---|---|---|

|
#21
Meadowview Dr
Shelburn, IN 47879
|
1,248 sq. feet
|
2 baths - beds |
show details | |

|
#22
E Beech St
Sullivan, IN 47882
|
1,040 sq. feet
|
1 baths - beds |
show details | |

|
#23
N Park St
Oaktown, IN 47561
|
- sq. feet
|
- baths - beds |
show details | |

|
#24
W Glenn St
Shelburn, IN 47879
|
- sq. feet
|
- baths - beds |
show details | |

|
#25
S County Road 100 E
Carlisle, IN 47838
|
- sq. feet
|
- baths - beds |
show details | |

|
#26
E Illinois St
Oblong, IL 62449
|
- sq. feet
|
- baths - beds |
show details | |

|
#27
W State Road 48
Fairbanks, IN 47849
|
- sq. feet
|
- baths - beds |
show details | |

|
#28
E 900th Ave
Robinson, IL 62454
|
- sq. feet
|
- baths - beds |
show details | |

|
#29
N Country 125 Rd E
Shelburn, IN 47879
|
- sq. feet
|
- baths - beds |
show details | |

|
#30
E Mefford St
Robinson, IL 62454
|
- sq. feet
|
- baths - beds |
show details |
| Photo | Address | Area | Beds / Baths | Price | Details |
|---|---|---|---|---|---|

|
#31
N County Road 700 W
Sullivan, IN 47882
|
- sq. feet
|
- baths - beds |
show details | |

|
#32
State Highway 1
Robinson, IL 62454
|
- sq. feet
|
- baths - beds |
show details | |

|
#33
N Plum St
Flat Rock, IL 62427
|
- sq. feet
|
- baths - beds |
show details | |

|
#34
S Prairie St Apt E1
Robinson, IL 62454
|
- sq. feet
|
- baths - beds |
show details | |

|
#35
E Plum St
Robinson, IL 62454
|
- sq. feet
|
- baths - beds |
show details | |

|
#36
Gollyville Rd
Flat Rock, IL 62427
|
- sq. feet
|
- baths - beds |
show details | |

|
#37
E Clearwater St
Robinson, IL 62454
|
- sq. feet
|
- baths - beds |
show details | |

|
#38
E Main St
Robinson, IL 62454
|
- sq. feet
|
- baths - beds |
show details | |

|
#39
E Plum St
Robinson, IL 62454
|
- sq. feet
|
- baths - beds |
show details | |

|
#40
E Saint Petersburg St
Robinson, IL 62454
|
- sq. feet
|
- baths - beds |
show details |
| Photo | Address | Area | Beds / Baths | Price | Details |
|---|---|---|---|---|---|

|
#41
E Washington Ave
Stoy, IL 62464
|
- sq. feet
|
- baths - beds |
show details | |

|
#42
N Cross St
Robinson, IL 62454
|
- sq. feet
|
- baths - beds |
show details | |

|
#43
N Robb St
Robinson, IL 62454
|
- sq. feet
|
- baths - beds |
show details | |

|
#44
S Willow Dr
Robinson, IL 62454
|
- sq. feet
|
- baths - beds |
show details | |

|
#45
N Plum St
Flat Rock, IL 62427
|
- sq. feet
|
- baths - beds |
show details | |

|
#46
N Truman St
Robinson, IL 62454
|
- sq. feet
|
- baths - beds |
show details | |

|
#47
W Tulip Ln
Robinson, IL 62454
|
- sq. feet
|
- baths - beds |
show details | |

|
#48
S Park St
Robinson, IL 62454
|
- sq. feet
|
- baths - beds |
show details | |

|
Check over 1 million property listings on Foreclosure.com!
|
browse all offers | |||

Latest news about housing in Palestine, IL collected exclusively by city-data.com from local newspapers, TV, and radio stations

 | ordering a chicago style hot dog in chicago (56 replies) |
| Racism against White people in Pilsen (85 replies) |
| Muslim Family in Glencoe (31 replies) |
| Guns and Shootings in Chicago: Here's the problem... (52 replies) |
| Is Berwyn potentially the next Oak Park? (94 replies) |
| Will Jack in the Box ever return to Chicagoland? (54 replies) |

Median year apartment built: 1970
Household type by relationship:
Households: 1,360- Male householders: 216 (50 living alone), Female householders: 366 (139 living alone)
255 spouses (252 opposite-sex spouses), 66 unmarried partners, (66 opposite-sex unmarried partners), 346 children (311 natural, 11 adopted, 22 stepchildren), 29 grandchildren, 13 brothers or sisters, 6 parents, 0 foster children, 5 other relatives, 52 non-relatives
Size of family households: 157 2-persons, 87 3-persons, 80 4-persons, 16 5-persons, 5 6-persons, 17 7-or-more-persons.
Size of nonfamily households: 199 1-person, 37 2-persons, 2 3-persons.
115 married couples with children.
104 single-parent households (7 men, 97 women).
99.6% of residents of Palestine speak English at home.
0.2% of residents speak Asian or Pacific Island language at home (100% speak English very well).
Foreign born population: 3 (0.2%)
(100.0% of them are naturalized citizens)
| Here: | 6.0 |
| State: | 6.4 |
| Here: | 5.0 |
| State: | 4.1 |

- Bedrooms in owner-occupied houses and condos in Palestine, Illinois
- 0no bedroom
- 431 bedroom
- 1672 bedrooms
- 2253 bedrooms
- 694 bedrooms
- 125+ bedrooms

- Bedrooms in renter-occupied apartments in Palestine, Illinois
- 0no bedroom
- 41 bedroom
- 522 bedrooms
- 133 bedrooms
- 04 bedrooms
- 175+ bedrooms

- Cars and other vehicles available in Palestine in owner-occupied houses/condos
- 11no vehicle
- 1941 vehicle
- 1582 vehicles
- 923 vehicles
- 464 vehicles
- 155+ vehicles

- Cars and other vehicles available in Palestine in renter-occupied apartments
- 19no vehicle
- 221 vehicle
- 202 vehicles
- 243 vehicles
- 04 vehicles
- 05+ vehicles

- Rooms in owner-occupied houses in Palestine, Illinois
- 01 room
- 02 rooms
- 123 rooms
- 394 rooms
- 1345 rooms
- 1346 rooms
- 767 rooms
- 528 rooms
- 689+ rooms

- Rooms in renter-occupied apartments in Palestine, Illinois
- 01 room
- 02 rooms
- 03 rooms
- 344 rooms
- 155 rooms
- 136 rooms
- 57 rooms
- 08 rooms
- 199+ rooms


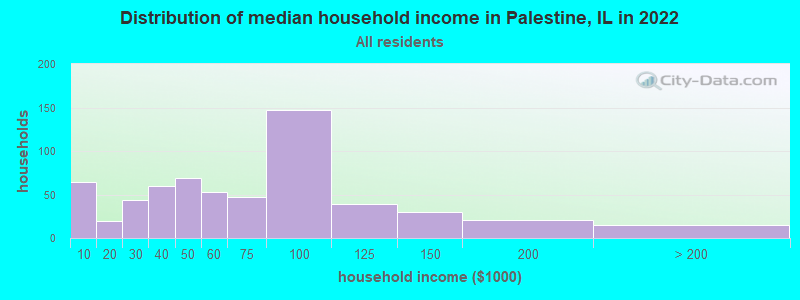
Palestine, IL household income distribution

- 64Less than $10,000
- 19$10,000 to $19,999
- 44$20,000 to $29,999
- 60$30,000 to $39,999
- 69$40,000 to $49,999
- 53$50,000 to $59,999
- 47$60,000 to $74,999
- 147$75,000 to $99,999
- 39$100,000 to $124,999
- 30$125,000 to $149,999
- 21$150,000 to $199,999
- 15$200,000 or more
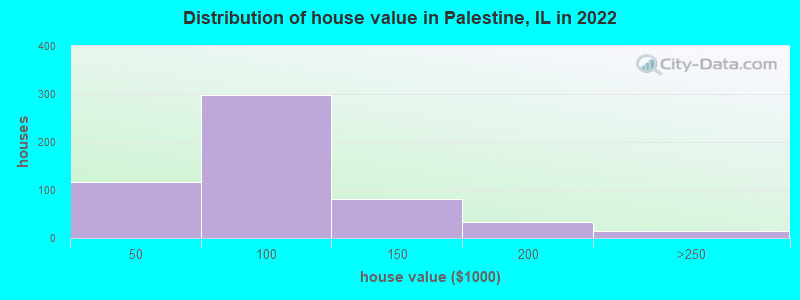
Home value of owner - occupied houses in 2022 in Palestine, IL
-
- 13Less than $10,000
- 1$15,000 to $19,999
- 10$20,000 to $24,999
- 15$25,000 to $29,999
- 9$30,000 to $34,999
- 9$35,000 to $39,999
- 56$40,000 to $49,999
- 78$50,000 to $59,999
- 41$60,000 to $69,999
- 65$70,000 to $79,999
- 30$80,000 to $89,999
- 25$90,000 to $99,999
- 32$100,000 to $124,999
- 47$125,000 to $149,999
- 27$150,000 to $174,999
- 5$175,000 to $199,999
- 14$200,000 to $249,999
Rent paid by renters in 2022 in Palestine, IL
-
- 2Less than $100
- 2$250 to $299
- 23$400 to $449
- 3$450 to $499
- 3$500 to $549
- 9$550 to $599
- 6$800 to $899
- 17$900 to $999
- 15No cash rent


Percentage of workers working in this county: 74.2%
Number of people working at home: 27 (4.6% of all workers)
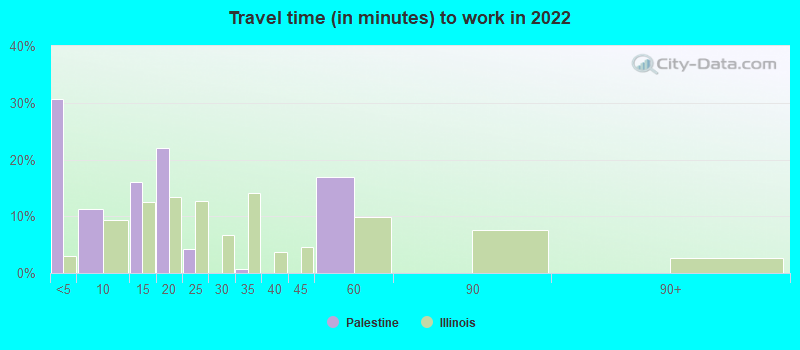
Travel time to work (commute)
- Less than 5 minutes: 54
- 5 to 9 minutes: 79
- 10 to 14 minutes: 118
- 15 to 19 minutes: 100
- 20 to 24 minutes: 25
- 25 to 29 minutes: 2
- 30 to 34 minutes: 28
- 35 to 39 minutes: 5
- 40 to 44 minutes: 25
- 45 to 59 minutes: 52
- 60 to 89 minutes: 45
- 90 or more minutes: 1
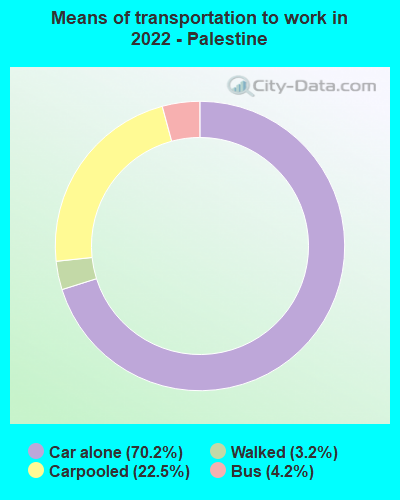
Means of transportation to work:
- Drove a car alone: 189 (63.9%)
- Carpooled: 60 (20.3%)
- Bus: 9 (3.0%)
- Walked: 8 (2.7%)
- Worked at home: 21 (7.1%)

- Unemployment by race in 2022
- Unemployment rate for White non-Hispanic residents
- 4.1%Males
- 1.4%Females

- Year of entry for the foreign-born population in Palestine, Illinois
- 02010 or later
- 32000 to 2009
- 01990 to 1999
- 01980 to 1989
- 31970 to 1979
- 2Before 1970

First ancestries reported:
- English: 126 (25.9%)
- Irish: 84 (17.3%)
- American: 78 (16.0%)
- German: 74 (15.2%)
- Scotch-Irish: 21 (4.3%)
- Scottish: 17 (3.5%)
- Danish: 14 (2.9%)
- European: 9 (1.9%)
- Italian: 5 (1.0%)
- French: 2 (0.4%)
- Polish: 2 (0.4%)
Most common places of birth for foreign-born residents (%):
| Palestine: | 66.7% (2) |
| Illinois: | 5.2% (93,003) |
Place of birth for U.S.-born residents:
- This state: 949
- Other state: 400
- Northeast: 23
- Midwest: 336
- South: 39
- West: 3
83.0% of Palestine residents lived in the same house 1 years ago.
Out of people who lived in different houses, 44.1% lived in this county.
Out of people who lived in different counties, 9.3% lived in Illinois.
| Palestine: | 83.0% |
| State average: | 88.3% |
Education attainment for males 25 years and older:
- No schooling: 3
- Nursery to 4th grade: 0
- 5th and 6th grade: 0
- 7th and 8th grade: 0
- 9th grade: 2
- 10th grade: 0
- 11th grade: 10
- 12th grade, no diploma: 4
- High school graduate (or equivalency): 178
- Less than 1 year of college: 31
- Some college more than 1 year, no degree: 80
- Associate degree: 78
- Bachelor's degree: 17
- Master's degree: 19
- Professional school degree: 4
- Doctorate degree: 0

Education attainment for females 25 years and older:
- No schooling: 0
- Nursery to 4th grade: 0
- 5th and 6th grade: 0
- 7th and 8th grade: 8
- 9th grade: 0
- 10th grade: 0
- 11th grade: 27
- 12th grade, no diploma: 0
- High school graduate (or equivalency): 130
- Less than 1 year of college: 65
- Some college more than 1 year, no degree: 112
- Associate degree: 132
- Bachelor's degree: 30
- Master's degree: 34
- Professional school degree: 0
- Doctorate degree: 0


Housing units in structures:
- One, detached: 587
- Two: 17
- 3 or 4: 15
- 50 or more: 2
- Mobile homes: 47
Housing units lacking complete kitchen facilities in 2022: 5.7%
House/condo owner moved in on average 15 years ago
Renter moved in on average 1 years ago

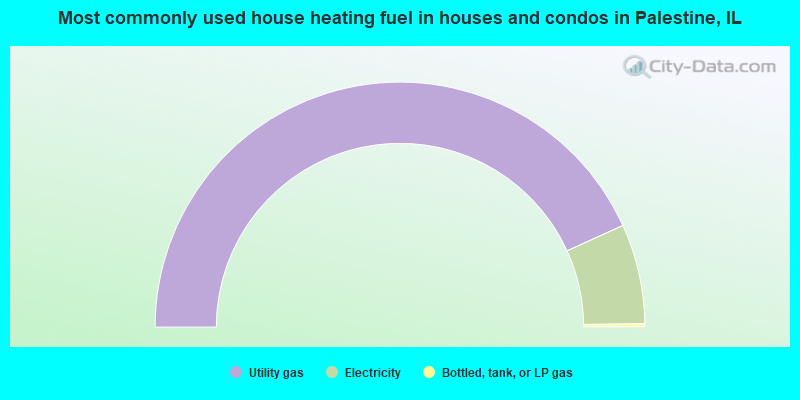
- 86.4%Utility gas
- 13.2%Electricity
- 0.4%Bottled, tank, or LP gas
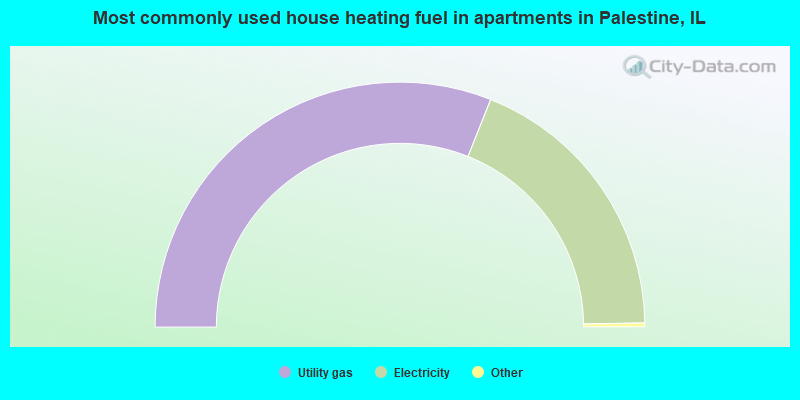
- 62.4%Utility gas
- 37.6%Electricity
Private vs. public school enrollment:
| Here: | 7.9% |
| Illinois: | 13.3% |
| Here: | 0.0% |
| Illinois: | 9.9% |
| Here: | 0.0% |
| Illinois: | 27.4% |


