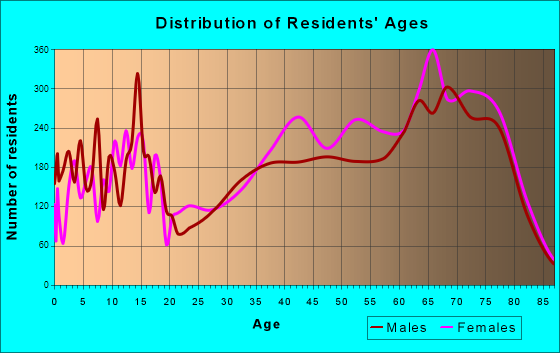
Palm Coast, FL (Florida) Houses and Residents
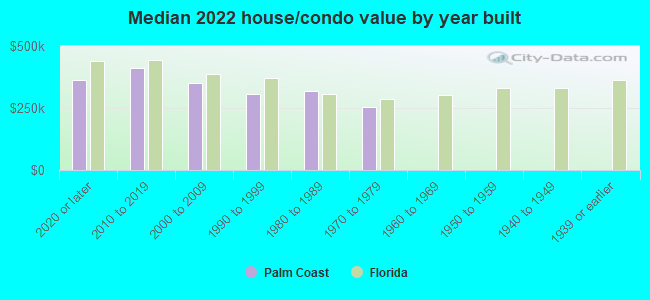
| Palm Coast: | $342,200 |
| Florida: | $354,100 |
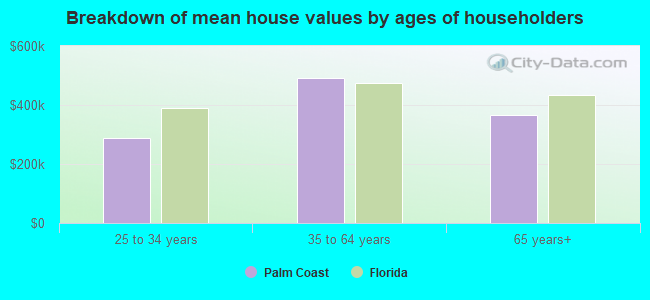
Mean price in 2022:
Detached houses: $344,385
Here: $344,385 State: $500,941 Townhouses or other attached units: $260,502
Here: $260,502 State: $370,869 In 2-unit structures: $303,521
Here: $303,521 State: $423,188 In 3-to-4-unit structures: $178,267
Here: $178,267 State: $309,944 In 5-or-more-unit structures: $318,065
Here: $318,065 State: $447,145 Mobile homes: $121,852
Here: $121,852 State: $113,202
Total population: 80,600 (Urban population: 27,784 (all inside urban clusters), Rural population: 5,720 (8 farm, 5,712 nonfarm))
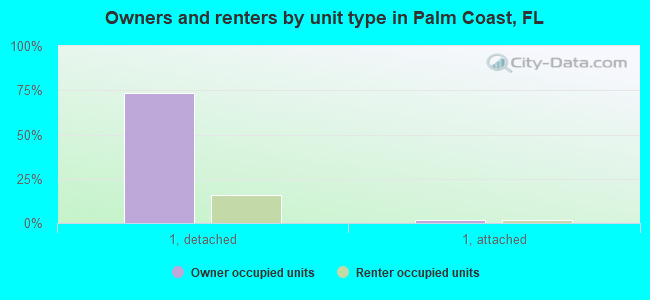
Houses: 46,026 (42,656 occupied: 35,205 owner occupied, 7,451 renter occupied)
| % of renters here: | 17% |
| State: | 33% |
Housing density: 908 houses/condos per square mile
Median price asked for vacant for-sale houses and condos in 2022: $395,162.
Median contract rent in 2022: $1,408 (lower quartile is $1,161, upper quartile is $1,864)
Median rent asked for vacant for-rent units in 2022: $1,114
Median gross rent in Palm Coast, FL in 2022: $1,632
Housing units in Palm Coast with a mortgage: 19,445 (1,564 second mortgage, 0 home equity loan, 1,263 both second mortgage and home equity loan)
Houses without a mortgage: 459
Median household income for houses/condos with a mortgage: $79,184
Median household income for apartments without a mortgage: $57,526
Median monthly housing costs: $1,177
Compare current foreclosures in Palm Coast, FL:
| Photo | Address | Area | Beds / Baths | Price | Details |
|---|---|---|---|---|---|

|
#1
N Village Dr
Palm Coast, FL 32137
|
2,616 sq. feet
|
3 baths 4 beds |
$534,900
|
show details |

|
#2
Bainbridge Ln
Palm Coast, FL 32137
|
2,293 sq. feet
|
2 baths 3 beds |
show details | |

|
#3
Becker Ln
Palm Coast, FL 32137
|
1,508 sq. feet
|
2 baths 3 beds |
show details | |

|
#4
Port Royal Dr
Palm Coast, FL 32164
|
1,990 sq. feet
|
2 baths 4 beds |
show details | |

|
#5
Fleetwood Dr
Palm Coast, FL 32137
|
1,774 sq. feet
|
2 baths - beds |
show details | |

|
#6
Crossbow Ct
Palm Coast, FL 32137
|
3,102 sq. feet
|
2 baths - beds |
show details | |

|
#7
Smokehouse Pl
Palm Coast, FL 32164
|
1,257 sq. feet
|
2 baths - beds |
show details | |

|
#8
Powder Horn Dr
Palm Coast, FL 32164
|
1,718 sq. feet
|
2 baths - beds |
show details | |

|
#9
Radius Pl
Palm Coast, FL 32164
|
2,862 sq. feet
|
2 baths - beds |
show details | |

|
#10
Belvedere Ln
Palm Coast, FL 32137
|
1,381 sq. feet
|
2 baths - beds |
show details |
| Photo | Address | Area | Beds / Baths | Price | Details |
|---|---|---|---|---|---|

|
#11
Prairie Ln
Palm Coast, FL 32164
|
1,542 sq. feet
|
2 baths - beds |
show details | |

|
#12
Rose Dr
Palm Coast, FL 32164
|
1,008 sq. feet
|
1 baths - beds |
show details | |

|
#13
Wembley Pl
Palm Coast, FL 32164
|
1,719 sq. feet
|
2 baths - beds |
show details | |

|
#14
Sea Trl
Palm Coast, FL 32164
|
1,730 sq. feet
|
2 baths - beds |
show details | |

|
#15
Zoffer Ct
Palm Coast, FL 32164
|
2,559 sq. feet
|
4 baths - beds |
show details | |

|
#16
Seathorn Path
Palm Coast, FL 32164
|
2,505 sq. feet
|
3 baths - beds |
show details | |

|
#17
Point Of Woods Dr
Palm Coast, FL 32164
|
1,192 sq. feet
|
2 baths - beds |
show details | |

|
#18
Robin Hood Ln
Palm Coast, FL 32164
|
1,254 sq. feet
|
2 baths - beds |
show details | |

|
#19
Zonal Geranium Ct
Palm Coast, FL 32164
|
2,824 sq. feet
|
4 baths - beds |
show details | |

|
#20
Cute Ct
Palm Coast, FL 32137
|
2,708 sq. feet
|
3 baths - beds |
show details |
| Photo | Address | Area | Beds / Baths | Price | Details |
|---|---|---|---|---|---|

|
#21
Evans Dr
Palm Coast, FL 32164
|
3,483 sq. feet
|
4 baths - beds |
show details | |

|
#22
Flower Hill Ln
Palm Coast, FL 32137
|
2,485 sq. feet
|
2 baths - beds |
show details | |

|
#23
Whippoorwill Dr
Palm Coast, FL 32164
|
1,440 sq. feet
|
2 baths - beds |
show details | |

|
#24
Farrington Ln
Palm Coast, FL 32137
|
1,791 sq. feet
|
2 baths - beds |
show details | |

|
#25
Birchshire Ln
Palm Coast, FL 32137
|
2,358 sq. feet
|
2 baths - beds |
show details | |

|
#26
Westmoreland Dr
Palm Coast, FL 32164
|
1,615 sq. feet
|
2 baths - beds |
show details | |

|
#27
Point Of Woods Dr
Palm Coast, FL 32164
|
2,679 sq. feet
|
2 baths - beds |
show details | |

|
#28
Slipper Flower Path E
Palm Coast, FL 32164
|
2,966 sq. feet
|
2 baths - beds |
show details | |

|
#29
Roxboro Dr
Palm Coast, FL 32164
|
1,387 sq. feet
|
2 baths - beds |
show details | |

|
#30
Pine Cottage Ln
Palm Coast, FL 32164
|
1,781 sq. feet
|
2 baths - beds |
show details |
| Photo | Address | Area | Beds / Baths | Price | Details |
|---|---|---|---|---|---|

|
#31
La Mancha Dr
Palm Coast, FL 32137
|
1,829 sq. feet
|
2 baths - beds |
show details | |

|
#32
E Diamond Dr
Palm Coast, FL 32164
|
2,101 sq. feet
|
2 baths - beds |
show details | |

|
#33
Pine Bush Ln
Palm Coast, FL 32164
|
2,227 sq. feet
|
2 baths - beds |
show details | |

|
#34
Red Barn Dr
Palm Coast, FL 32164
|
1,390 sq. feet
|
2 baths - beds |
show details | |

|
#35
Brewster Ln
Palm Coast, FL 32137
|
3,957 sq. feet
|
2 baths - beds |
show details | |

|
#36
Westfield Ln
Palm Coast, FL 32164
|
1,260 sq. feet
|
2 baths - beds |
show details | |

|
#37
Randolph Dr
Palm Coast, FL 32164
|
1,371 sq. feet
|
2 baths - beds |
show details | |

|
#38
Louisburg Ln
Palm Coast, FL 32137
|
2,010 sq. feet
|
2 baths - beds |
show details | |

|
#39
Brooklyn Ln
Palm Coast, FL 32137
|
2,036 sq. feet
|
2 baths - beds |
show details | |

|
#40
Riddle Dr
Palm Coast, FL 32164
|
2,938 sq. feet
|
2 baths - beds |
show details |
| Photo | Address | Area | Beds / Baths | Price | Details |
|---|---|---|---|---|---|

|
#41
Blare Castle Dr
Palm Coast, FL 32137
|
1,696 sq. feet
|
2 baths - beds |
show details | |

|
#42
Burroughs Dr
Palm Coast, FL 32137
|
2,402 sq. feet
|
3 baths - beds |
show details | |

|
#43
Round Tree Dr
Palm Coast, FL 32164
|
1,435 sq. feet
|
2 baths - beds |
show details | |

|
#44
Philmont Ln
Palm Coast, FL 32164
|
1,531 sq. feet
|
2 baths - beds |
show details | |

|
#45
Big Dipper Ln
Palm Coast, FL 32137
|
2,047 sq. feet
|
2 baths - beds |
show details | |

|
#46
Riverview Bnd S Unit 1733
Palm Coast, FL 32137
|
- sq. feet
|
2 baths 3 beds |
show details | |

|
#47
Woodfair Pl
Palm Coast, FL 32164
|
1,772 sq. feet
|
2 baths - beds |
show details | |

|
#48
Sellner Pl
Palm Coast, FL 32164
|
2,364 sq. feet
|
2 baths - beds |
show details | |

|
#49
President Ln
Palm Coast, FL 32164
|
2,051 sq. feet
|
2 baths - beds |
show details | |

|
Check over 1 million property listings on Foreclosure.com!
|
browse all offers | |||


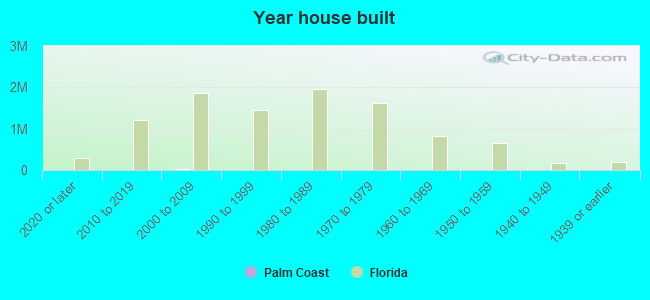
Median year apartment built: 2003
Household type by relationship:
Households: 98,411- Male householders: 20,774 (3,057 living alone), Female householders: 21,882 (6,056 living alone)
23,917 spouses (23,326 opposite-sex spouses), 2,761 unmarried partners, (2,539 opposite-sex unmarried partners), 20,860 children (19,761 natural, 240 adopted, 859 stepchildren), 2,134 grandchildren, 928 brothers or sisters, 1,675 parents, 0 foster children, 1,909 other relatives, 1,143 non-relatives
- In group quarters: 428
Size of family households: 18,392 2-persons, 6,267 3-persons, 4,378 4-persons, 1,328 5-persons, 877 6-persons, 64 7-or-more-persons.
Size of nonfamily households: 9,113 1-person, 2,237 2-persons.
9,464 married couples with children.
4,335 single-parent households (1,387 men, 2,948 women).
81.9% of residents of Palm Coast speak English at home.
8.3% of residents speak Spanish at home (60% speak English very well, 26% speak English well, 10% speak English not well, 4% don't speak English at all).
7.8% of residents speak other Indo-European language at home (43% speak English very well, 37% speak English well, 17% speak English not well, 3% don't speak English at all).
1.8% of residents speak Asian or Pacific Island language at home (55% speak English very well, 37% speak English well, 8% speak English not well).
0.4% of residents speak other language at home (40% speak English very well, 60% speak English well).
Foreign born population: 15,165 (15.4%)
(67.7% of them are naturalized citizens)
| Here: | 6.2 |
| State: | 5.9 |
| Here: | 5.3 |
| State: | 4.2 |
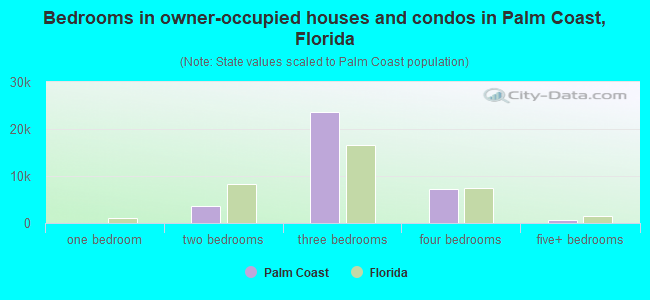
- Bedrooms in owner-occupied houses and condos in Palm Coast, Florida
- 53no bedroom
- 01 bedroom
- 3,6032 bedrooms
- 23,5523 bedrooms
- 7,2944 bedrooms
- 7035+ bedrooms
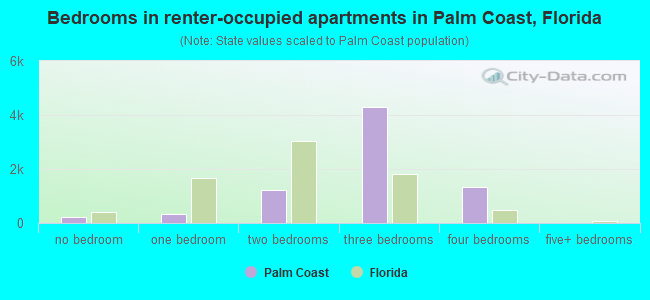
- Bedrooms in renter-occupied apartments in Palm Coast, Florida
- 240no bedroom
- 3191 bedroom
- 1,2402 bedrooms
- 4,3053 bedrooms
- 1,3474 bedrooms
- 05+ bedrooms
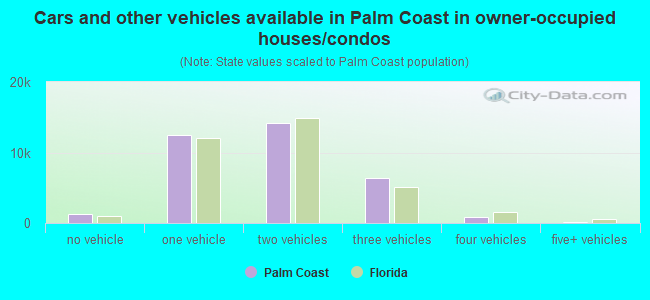
- Cars and other vehicles available in Palm Coast in owner-occupied houses/condos
- 1,303no vehicle
- 12,4441 vehicle
- 14,1732 vehicles
- 6,3993 vehicles
- 8084 vehicles
- 785+ vehicles
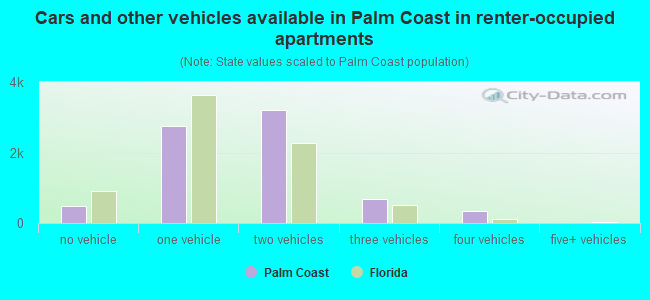
- Cars and other vehicles available in Palm Coast in renter-occupied apartments
- 493no vehicle
- 2,7461 vehicle
- 3,2062 vehicles
- 6733 vehicles
- 3334 vehicles
- 05+ vehicles
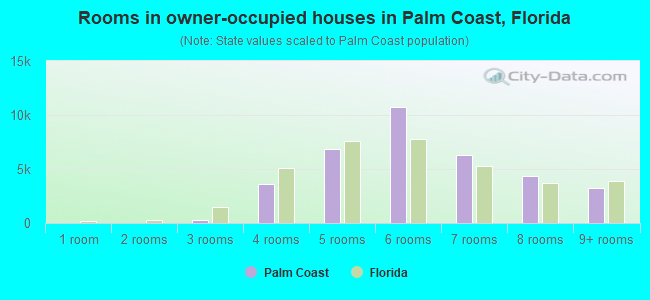
- Rooms in owner-occupied houses in Palm Coast, Florida
- 01 room
- 02 rooms
- 2433 rooms
- 3,5874 rooms
- 6,8165 rooms
- 10,6956 rooms
- 6,3167 rooms
- 4,3418 rooms
- 3,2079+ rooms
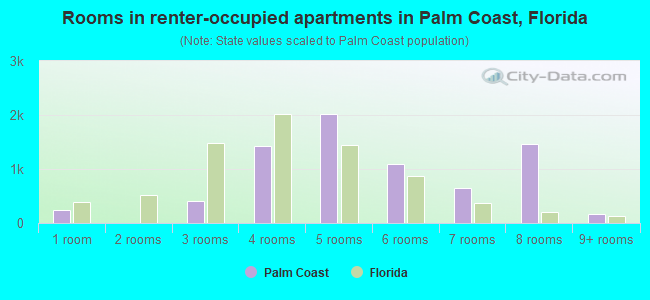
- Rooms in renter-occupied apartments in Palm Coast, Florida
- 2401 room
- 02 rooms
- 4043 rooms
- 1,4194 rooms
- 2,0165 rooms
- 1,0846 rooms
- 6577 rooms
- 1,4568 rooms
- 1759+ rooms
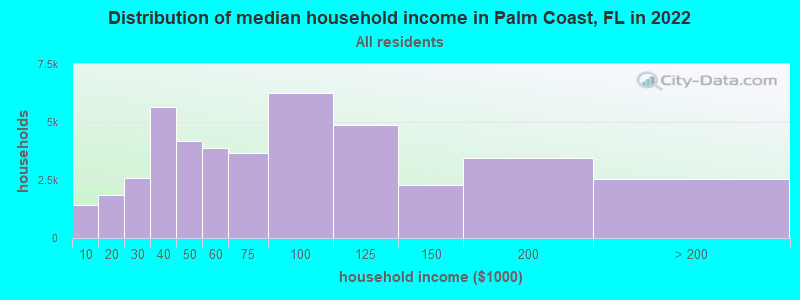
Palm Coast, FL household income distribution

- 1,439Less than $10,000
- 1,833$10,000 to $19,999
- 2,597$20,000 to $29,999
- 5,659$30,000 to $39,999
- 4,172$40,000 to $49,999
- 3,873$50,000 to $59,999
- 3,675$60,000 to $74,999
- 6,262$75,000 to $99,999
- 4,860$100,000 to $124,999
- 2,301$125,000 to $149,999
- 3,463$150,000 to $199,999
- 2,522$200,000 or more
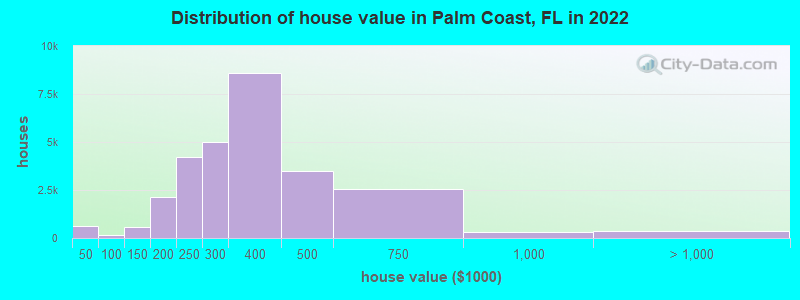
Home value of owner - occupied houses in 2022 in Palm Coast, FL
-
- 214Less than $10,000
- 58$10,000 to $14,999
- 15$15,000 to $19,999
- 63$20,000 to $24,999
- 92$25,000 to $29,999
- 101$30,000 to $34,999
- 50$35,000 to $39,999
- 53$40,000 to $49,999
- 59$70,000 to $79,999
- 13$80,000 to $89,999
- 47$90,000 to $99,999
- 287$100,000 to $124,999
- 281$125,000 to $149,999
- 824$150,000 to $174,999
- 1,286$175,000 to $199,999
- 4,235$200,000 to $249,999
- 5,005$250,000 to $299,999
- 8,611$300,000 to $399,999
- 3,511$400,000 to $499,999
- 2,560$500,000 to $749,999
- 307$750,000 to $999,999
- 207$1,000,000 to $1,499,999
- 20$1,500,000 to $1,999,999
- 149$2,000,000 or more
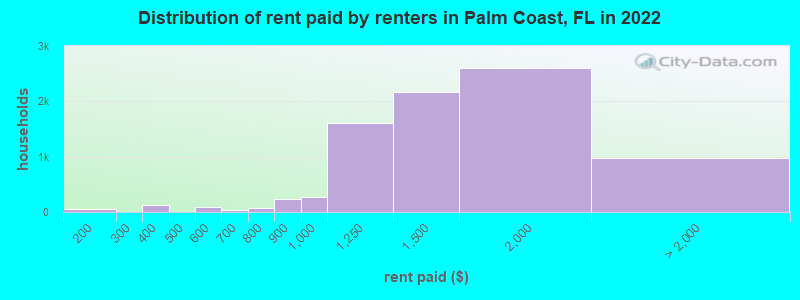
Rent paid by renters in 2022 in Palm Coast, FL
-
- 7Less than $100
- 60$150 to $199
- 80$300 to $349
- 54$350 to $399
- 52$500 to $549
- 41$550 to $599
- 18$600 to $649
- 9$650 to $699
- 47$700 to $749
- 29$750 to $799
- 240$800 to $899
- 268$900 to $999
- 1,616$1,000 to $1,249
- 2,173$1,250 to $1,499
- 2,608$1,500 to $1,999
- 659$2,000 to $2,499
- 17$2,500 to $2,999
- 92$3,000 to $3,499
- 204No cash rent
Percentage of workers working in this county: 63.8%
Number of people working at home: 7,045 (18.0% of all workers)
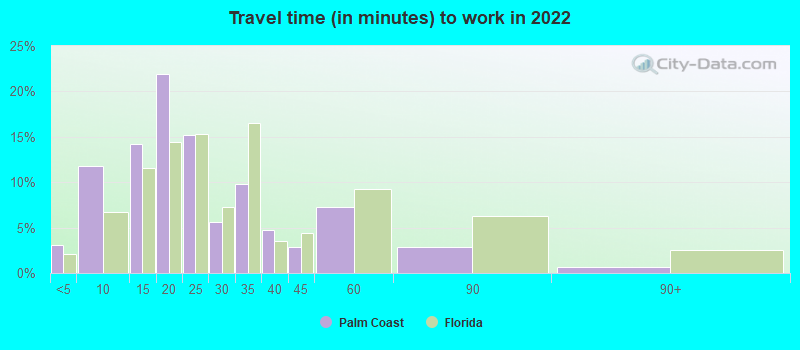
Travel time to work (commute)
- Less than 5 minutes: 621
- 5 to 9 minutes: 2,679
- 10 to 14 minutes: 2,957
- 15 to 19 minutes: 4,717
- 20 to 24 minutes: 3,587
- 25 to 29 minutes: 1,390
- 30 to 34 minutes: 4,612
- 35 to 39 minutes: 1,900
- 40 to 44 minutes: 2,017
- 45 to 59 minutes: 3,461
- 60 to 89 minutes: 2,028
- 90 or more minutes: 1,157
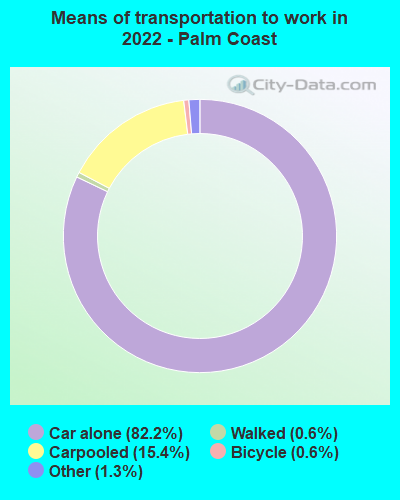
Means of transportation to work:
- Drove a car alone: 16,273 (62.1%)
- Carpooled: 3,240 (12.4%)
- Bus: 3 (0.0%)
- Subway or elevated rail: 5 (0.0%)
- Taxi: 278 (1.1%)
- Bicycle: 119 (0.5%)
- Walked: 118 (0.5%)
- Worked at home: 7,045 (26.9%)
- Unemployment by race in 2022
- Unemployment rate for White non-Hispanic residents
- 3.2%Males
- 3.0%Females
- Unemployment rate for Black residents
- 23.2%Males
- 6.9%Females
- Unemployment rate for American Indian and Alaska Native residents
- 100.0%Males
- Unemployment rate for Asian residents
- 2.8%Females
- Unemployment rate for other race residents
- 0.8%Males
- 5.0%Females
- Unemployment rate for two or more race residents
- 9.9%Males
- 8.8%Females
- Unemployment rate for Hispanic or Latino residents
- 2.9%Males
- 3.7%Females
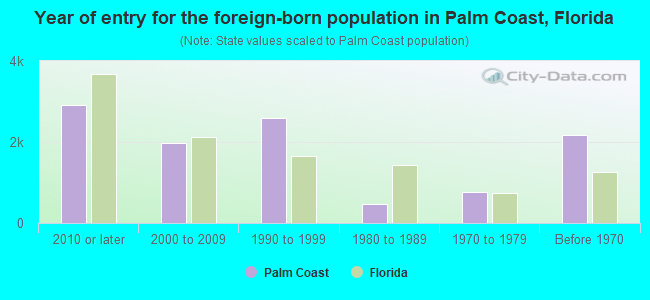
- Year of entry for the foreign-born population in Palm Coast, Florida
- 2,9032010 or later
- 1,9752000 to 2009
- 2,5811990 to 1999
- 4801980 to 1989
- 7611970 to 1979
- 2,170Before 1970
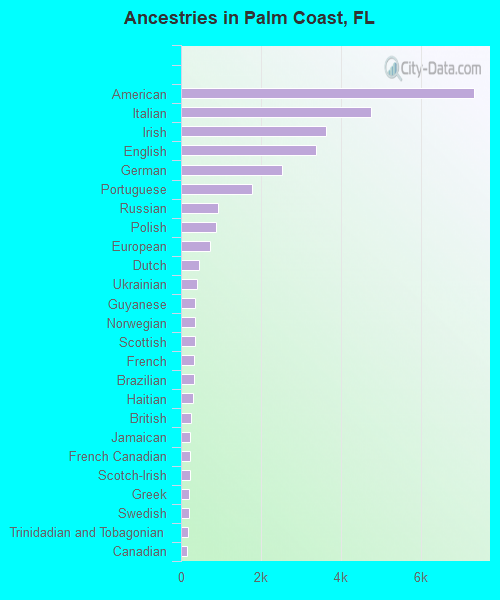
First ancestries reported:
- American: 7,342 (15.6%)
- Italian: 4,759 (10.1%)
- Irish: 3,640 (7.7%)
- English: 3,382 (7.2%)
- German: 2,532 (5.4%)
- Portuguese: 1,786 (3.8%)
- Russian: 923 (2.0%)
- Polish: 888 (1.9%)
- European: 727 (1.5%)
- Dutch: 449 (1.0%)
- Ukrainian: 390 (0.8%)
- Guyanese: 362 (0.8%)
- Norwegian: 359 (0.8%)
- Scottish: 345 (0.7%)
- French: 325 (0.7%)
- Brazilian: 316 (0.7%)
- Haitian: 309 (0.7%)
- British: 245 (0.5%)
- Jamaican: 232 (0.5%)
- French Canadian: 229 (0.5%)
- Scotch-Irish: 226 (0.5%)
- Greek: 212 (0.5%)
- Swedish: 199 (0.4%)
- Trinidadian and Tobagonian: 176 (0.4%)
- Canadian: 162 (0.3%)
- Northern European: 141 (0.3%)
- Slovak: 124 (0.3%)
- Lithuanian: 107 (0.2%)
- Welsh: 85 (0.2%)
- Czech: 81 (0.2%)
- Syrian: 79 (0.2%)
- Yugoslavian: 78 (0.2%)
- African: 75 (0.2%)
- Soviet Union: 66 (0.1%)
- Hungarian: 62 (0.1%)
- Czechoslovakian: 56 (0.1%)
- Eastern European: 53 (0.1%)
- Swiss: 46 (0.10%)
- Albanian: 38 (0.08%)
- Danish: 36 (0.08%)
- Latvian: 35 (0.07%)
- Iranian: 31 (0.07%)
- Pennsylvania German: 30 (0.06%)
- Croatian: 30 (0.06%)
- Armenian: 24 (0.05%)
- Egyptian: 24 (0.05%)
- Scandinavian: 23 (0.05%)
- Cape Verdean: 20 (0.04%)
- Australian: 19 (0.04%)
- Luxembourger: 17 (0.04%)
- Arab: 15 (0.03%)
- Nigerian: 14 (0.03%)
- Turkish: 12 (0.03%)
- West Indian: 11 (0.02%)
- Austrian: 10 (0.02%)
- Belizean: 9 (0.02%)
- Finnish: 7 (0.01%)
- Romanian: 6 (0.01%)
- Slovene: 3 (0.01%)
Most common places of birth for foreign-born residents (%):
| Palm Coast: | 7.3% (1,024) |
| Florida: | 0.2% (9,493) |
| Palm Coast: | 6.4% (895) |
| Florida: | 6.5% (298,669) |
| Palm Coast: | 5.9% (826) |
| Florida: | 1.8% (84,403) |
| Palm Coast: | 5.6% (793) |
| Florida: | 2.7% (122,906) |
| Palm Coast: | 5.0% (704) |
| Florida: | 0.7% (31,076) |
| Palm Coast: | 4.4% (614) |
| Florida: | 1.2% (54,272) |
| Palm Coast: | 4.3% (608) |
| Florida: | 0.5% (21,886) |
| Palm Coast: | 4.3% (600) |
| Florida: | 0.7% (33,556) |
| Palm Coast: | 4.2% (594) |
| Florida: | 2.1% (96,693) |
| Palm Coast: | 3.5% (496) |
| Florida: | 22.0% (1,006,576) |
| Palm Coast: | 3.5% (489) |
| Florida: | 7.5% (342,375) |
| Palm Coast: | 2.9% (408) |
| Florida: | 0.6% (25,219) |
| Palm Coast: | 2.9% (406) |
| Florida: | 1.1% (49,838) |
| Palm Coast: | 2.6% (371) |
| Florida: | 2.4% (109,132) |
| Palm Coast: | 2.6% (369) |
| Florida: | 5.0% (227,319) |
| Palm Coast: | 2.2% (312) |
| Florida: | 0.1% (3,402) |
| Palm Coast: | 2.1% (290) |
| Florida: | 5.6% (257,152) |
| Palm Coast: | 2.0% (288) |
| Florida: | 1.0% (43,642) |
| Palm Coast: | 1.9% (273) |
| Florida: | 0.3% (12,303) |
| Palm Coast: | 1.9% (268) |
| Florida: | 0.7% (30,755) |
| Palm Coast: | 1.5% (215) |
| Florida: | 0.0% (1,005) |
Place of birth for U.S.-born residents:
- This state: 20,857
- Other state: 59,811
- Northeast: 32,780
- Midwest: 8,869
- South: 12,751
- West: 5,411
85.3% of Palm Coast residents lived in the same house 1 years ago.
Out of people who lived in different houses, 28.1% lived in this county.
Out of people who lived in different counties, 30.0% lived in Florida.
| Palm Coast: | 85.3% |
| State average: | 86.3% |
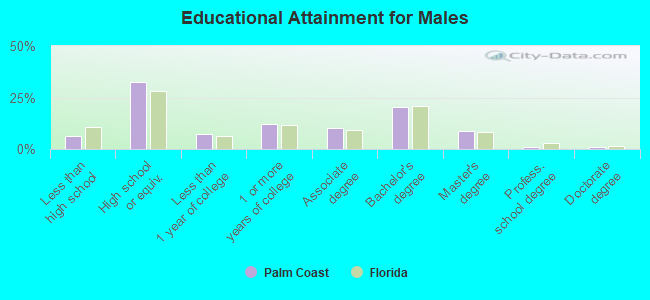
Education attainment for males 25 years and older:
- No schooling: 830
- Nursery to 4th grade: 0
- 5th and 6th grade: 0
- 7th and 8th grade: 198
- 9th grade: 46
- 10th grade: 379
- 11th grade: 252
- 12th grade, no diploma: 685
- High school graduate (or equivalency): 12,079
- Less than 1 year of college: 2,765
- Some college more than 1 year, no degree: 4,502
- Associate degree: 3,691
- Bachelor's degree: 7,590
- Master's degree: 3,327
- Professional school degree: 363
- Doctorate degree: 361
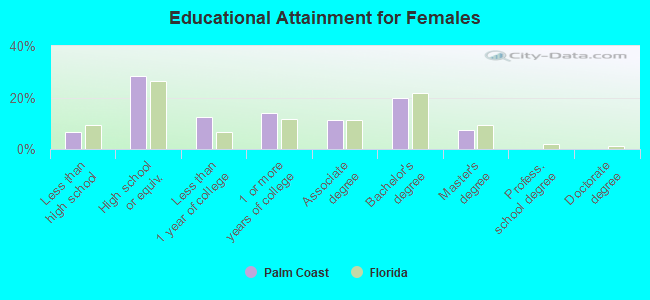
Education attainment for females 25 years and older:
- No schooling: 837
- Nursery to 4th grade: 0
- 5th and 6th grade: 183
- 7th and 8th grade: 80
- 9th grade: 16
- 10th grade: 581
- 11th grade: 104
- 12th grade, no diploma: 840
- High school graduate (or equivalency): 11,413
- Less than 1 year of college: 4,953
- Some college more than 1 year, no degree: 5,556
- Associate degree: 4,567
- Bachelor's degree: 8,014
- Master's degree: 3,031
- Professional school degree: 71
- Doctorate degree: 31
Housing units in structures:
- One, detached: 38,712
- One, attached: 2,157
- Two: 951
- 3 or 4: 1,007
- 5 to 9: 570
- 10 to 19: 986
- 20 to 49: 641
- 50 or more: 832
- Mobile homes: 170
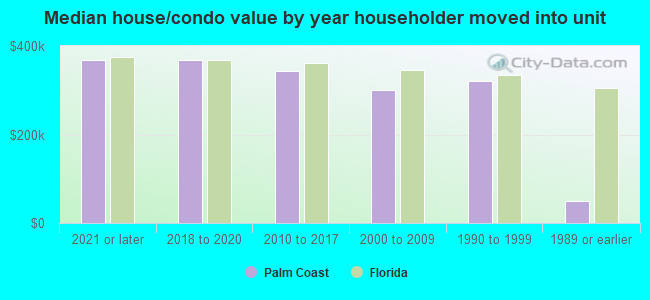
House/condo owner moved in on average 8 years ago
Renter moved in on average 0 years ago
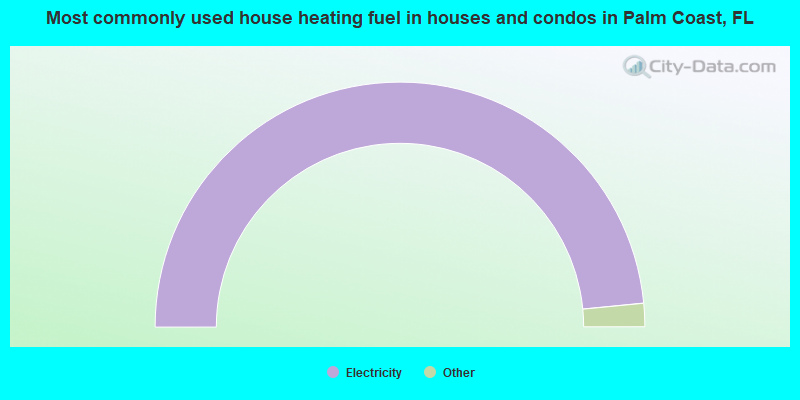
- 96.9%Electricity
- 1.1%Utility gas
- 1.0%No fuel used
- 0.4%Solar energy
- 0.3%Bottled, tank, or LP gas
- 0.2%Other fuel
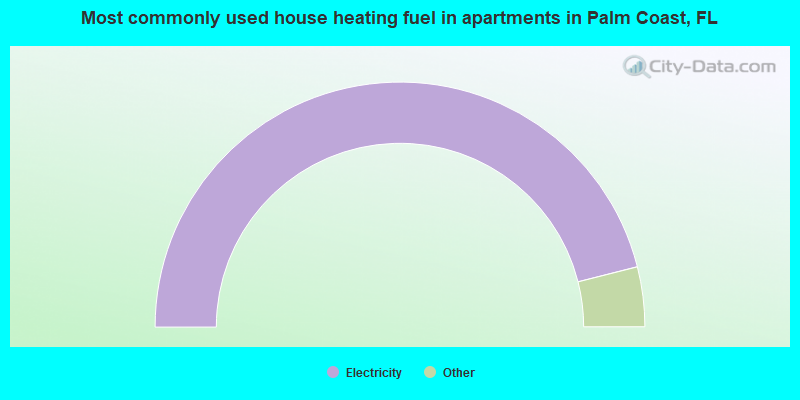
- 92.1%Electricity
- 3.8%Utility gas
- 3.0%Other fuel
- 0.9%No fuel used
- 0.3%Bottled, tank, or LP gas
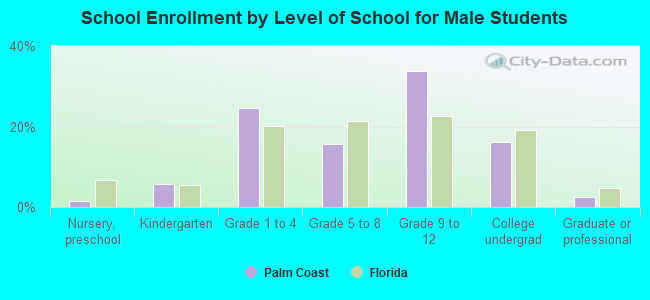
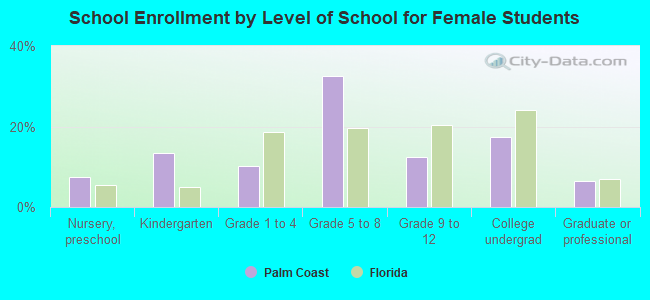
Private vs. public school enrollment:
| Here: | 19.2% |
| Florida: | 15.8% |
| Here: | 11.5% |
| Florida: | 12.9% |
| Here: | 18.0% |
| Florida: | 23.6% |