Housing density: 397 houses/condos per square mile
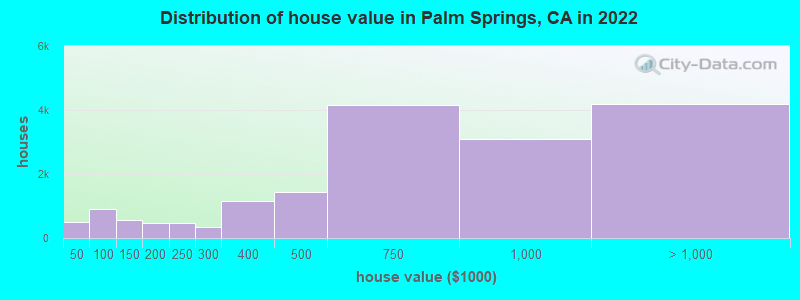
Median price asked for vacant for-sale houses and condos in 2022: $611,907.
Median contract rent in 2022: $1,282 (lower quartile is $985, upper quartile is $1,721)
Median rent asked for vacant for-rent units in 2022: $3,308
Median gross rent in Palm Springs, CA in 2022: $1,439
Housing units in Palm Springs with a mortgage: 8,093 (519 second mortgage, 24 home equity loan, 486 both second mortgage and home equity loan) Houses without a mortgage: 177
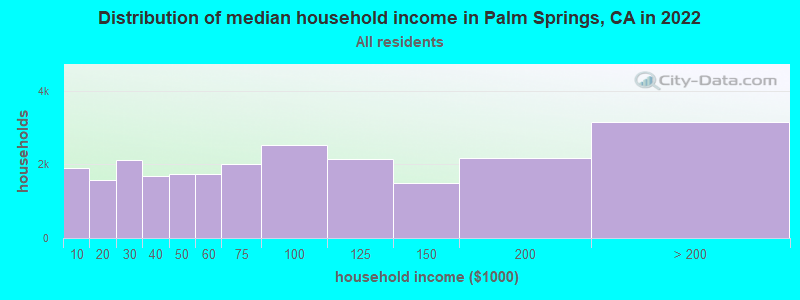
Median household income for houses/condos with a mortgage: $121,177
Median household income for apartments without a mortgage: $64,716
1,683 married couples with children.
1,470 single-parent households (292 men, 1,178 women).
76.8% of residents of Palm Springs speak English at home.
16.3% of residents speak Spanish at home (69% speak English very well, 19% speak English well, 9% speak English not well, 3% don't speak English at all).
3.7% of residents speak other Indo-European language at home (87% speak English very well, 11% speak English well, 1% speak English not well, 1% don't speak English at all).
2.8% of residents speak Asian or Pacific Island language at home (54% speak English very well, 31% speak English well, 13% speak English not well, 2% don't speak English at all).
0.8% of residents speak other language at home (75% speak English very well, 23% speak English well, 2% speak English not well).
Foreign born population: 8,406 (18.4%)
(58.0% of them are naturalized citizens)
Percentage of workers working in this county: 92.8% Number of people working at home: 5,819 (29.0% of all workers)
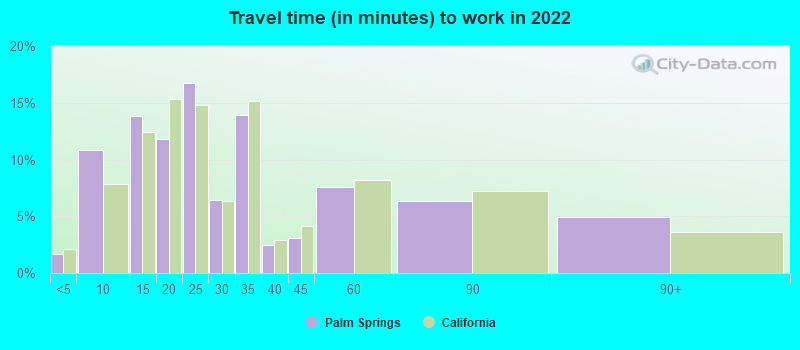
Travel time to work (commute)
Less than 5 minutes: 533
5 to 9 minutes: 2,836
10 to 14 minutes: 2,830
15 to 19 minutes: 1,912
20 to 24 minutes: 1,970
25 to 29 minutes: 898
30 to 34 minutes: 1,722
35 to 39 minutes: 290
40 to 44 minutes: 297
45 to 59 minutes: 572
60 to 89 minutes: 524
90 or more minutes: 534
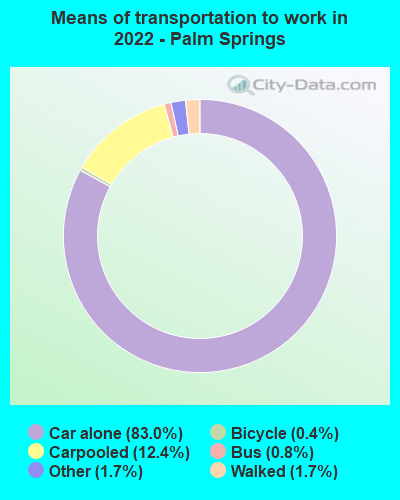
Means of transportation to work:
Drove a car alone: 28,726 (70.5%)
Carpooled: 4,650 (11.4%)
Bus: 260 (0.6%)
Subway or elevated rail: 2 (0.0%)
Taxi: 617 (1.5%)
Bicycle: 174 (0.4%)
Walked: 570 (1.4%)
Worked at home: 5,819 (14.3%)
Unemployment by race in 2022
Unemployment rate for White non-Hispanic residents
7.6%Males
8.0%Females
Unemployment rate for Black residents
2.0%Males
18.2%Females
Unemployment rate for American Indian and Alaska Native residents
23.4%Males
Unemployment rate for Asian residents
2.7%Males
1.8%Females
Unemployment rate for other race residents
1.2%Males
1.6%Females
Unemployment rate for two or more race residents
6.5%Males
5.8%Females
Unemployment rate for Hispanic or Latino residents
4.4%Males
5.1%Females
Year of entry for the foreign-born population in Palm Springs, California
1,5742010 or later
1,8192000 to 2009
1,5251990 to 1999
2,5541980 to 1989
1,1451970 to 1979
2,163Before 1970
First ancestries reported:
English: 2,142 (8.5%)
German: 1,500 (5.9%)
Irish: 1,209 (4.8%)
Italian: 1,111 (4.4%)
American: 869 (3.4%)
African: 591 (2.3%)
Eastern European: 561 (2.2%)
European: 529 (2.1%)
Scottish: 392 (1.5%)
French: 344 (1.4%)
British: 333 (1.3%)
Polish: 319 (1.3%)
Russian: 231 (0.9%)
Norwegian: 215 (0.8%)
Bulgarian: 163 (0.6%)
Scotch-Irish: 143 (0.6%)
Canadian: 134 (0.5%)
Swedish: 124 (0.5%)
Hungarian: 121 (0.5%)
French Canadian: 117 (0.5%)
Armenian: 111 (0.4%)
Dutch: 109 (0.4%)
Iranian: 109 (0.4%)
Assyrian: 107 (0.4%)
Northern European: 106 (0.4%)
Belgian: 102 (0.4%)
Scandinavian: 101 (0.4%)
Danish: 87 (0.3%)
Ukrainian: 86 (0.3%)
Romanian: 77 (0.3%)
Portuguese: 73 (0.3%)
Austrian: 72 (0.3%)
Greek: 71 (0.3%)
Croatian: 50 (0.2%)
Nigerian: 42 (0.2%)
Swiss: 39 (0.2%)
Egyptian: 37 (0.1%)
Lithuanian: 34 (0.1%)
Jamaican: 33 (0.1%)
Slavic: 32 (0.1%)
Welsh: 31 (0.1%)
Israeli: 29 (0.1%)
Lebanese: 27 (0.1%)
Finnish: 25 (0.10%)
Syrian: 25 (0.10%)
Serbian: 24 (0.09%)
Turkish: 20 (0.08%)
Slovak: 19 (0.07%)
Czech: 18 (0.07%)
Australian: 14 (0.06%)
Yugoslavian: 12 (0.05%)
Afghan: 9 (0.04%)
Moroccan: 8 (0.03%)
Jordanian: 7 (0.03%)
Belizean: 7 (0.03%)
Brazilian: 6 (0.02%)
Slovene: 5 (0.02%)
Czechoslovakian: 5 (0.02%)
Pennsylvania German: 4 (0.02%)
Cape Verdean: 3 (0.01%)
Celtic: 3 (0.01%)
Arab: 3 (0.01%)
Maltese: 2 (0.01%)
Soviet Union: 2 (0.01%)
Icelander: 2 (0.01%)
Alsatian: 2 (0.01%)
Barbadian: 2 (0.01%)
Basque: 2 (0.01%)
Most common places of birth for foreign-born residents (%):
Mexico
Palm Springs:
35.3% (2,967)
California:
37.2% (3,881,193)
Canada
Palm Springs:
9.9% (832)
California:
1.2% (127,477)
Philippines
Palm Springs:
8.7% (733)
California:
7.8% (818,297)
United Kingdom, excluding England and Scotland
Palm Springs:
2.7% (227)
California:
0.6% (60,582)
Iran
Palm Springs:
2.4% (202)
California:
2.0% (206,004)
El Salvador
Palm Springs:
2.4% (199)
California:
4.2% (440,287)
Germany
Palm Springs:
2.0% (166)
California:
0.7% (73,304)
Bulgaria
Palm Springs:
1.8% (150)
California:
0.1% (9,442)
Place of birth for U.S.-born residents:
This state: 18,170
Other state: 17,494
Northeast: 4,410
Midwest: 6,760
South: 3,468
West: 2,900
85.8% of Palm Springs residents lived in the same house 1 years ago. Out of people who lived in different houses, 32.4% lived in this county. Out of people who lived in different counties, 61.8% lived in California.
Palm Springs:
85.8%
State average:
88.9%
Education attainment for males 25 years and older:
No schooling: 301
Nursery to 4th grade: 62
5th and 6th grade: 220
7th and 8th grade: 52
9th grade: 371
10th grade: 106
11th grade: 152
12th grade, no diploma: 511
High school graduate (or equivalency): 3,413
Less than 1 year of college: 1,619
Some college more than 1 year, no degree: 3,816
Associate degree: 1,925
Bachelor's degree: 6,865
Master's degree: 3,278
Professional school degree: 1,437
Doctorate degree: 583
Education attainment for females 25 years and older:
No schooling: 118
Nursery to 4th grade: 77
5th and 6th grade: 155
7th and 8th grade: 101
9th grade: 76
10th grade: 234
11th grade: 111
12th grade, no diploma: 314
High school graduate (or equivalency): 3,176
Less than 1 year of college: 1,338
Some college more than 1 year, no degree: 2,440
Associate degree: 1,234
Bachelor's degree: 3,436
Master's degree: 1,876
Professional school degree: 336
Doctorate degree: 417
Housing units in structures:
One, detached: 14,616
One, attached: 4,973
Two: 1,050
3 or 4: 3,519
5 to 9: 4,067
10 to 19: 3,132
20 to 49: 1,717
50 or more: 2,261
Mobile homes: 2,041
Boats, RVs, vans, etc.: 24
Median worth of mobile homes: $114,836
Housing units lacking complete plumbing facilities in 2022: 0.5%
Housing units lacking complete kitchen facilities in 2022: 1.7%