Palm Valley, FL (Florida) Houses and Residents
Estimated median house or condo value in 2022: $712,378 (it was $244,400 in 2000 )
Palm Valley:
$712,378Florida:
$354,100
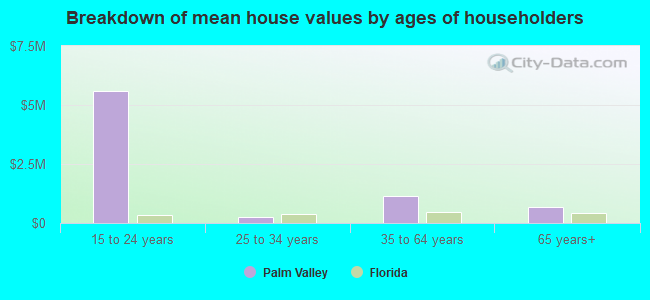
Lower value quartile - upper value quartile: $436,686 - $1,064,349Mean price in 2022: Detached houses: $1,082,905 Here:
$1,082,905State:
$500,941
Townhouses or other attached units: $346,457 Here:
$346,457State:
$370,869
In 3-to-4-unit structures: $283,843 Here:
$283,843State:
$309,944
In 5-or-more-unit structures: $341,995 Here:
$341,995State:
$447,145
Mobile homes: $2,351,229 Here:
$2,351,229State:
$113,202
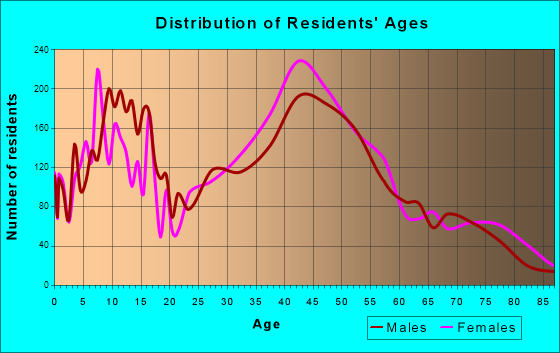
Total population: 20,019 (Urban population: 19,837, Rural population: 16 (all nonfarm) )
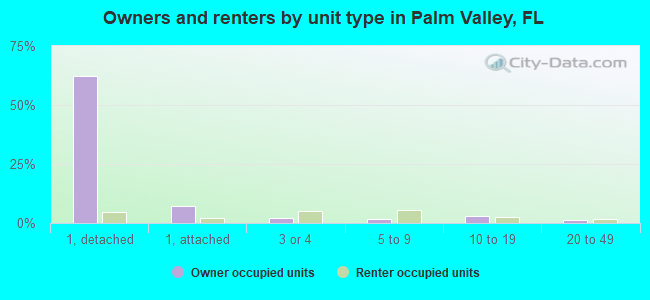
Houses: 10,533 (9,256 occupied: 7,938 owner occupied, 1,883 renter occupied )
% of renters here:
19%State:
33%
Housing density: 785 houses/condos per square mile
Median price asked for vacant for-sale houses and condos in 2022: $511,918.
Median contract rent in 2022: $1,539 (lower quartile is $1,436, upper quartile is over $2,000)
Median rent asked for vacant for-rent units in 2022: $1,573
Median gross rent in Palm Valley, FL in 2022: $1,795
Housing units in Palm Valley with a mortgage: 4,848 (621 second mortgage, 4 home equity loan, 616 both second mortgage and home equity loan )Houses without a mortgage: 111
Median household income for houses/condos with a mortgage: $133,387
Median household income for apartments without a mortgage: $120,790
Median monthly housing costs: $1,697
Data:
Median house or condo value ($)
Median house or condo value ($ change since 2000)
Median house or condo value ($) - White
Median house or condo value ($) - Black or African American
Median house or condo value ($) - Asian
Median house or condo value ($) - Hispanic or Latino
Median house or condo value ($) - American Indian and Alaska Native
Median house or condo value ($) - Multirace
Median house or condo value ($) - Other Race
Median price asked for mobile homes ($)
Household density (households per square mile)
Mean house or condo value by units in structure - 1, detached ($)
Mean house or condo value by units in structure - 1, attached ($)
Mean house or condo value by units in structure - 2 ($)
Mean house or condo value by units in structure by units in structure - 3 or 4 ($)
Mean house or condo value by units in structure - 5 or more ($)
Mean house or condo value by units in structure - Boat, RV, van, etc. ($)
Mean house or condo value by units in structure - Mobile home ($)
Median contract rent ($)
Median contract rent - Lower quartile ($)
Median contract rent - Upper quartile ($)
Median gross rent ($)
Urban houses (%)
Rural houses (%)
Houses occupied (%)
Houses occupied (% change since 2000)
Houses owner occupied (%)
Houses owner occupied (% change since 2000)
Houses renter occupied (%)
Houses renter occupied (% change since 2000)
Vacant housing units - For rent (%)
Vacant housing units - For rent (% change since 2000)
Vacant housing units - For sale only (%)
Vacant housing units - For sale only (% change since 2000)
Vacant housing units - Rented or sold, not occupied (%)
Vacant housing units - Rented or sold, not occupied (% change since 2000)
Vacant housing units - For seasonal, recreational, or occasional use (%)
Vacant housing units - For seasonal, recreational, or occasional use (% change since 2000)
Vacant housing units - For migrant workers (%)
Vacant housing units - For migrant workers (% change since 2000)
Vacant housing units - Other vacant (%)
Vacant housing units - Other vacant (% change since 2000)
Median monthly housing costs ($)
Median household income for houses/condos with a mortgage ($)
Median household income for houses/condos without a mortgage ($)
Median household income ($)
Median household income ($) - White
Median household income ($) - Black or African American
Median household income ($) - Asian
Median household income ($) - Hispanic or Latino
Median household income ($) - American Indian and Alaska Native
Median household income ($) - Multirace
Median household income ($) - Other Race
Mortgage status - with mortgage (%)
Mortgage status - with second mortgage (%)
Mortgage status - with home equity loan (%)
Mortgage status - with both second mortgage and home equity loan (%)
Mortgage status - without a mortgage (%)
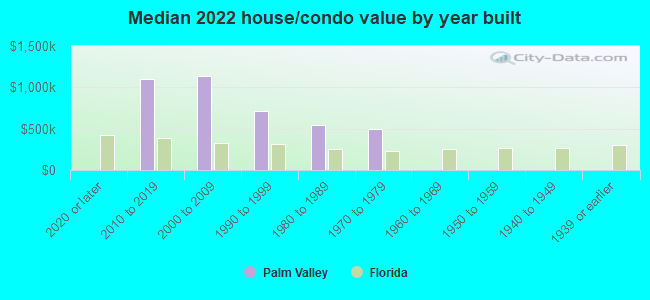
Median year house/condo built
Median year apartment built
Household type by relationship - Male householder living alone (%)
Household type by relationship - Male householder not living alone (%)
Household type by relationship - Female householder living alone (%)
Household type by relationship - Female householder not living alone (%)
Household type by relationship - Opposite-Sex spouse (%)
Household type by relationship - Same-Sex spouse (%)
Household type by relationship - Opposite-Sex unmarried partner (%)
Household type by relationship - Same-Sex unmarried partner (%)
Household type by relationship - In group quarters (%)
Size of family households - 2-person household (%)
Size of family households - 3-person household (%)
Size of family households - 4-person household (%)
Size of family households - 5-person household (%)
Size of family households - 6-person household (%)
Size of family households - 7-or-more-person household (%)
Size of nonfamily households - 1-person household (%)
Size of nonfamily households - 2-person household (%)
Size of nonfamily households - 3-person household (%)
Size of nonfamily households - 4-person household (%)
Size of nonfamily households - 5-person household (%)
Size of nonfamily households - 6-person household (%)
Size of nonfamily households - 7-or-moreperson household (%)
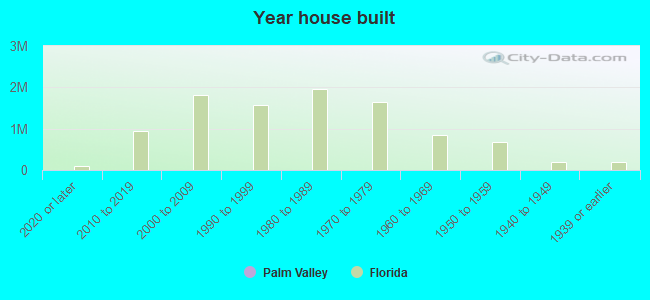
Year house built - Built 2010 or later (%)
Year house built - Built 2000 to 2009 (%)
Year house built - Built 1990 to 1999 (%)
Year house built - Built 1980 to 1989 (%)
Year house built - Built 1970 to 1979 (%)
Year house built - Built 1960 to 1969 (%)
Year house built - Built 1950 to 1959 (%)
Year house built - Built 1940 to 1949 (%)
Year house built - Built 1939 or earlier (%)
Median number of rooms in houses and condos
Median number of rooms in apartments
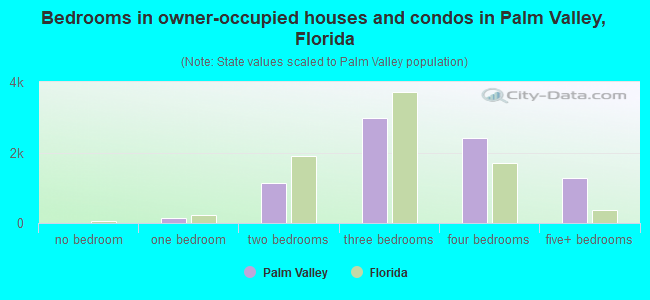
Median number of bedrooms in owner occupied houses
Mean number of bedrooms in owner occupied houses
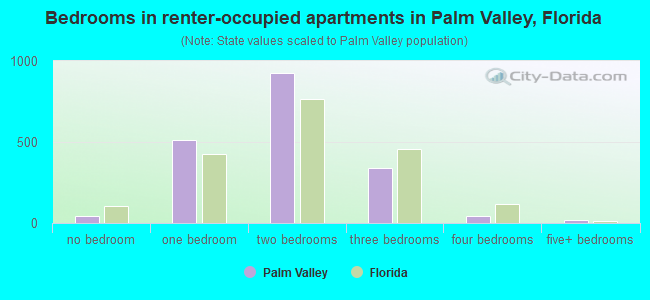
Median number of bedrooms in renter occupied houses
Mean number of bedrooms in renter occupied houses
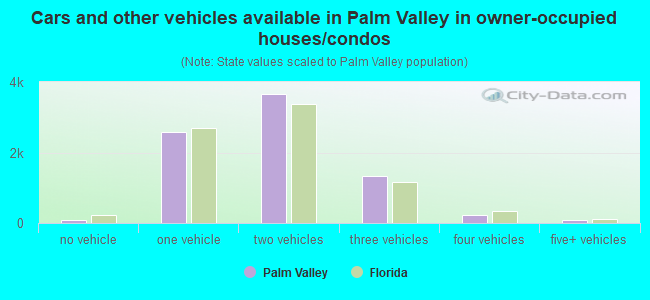
Median number of vehichles in owner occupied houses
Mean number of vehichles in owner occupied houses
Median number of vehichles in renter occupied houses
Mean number of vehichles in renter occupied houses
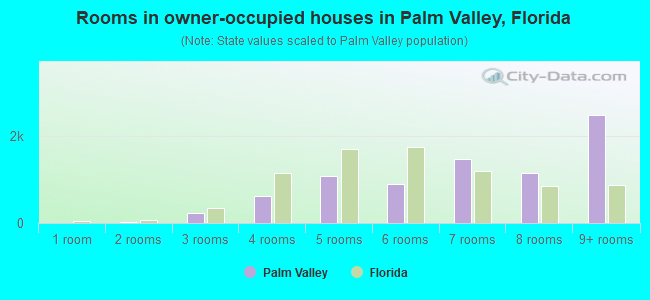
Rooms in owner-occupied houses - 1 room (%)
Rooms in owner-occupied houses - 2 rooms (%)
Rooms in owner-occupied houses - 3 rooms (%)
Rooms in owner-occupied houses - 4 rooms (%)
Rooms in owner-occupied houses - 5 rooms (%)
Rooms in owner-occupied houses - 6 rooms (%)
Rooms in owner-occupied houses - 7 rooms (%)
Rooms in owner-occupied houses - 8 rooms (%)
Rooms in owner-occupied houses - 9+ rooms (%)
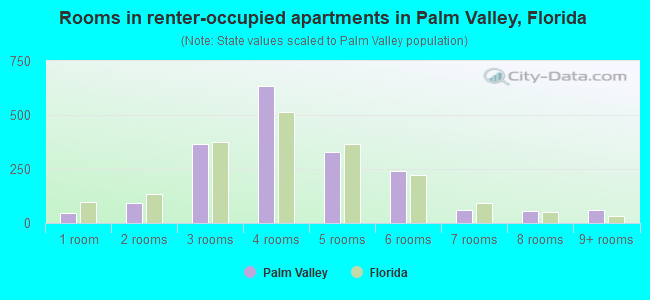
Rooms in renter-occupied houses - 1 room (%)
Rooms in renter-occupied houses - 2 rooms (%)
Rooms in renter-occupied houses - 3 rooms (%)
Rooms in renter-occupied houses - 4 rooms (%)
Rooms in renter-occupied houses - 5 rooms (%)
Rooms in renter-occupied houses - 6 rooms (%)
Rooms in renter-occupied houses - 7 rooms (%)
Rooms in renter-occupied houses - 8 rooms (%)
Rooms in renter-occupied houses - 9+ rooms (%)
Bedrooms in owner-occupied houses - no bedrooms (%)
Bedrooms in owner-occupied houses - 1 bedroom (%)
Bedrooms in owner-occupied houses - 2 bedrooms (%)
Bedrooms in owner-occupied houses - 3 bedrooms (%)
Bedrooms in owner-occupied houses - 4 bedrooms (%)
Bedrooms in owner-occupied houses - 5+ bedrooms (%)
Bedrooms in renter-occupied houses - no bedrooms (%)
Bedrooms in renter-occupied houses - 1 bedroom (%)
Bedrooms in renter-occupied houses - 2 bedrooms (%)
Bedrooms in renter-occupied houses - 3 bedrooms (%)
Bedrooms in renter-occupied houses - 4 bedrooms (%)
Bedrooms in renter-occupied houses - 5+ bedrooms (%)
Vehicles available in owner-occupied houses - no vehicle available (%)
Vehicles available in owner-occupied houses - 1 vehicle available(%)
Vehicles available in owner-occupied houses - 2 Vehicles available (%)
Vehicles available in owner-occupied houses - 3 Vehicles available (%)
Vehicles available in owner-occupied houses - 4 Vehicles available (%)
Vehicles available in owner-occupied houses - 5+ Vehicles available (%)
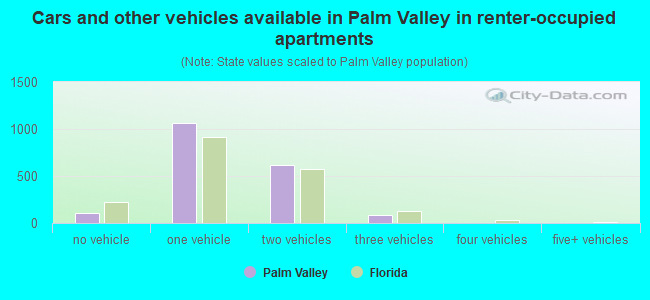
Vehicles available in renter-occupied houses - no vehicle available (%)
Vehicles available in renter-occupied houses - 1 vehicle available (%)
Vehicles available in renter-occupied houses - 2 Vehicles available (%)
Vehicles available in renter-occupied houses - 3 Vehicles available (%)
Vehicles available in renter-occupied houses - 4 Vehicles available (%)
Vehicles available in renter-occupied houses - 5+ Vehicles available (%)
Housing units in structures - 1, detached (%)
Housing units in structures - 1, attached (%)
Housing units in structures - 2 (%)
Housing units in structures - 3 or 4 (%)
Housing units in structures - 5 to 9 (%)
Housing units in structures - 10 to 19 (%)
Housing units in structures - 20 to 49 (%)
Housing units in structures - 50 or more (%)
Housing units in structures - Mobile home (%)
Housing units in structures - Boat, RV, van, etc. (%)
Housing units in structures - Owners - 1, detached (%)
Housing units in structures - Owners - 1, attached (%)
Housing units in structures - Owners - 2 (%)
Housing units in structures - Owners - 3 or 4 (%)
Housing units in structures - Owners - 5 to 9 (%)
Housing units in structures - Owners - 10 to 19 (%)
Housing units in structures - Owners - 20 to 49 (%)
Housing units in structures - Owners - 50 or more (%)
Housing units in structures - Owners - Mobile home (%)
Housing units in structures - Owners - Boat, RV, van, etc. (%)
Housing units in structures - Renters - 1, detached (%)
Housing units in structures - Renters - 1, attached (%)
Housing units in structures - Renters - 2 (%)
Housing units in structures - Renters - 3 or 4 (%)
Housing units in structures - Renters - 5 to 9 (%)
Housing units in structures - Renters - 10 to 19 (%)
Housing units in structures - Renters - 20 to 49 (%)
Housing units in structures - Renters - 50 or more (%)
Housing units in structures - Renters - Mobile home (%)
Housing units in structures - Renters - Boat, RV, van, etc. (%)
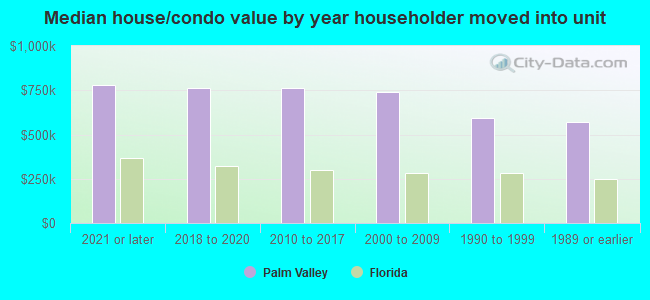
House/condo owner moved in on average (years ago)
Renter moved in on average (years ago)
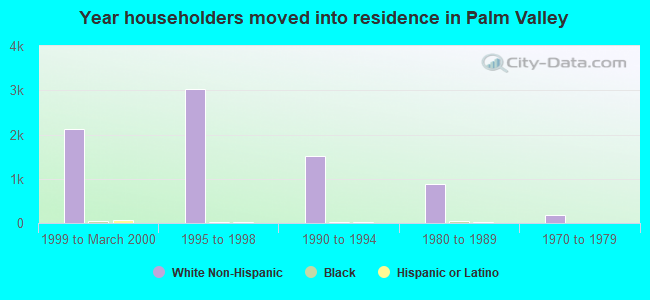
Year householder moved into unit - Moved in 1999 to March 2000 (%)
Year householder moved into unit - Moved in 1999 to March 2000 (%) - White
Year householder moved into unit - Moved in 1999 to March 2000 (%) - Black or African American
Year householder moved into unit - Moved in 1999 to March 2000 (%) - Asian
Year householder moved into unit - Moved in 1999 to March 2000 (%) - Hispanic or Latino
Year householder moved into unit - Moved in 1999 to March 2000 (%) - American Indian and Alaska Native
Year householder moved into unit - Moved in 1999 to March 2000 (%) - Multirace
Year householder moved into unit - Moved in 1999 to March 2000 (%) - Other Race
Year householder moved into unit - Moved in 1995 to 1998 (%)
Year householder moved into unit - Moved in 1995 to 1998 (%) - White
Year householder moved into unit - Moved in 1995 to 1998 (%) - Black or African American
Year householder moved into unit - Moved in 1995 to 1998 (%) - Asian
Year householder moved into unit - Moved in 1995 to 1998 (%) - Hispanic or Latino
Year householder moved into unit - Moved in 1995 to 1998 (%) - American Indian and Alaska Native
Year householder moved into unit - Moved in 1995 to 1998 (%) - Multirace
Year householder moved into unit - Moved in 1995 to 1998 (%) - Other Race
Year householder moved into unit - Moved in 1990 to 1994 (%)
Year householder moved into unit - Moved in 1990 to 1994 (%) - White
Year householder moved into unit - Moved in 1990 to 1994 (%) - Black or African American
Year householder moved into unit - Moved in 1990 to 1994 (%) - Asian
Year householder moved into unit - Moved in 1990 to 1994 (%) - Hispanic or Latino
Year householder moved into unit - Moved in 1990 to 1994 (%) - American Indian and Alaska Native
Year householder moved into unit - Moved in 1990 to 1994 (%) - Multirace
Year householder moved into unit - Moved in 1990 to 1994 (%) - Other Race
Year householder moved into unit - Moved in 1980 to 1989 (%)
Year householder moved into unit - Moved in 1980 to 1989 (%) - White
Year householder moved into unit - Moved in 1980 to 1989 (%) - Black or African American
Year householder moved into unit - Moved in 1980 to 1989 (%) - Asian
Year householder moved into unit - Moved in 1980 to 1989 (%) - Hispanic or Latino
Year householder moved into unit - Moved in 1980 to 1989 (%) - American Indian and Alaska Native
Year householder moved into unit - Moved in 1980 to 1989 (%) - Multirace
Year householder moved into unit - Moved in 1980 to 1989 (%) - Other Race
Year householder moved into unit - Moved in 1970 to 1979 (%)
Year householder moved into unit - Moved in 1970 to 1979 (%) - White
Year householder moved into unit - Moved in 1970 to 1979 (%) - Black or African American
Year householder moved into unit - Moved in 1970 to 1979 (%) - Asian
Year householder moved into unit - Moved in 1970 to 1979 (%) - Hispanic or Latino
Year householder moved into unit - Moved in 1970 to 1979 (%) - American Indian and Alaska Native
Year householder moved into unit - Moved in 1970 to 1979 (%) - Multirace
Year householder moved into unit - Moved in 1970 to 1979 (%) - Other Race
Year householder moved into unit - Moved in 1969 or earlier (%)
Year householder moved into unit - Moved in 1969 or earlier (%) - White
Year householder moved into unit - Moved in 1969 or earlier (%) - Black or African American
Year householder moved into unit - Moved in 1969 or earlier (%) - Asian
Year householder moved into unit - Moved in 1969 or earlier (%) - Hispanic or Latino
Year householder moved into unit - Moved in 1969 or earlier (%) - American Indian and Alaska Native
Year householder moved into unit - Moved in 1969 or earlier (%) - Multirace
Year householder moved into unit - Moved in 1969 or earlier (%) - Other Race
Housing units lacking complete plumbing facilities (%)
Housing units lacking complete kitchen facilities (%)
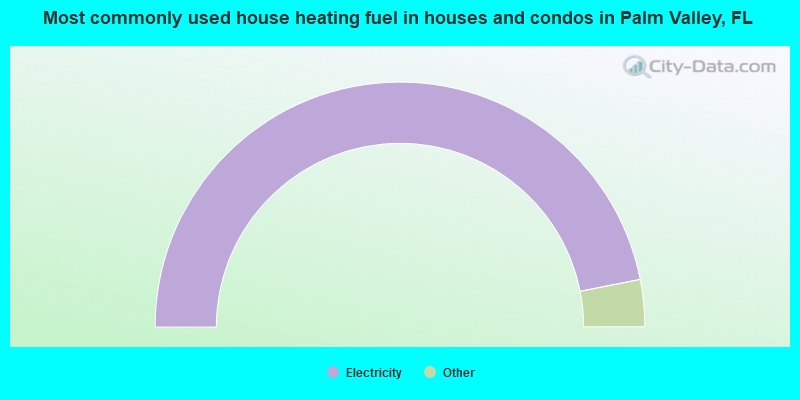
House heating fuel used in houses and condos - Utility gas (%)
House heating fuel used in houses and condos - Bottled, tank, or LP gas (%)
House heating fuel used in houses and condos - Electricity (%)
House heating fuel used in houses and condos - Fuel oil, kerosene, etc. (%)
House heating fuel used in houses and condos - Coal or coke (%)
House heating fuel used in houses and condos - Wood (%)
House heating fuel used in houses and condos - Solar energy (%)
House heating fuel used in houses and condos - Other fuel (%)
House heating fuel used in houses and condos - No fuel used (%)
House heating fuel used in apartments - Utility gas (%)
House heating fuel used in apartments - Bottled, tank, or LP gas (%)
House heating fuel used in apartments - Electricity (%)
House heating fuel used in apartments - Fuel oil, kerosene, etc. (%)
House heating fuel used in apartments - Coal or coke (%)
House heating fuel used in apartments - Wood (%)
House heating fuel used in apartments - Solar energy (%)
House heating fuel used in apartments - Other fuel (%)
House heating fuel used in apartments - No fuel used (%)
Median year house/condo built: 1994Median year apartment built: 1992Household type by relationship:
Households: 21,760
Male householders: 4,306 (768 living alone ), Female householders: 4,926 (2,027 living alone )5,266 spouses (5,261 opposite-sex spouses ), 234 unmarried partners , (234 opposite-sex unmarried partners ), 5,501 children (5,180 natural , 92 adopted , 227 stepchildren ), 394 grandchildren , 197 brothers or sisters , 105 parents , 53 foster children , 146 other relatives , 537 non-relatives In group quarters: 90
Size of family households: 4,154 2-persons , 1,048 3-persons , 851 4-persons , 461 5-persons , 106 6-persons , 33 7-or-more-persons .
Size of nonfamily households: 2,847 1-person , 341 2-persons , 16 3-persons , 10 4-persons .
3,486 married couples with children. single-parent households (115 men , 369 women ).
92.8% of residents of Palm Valley speak English at home. of residents speak Spanish at home (92% speak English very well , 5% speak English well , 3% speak English not well ).of residents speak other Indo-European language at home (98% speak English very well , 1% speak English well , 1% speak English not well ).of residents speak Asian or Pacific Island language at home (63% speak English very well , 33% speak English well , 4% speak English not well ).of residents speak other language at home (95% speak English very well , 5% speak English not well ).
Foreign born population: 1,871 (8.6%)of them are naturalized citizens )
Median number of rooms in houses and condos:
Median number of rooms in apartments
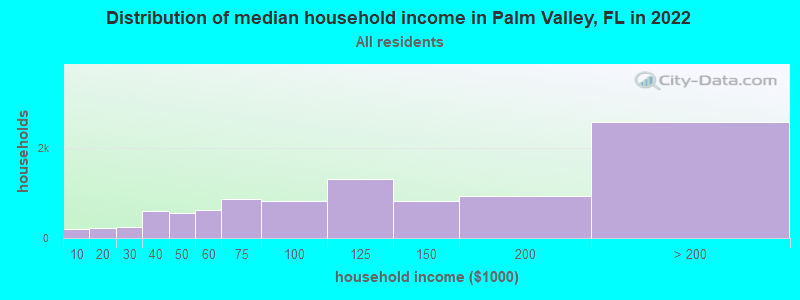
Palm Valley, FL household income distribution 192 Less than $10,000231 $10,000 to $19,999250 $20,000 to $29,999606 $30,000 to $39,999544 $40,000 to $49,999621 $50,000 to $59,999852 $60,000 to $74,999817 $75,000 to $99,9991,311 $100,000 to $124,999808 $125,000 to $149,999919 $150,000 to $199,9992,566 $200,000 or more
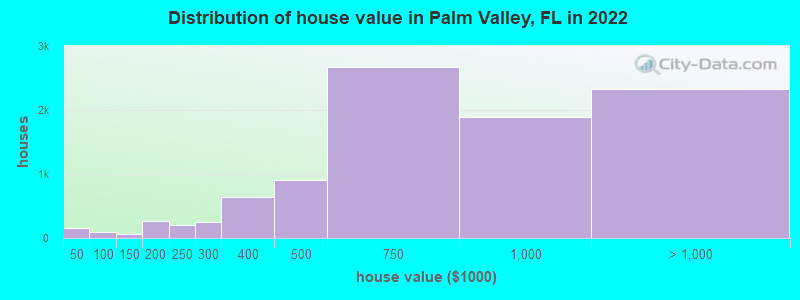
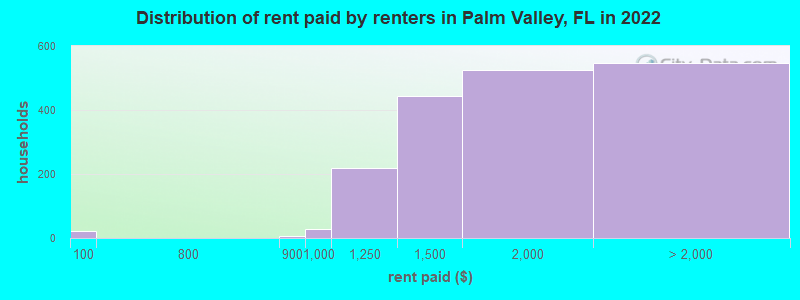
Home value of owner - occupied houses in 2022 in Palm Valley, FL 150 Less than $10,0004 $35,000 to $39,9996 $40,000 to $49,99913 $50,000 to $59,99969 $70,000 to $79,9999 $90,000 to $99,99966 $125,000 to $149,99992 $150,000 to $174,999181 $175,000 to $199,999208 $200,000 to $249,999253 $250,000 to $299,999634 $300,000 to $399,999909 $400,000 to $499,9992,676 $500,000 to $749,9991,890 $750,000 to $999,9991,252 $1,000,000 to $1,499,999386 $1,500,000 to $1,999,999687 $2,000,000 or moreRent paid by renters in 2022 in Palm Valley, FL 21 Less than $1006 $800 to $89928 $900 to $999218 $1,000 to $1,249445 $1,250 to $1,499524 $1,500 to $1,99969 $2,000 to $2,499205 $2,500 to $2,99939 $3,000 to $3,49991 $3,500 or more141 No cash rent
Percentage of workers working in this county: 51.4%Number of people working at home: 2,709 (28.3% of all workers )
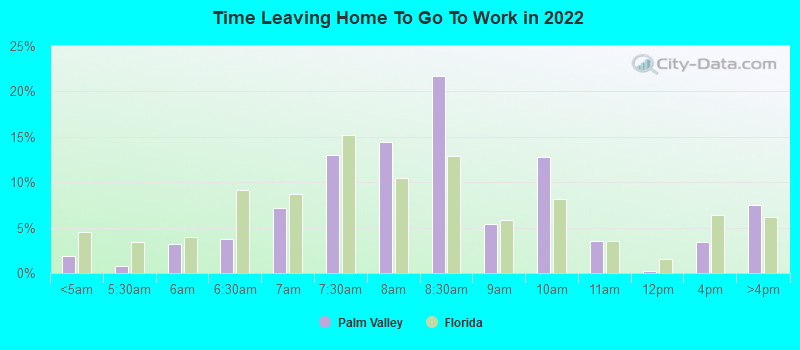
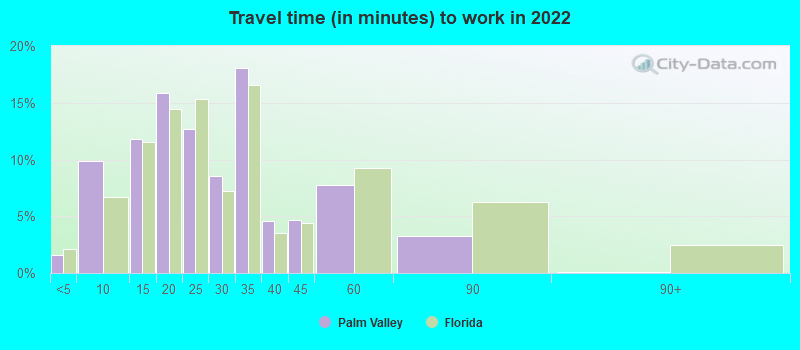
Travel time to work (commute)
Less than 5 minutes: 945 to 9 minutes: 75010 to 14 minutes: 73215 to 19 minutes: 1,08220 to 24 minutes: 82125 to 29 minutes: 70730 to 34 minutes: 1,81135 to 39 minutes: 19340 to 44 minutes: 25945 to 59 minutes: 62960 to 89 minutes: 8590 or more minutes: 281
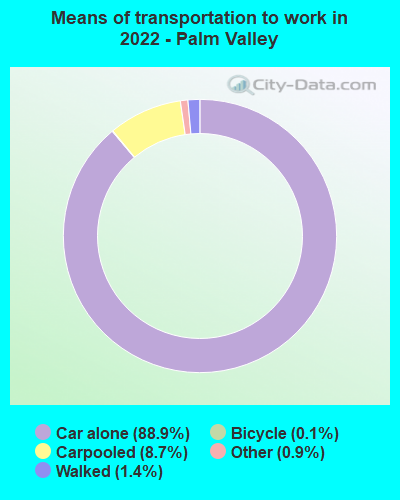
Means of transportation to work:
Drove a car alone: 7,470 (68.5%)Carpooled: 772 (7.1%)Taxi: 84 (0.8%)Bicycle: 11 (0.1%)Walked: 126 (1.2%)Worked at home: 2,709 (24.8%)
Unemployment by race in 2022
Unemployment rate for White non-Hispanic residents 2.0% Males1.6% FemalesUnemployment rate for two or more race residents 25.5% FemalesUnemployment rate for Hispanic or Latino residents 13.2% Females
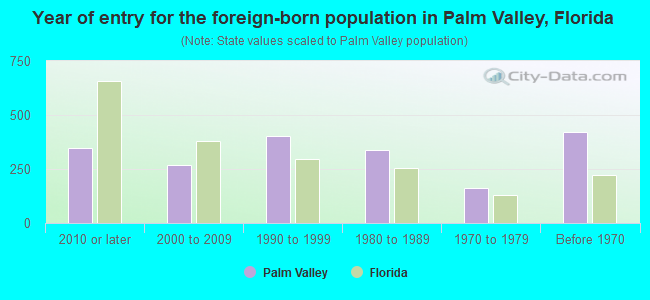
Year of entry for the foreign-born population in Palm Valley, Florida
349 2010 or later 269 2000 to 2009 403 1990 to 1999 336 1980 to 1989 163 1970 to 1979 421 Before 1970
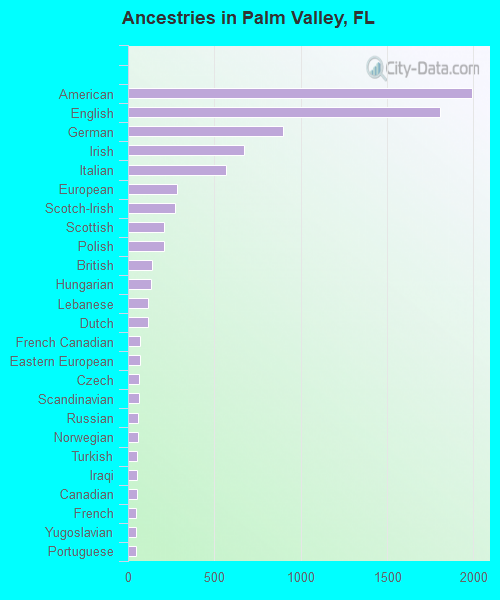
First ancestries reported:
American: 1,991 (20.4%)
English: 1,809 (18.6%)
German: 898 (9.2%)
Irish: 672 (6.9%)
Italian: 566 (5.8%)
European: 285 (2.9%)
Scotch-Irish: 271 (2.8%)
Scottish: 211 (2.2%)
Polish: 208 (2.1%)
British: 141 (1.4%)
Hungarian: 132 (1.4%)
Lebanese: 115 (1.2%)
Dutch: 114 (1.2%)
French Canadian: 68 (0.7%)
Eastern European: 68 (0.7%)
Czech: 66 (0.7%)
Scandinavian: 65 (0.7%)
Russian: 59 (0.6%)
Norwegian: 56 (0.6%)
Turkish: 54 (0.6%)
Iraqi: 50 (0.5%)
Canadian: 50 (0.5%)
French: 47 (0.5%)
Yugoslavian: 45 (0.5%)
Portuguese: 45 (0.5%)
Northern European: 41 (0.4%)
Armenian: 40 (0.4%)
African: 39 (0.4%)
Jamaican: 39 (0.4%)
Albanian: 31 (0.3%)
Swedish: 30 (0.3%)
Croatian: 27 (0.3%)
Welsh: 23 (0.2%)
Romanian: 21 (0.2%)
Greek: 18 (0.2%)
Austrian: 18 (0.2%)
Swiss: 17 (0.2%)
Pennsylvania German: 14 (0.1%)
Israeli: 14 (0.1%)
Nigerian: 12 (0.1%)
Iranian: 6 (0.06%)
Ukrainian: 6 (0.06%)
Australian: 5 (0.05%) Most common places of birth for foreign-born residents (%): Canada Palm Valley:
9.6% (163)Florida:
2.4% (109,132)
United Kingdom, excluding England and Scotland Palm Valley:
5.8% (98)Florida:
0.7% (34,227)
India Palm Valley:
5.3% (91)Florida:
2.1% (94,349)
England Palm Valley:
5.3% (91)Florida:
0.8% (37,723)
Other Eastern Europe Palm Valley:
4.8% (82)Florida:
0.2% (9,990)
Venezuela Palm Valley:
4.4% (75)Florida:
5.7% (262,042)
Dominican Republic Palm Valley:
4.3% (73)Florida:
3.0% (137,727)
Philippines Palm Valley:
3.8% (64)Florida:
1.8% (84,403)
Australia Palm Valley:
3.3% (57)Florida:
0.1% (5,190)
Ireland Palm Valley:
3.2% (54)Florida:
0.2% (9,421)
Italy Palm Valley:
3.1% (52)Florida:
0.7% (30,755)
South Africa Palm Valley:
2.9% (49)Florida:
0.2% (11,243)
Jamaica Palm Valley:
2.5% (43)Florida:
5.0% (227,319)
Brazil Palm Valley:
2.5% (42)Florida:
2.7% (122,906)
Romania Palm Valley:
2.1% (36)Florida:
0.3% (14,943)
Ukraine Palm Valley:
1.9% (33)Florida:
0.5% (21,886)
Iraq Palm Valley:
1.9% (32)Florida:
0.1% (4,966)
Scotland Palm Valley:
1.7% (29)Florida:
0.1% (5,920)
Germany Palm Valley:
1.6% (28)Florida:
1.2% (54,272)
Armenia Palm Valley:
1.6% (28)Florida:
0.0% (519)
Turkey Palm Valley:
1.6% (27)Florida:
0.2% (10,969)
Nepal Palm Valley:
1.6% (27)Florida:
0.0% (1,511)
Place of birth for U.S.-born residents:
This state: 6,438Other state: 13,102Northeast: 5,348Midwest: 2,884South: 3,975West: 884 88.7% of Palm Valley residents lived in the same house 1 years ago.
Out of people who lived in different houses, 31.3% lived in this county.
Out of people who lived in different counties, 55.1% lived in Florida.
Palm Valley:
88.7%State average:
86.3%
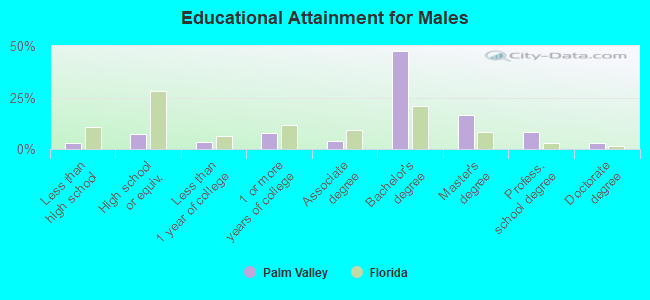
Education attainment for males 25 years and older:
No schooling: 5Nursery to 4th grade: 25th and 6th grade: 07th and 8th grade: 09th grade: 010th grade: 17611th grade: 2112th grade, no diploma: 24High school graduate (or equivalency): 616Less than 1 year of college: 281Some college more than 1 year, no degree: 644Associate degree: 303Bachelor's degree: 3,916Master's degree: 1,347Professional school degree: 696Doctorate degree: 232
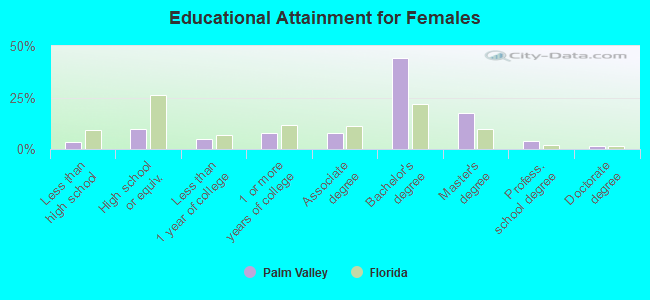
Education attainment for females 25 years and older:
No schooling: 43Nursery to 4th grade: 05th and 6th grade: 07th and 8th grade: 1809th grade: 3710th grade: 3011th grade: 1612th grade, no diploma: 27High school graduate (or equivalency): 891Less than 1 year of college: 446Some college more than 1 year, no degree: 717Associate degree: 739Bachelor's degree: 4,145Master's degree: 1,652Professional school degree: 344Doctorate degree: 119
Housing units in structures:
One, detached: 6,674One, attached: 580Two: 393 or 4: 1,0565 to 9: 85210 to 19: 75220 to 49: 40050 or more: 137Mobile homes: 38Median worth of mobile homes: $423,863
Housing units lacking complete plumbing facilities in 2022: 0.5%Housing units lacking complete kitchen facilities in 2022: 0.1%House/condo owner moved in on average 11 years ago
Renter moved in on average 1 years ago
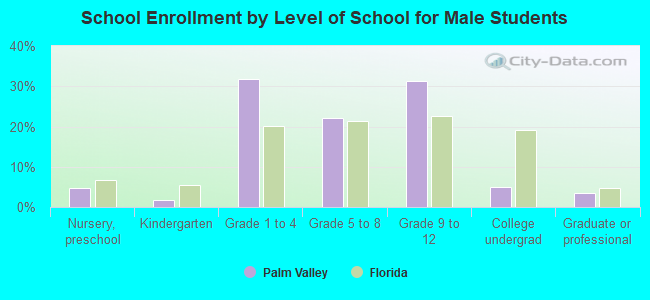
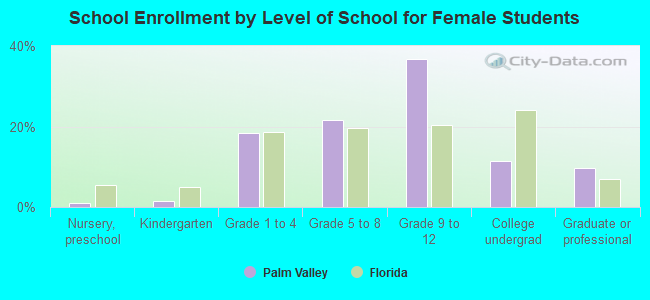
Private vs. public school enrollment:
Students in private schools in grades 1 to 8 (elementary and middle school): 473 Students in private schools in grades 9 to 12 (high school): 172 Students in private undergraduate colleges: 80