Pana, IL (Illinois) Houses and Residents
| Pana: | $86,603 |
| Illinois: | $251,600 |
Mean price in 2022:
Detached houses: $106,261
Here: $106,261 State: $310,164 Mobile homes: $89,241
Here: $89,241 State: $78,855
Total population: 5,656 (Urban population: 5,601 (all inside urban clusters), Rural population: 12 (all nonfarm))
Houses: 2,757 (2,240 occupied: 1,635 owner occupied, 633 renter occupied)
| % of renters here: | 28% |
| State: | 33% |
Housing density: 1,032 houses/condos per square mile
Median price asked for vacant for-sale houses and condos in 2022: $57,858.
Median contract rent in 2022: $457 (lower quartile is $345, upper quartile is $561)
Median rent asked for vacant for-rent units in 2022: $587
Median gross rent in Pana, IL in 2022: $666
Housing units in Pana with a mortgage: 729 (54 second mortgage, 0 home equity loan, 36 both second mortgage and home equity loan)
Houses without a mortgage: 56
Median household income for houses/condos with a mortgage: $55,091
Median household income for apartments without a mortgage: $57,573
Median monthly housing costs: $636
Compare current foreclosures near Pana, IL:
| Photo | Address | Area | Beds / Baths | Price | Details |
|---|---|---|---|---|---|

|
#1
W Washington St
Pana, IL 62557
|
- sq. feet
|
- baths 2 beds |
show details | |

|
#2
Birch Ave, Trlr 1
Pana, IL 62557
|
- sq. feet
|
- baths - beds |
show details | |

|
#3
E 650 North Rd
Pana, IL 62557
|
- sq. feet
|
- baths - beds |
show details | |

|
#4
Michaels St
Pana, IL 62557
|
- sq. feet
|
- baths - beds |
show details | |

|
#5
Main St
Shelbyville, IL 62565
|
2,070 sq. feet
|
1 baths 3 beds |
show details | |

|
#6
Kenton Blvd
Taylorville, IL 62568
|
1,530 sq. feet
|
1 baths 4 beds |
show details | |

|
#7
N Cherokee St
Taylorville, IL 62568
|
1,088 sq. feet
|
1 baths 3 beds |
show details | |

|
#8
N Long St
Shelbyville, IL 62565
|
- sq. feet
|
2 baths 2 beds |
show details | |

|
#9
S Front St
Ramsey, IL 62080
|
1,744 sq. feet
|
- baths - beds |
show details | |

|
#10
W Market St
Taylorville, IL 62568
|
- sq. feet
|
- baths - beds |
show details |
| Photo | Address | Area | Beds / Baths | Price | Details |
|---|---|---|---|---|---|

|
#11
4th St
Shelbyville, IL 62565
|
- sq. feet
|
- baths - beds |
show details | |

|
#12
State Highway 16
Shelbyville, IL 62565
|
- sq. feet
|
- baths - beds |
show details | |

|
#13
E 3rd St
Ramsey, IL 62080
|
- sq. feet
|
- baths - beds |
show details | |

|
#14
E 3rd St
Ramsey, IL 62080
|
- sq. feet
|
- baths - beds |
show details | |

|
#15
N Stuart St
Witt, IL 62094
|
- sq. feet
|
- baths - beds |
show details | |

|
#16
W North 3rd St
Shelbyville, IL 62565
|
- sq. feet
|
- baths - beds |
show details | |

|
#17
N 1100 East Rd
Tower Hill, IL 62571
|
- sq. feet
|
- baths - beds |
show details | |

|
#18
E Walnut St
Cowden, IL 62422
|
- sq. feet
|
- baths - beds |
show details | |

|
#19
N 1100 East Rd
Tower Hill, IL 62571
|
- sq. feet
|
- baths - beds |
show details | |

|
#20
E 3250 Ave
Ramsey, IL 62080
|
- sq. feet
|
- baths - beds |
show details |
| Photo | Address | Area | Beds / Baths | Price | Details |
|---|---|---|---|---|---|

|
#21
S Elevator St
Taylorville, IL 62568
|
- sq. feet
|
- baths - beds |
show details | |

|
#22
S Main St
Taylorville, IL 62568
|
- sq. feet
|
- baths - beds |
show details | |

|
#23
2 Box 124a
Ramsey, IL 62080
|
- sq. feet
|
- baths - beds |
show details | |

|
#24
N Elm St
Nokomis, IL 62075
|
- sq. feet
|
- baths - beds |
show details | |

|
#25
N Church St
Owaneco, IL 62555
|
- sq. feet
|
- baths - beds |
show details | |

|
#26
E Market St
Taylorville, IL 62568
|
- sq. feet
|
- baths - beds |
show details | |

|
#27
E Main Cross St
Taylorville, IL 62568
|
- sq. feet
|
- baths - beds |
show details | |

|
#28
E Thompson St
Taylorville, IL 62568
|
- sq. feet
|
- baths - beds |
show details | |

|
#29
N Long St
Shelbyville, IL 62565
|
- sq. feet
|
- baths - beds |
show details | |

|
#30
E 3100 Ave
Ramsey, IL 62080
|
- sq. feet
|
- baths - beds |
show details |
| Photo | Address | Area | Beds / Baths | Price | Details |
|---|---|---|---|---|---|

|
#31
W South 4th St
Shelbyville, IL 62565
|
- sq. feet
|
- baths - beds |
show details | |

|
#32
S Roosevelt Rd
Taylorville, IL 62568
|
- sq. feet
|
- baths - beds |
show details | |

|
#33
N Broadway St
Shelbyville, IL 62565
|
- sq. feet
|
- baths - beds |
show details | |

|
Check over 1 million property listings on Foreclosure.com!
|
browse all offers | |||

Latest news about housing in Pana, IL collected exclusively by city-data.com from local newspapers, TV, and radio stations

 | Moving to Peoria. Apartment suggestions? (3 replies) |
| how happy are you in Illinois? (87 replies) |
| Moving from the Desert to Peoria! (8 replies) |
| Moving to Springfield: I'm a little disappointed (15 replies) |
| Where to go in Illinois? (7 replies) |
| Best places to drive for Fall Foilage. (6 replies) |

Median year apartment built: 1971
Household type by relationship:
Households: 5,095- Male householders: 1,118 (501 living alone), Female householders: 1,080 (526 living alone)
711 spouses (711 opposite-sex spouses), 225 unmarried partners, (225 opposite-sex unmarried partners), 1,415 children (1,302 natural, 96 adopted, 15 stepchildren), 176 grandchildren, 28 brothers or sisters, 0 parents, 0 foster children, 41 other relatives, 165 non-relatives
- In group quarters: 132
Size of family households: 509 2-persons, 226 3-persons, 168 4-persons, 57 5-persons, 31 6-persons, 11 7-or-more-persons.
Size of nonfamily households: 1,083 1-person, 201 2-persons.
322 married couples with children.
458 single-parent households (294 men, 164 women).
99.2% of residents of Pana speak English at home.
0.6% of residents speak Asian or Pacific Island language at home (52% speak English very well, 48% speak English not well).
Foreign born population: 17 (0.3%)
(100.0% of them are naturalized citizens)
| Here: | 5.8 |
| State: | 6.4 |
| Here: | 4.5 |
| State: | 4.1 |

- Bedrooms in owner-occupied houses and condos in Pana, Illinois
- 0no bedroom
- 621 bedroom
- 5752 bedrooms
- 8233 bedrooms
- 1564 bedrooms
- 195+ bedrooms

- Bedrooms in renter-occupied apartments in Pana, Illinois
- 15no bedroom
- 1501 bedroom
- 3182 bedrooms
- 1523 bedrooms
- 04 bedrooms
- 05+ bedrooms

- Cars and other vehicles available in Pana in owner-occupied houses/condos
- 26no vehicle
- 6351 vehicle
- 6442 vehicles
- 2333 vehicles
- 974 vehicles
- 05+ vehicles

- Cars and other vehicles available in Pana in renter-occupied apartments
- 161no vehicle
- 2821 vehicle
- 1642 vehicles
- 273 vehicles
- 04 vehicles
- 05+ vehicles

- Rooms in owner-occupied houses in Pana, Illinois
- 01 room
- 02 rooms
- 863 rooms
- 2124 rooms
- 3905 rooms
- 4736 rooms
- 2257 rooms
- 1468 rooms
- 1049+ rooms

- Rooms in renter-occupied apartments in Pana, Illinois
- 151 room
- 322 rooms
- 923 rooms
- 1644 rooms
- 1965 rooms
- 656 rooms
- 477 rooms
- 08 rooms
- 239+ rooms


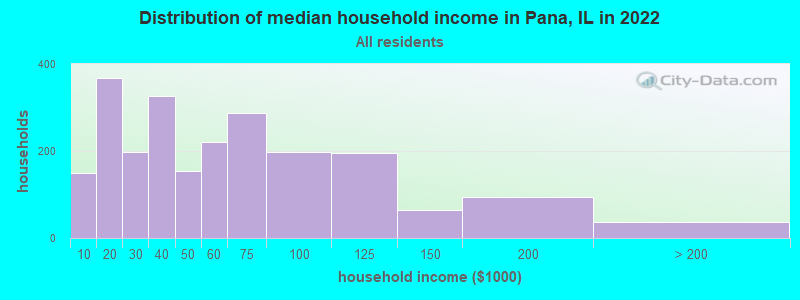
Pana, IL household income distribution

- 150Less than $10,000
- 368$10,000 to $19,999
- 198$20,000 to $29,999
- 326$30,000 to $39,999
- 155$40,000 to $49,999
- 220$50,000 to $59,999
- 287$60,000 to $74,999
- 197$75,000 to $99,999
- 195$100,000 to $124,999
- 65$125,000 to $149,999
- 94$150,000 to $199,999
- 37$200,000 or more
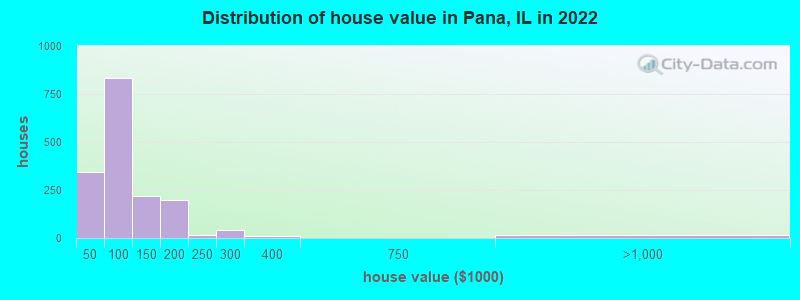
Home value of owner - occupied houses in 2022 in Pana, IL
-
- 16$10,000 to $14,999
- 20$15,000 to $19,999
- 88$20,000 to $24,999
- 74$25,000 to $29,999
- 14$30,000 to $34,999
- 35$35,000 to $39,999
- 93$40,000 to $49,999
- 83$50,000 to $59,999
- 77$60,000 to $69,999
- 258$70,000 to $79,999
- 230$80,000 to $89,999
- 88$90,000 to $99,999
- 156$100,000 to $124,999
- 64$125,000 to $149,999
- 122$150,000 to $174,999
- 74$175,000 to $199,999
- 15$200,000 to $249,999
- 40$250,000 to $299,999
- 9$300,000 to $399,999
- 8$750,000 to $999,999
- 9$1,000,000 to $1,499,999
Rent paid by renters in 2022 in Pana, IL
-
- 29Less than $100
- 20$200 to $249
- 36$250 to $299
- 28$300 to $349
- 58$350 to $399
- 69$400 to $449
- 56$450 to $499
- 72$500 to $549
- 48$550 to $599
- 23$600 to $649
- 14$650 to $699
- 40$700 to $749
- 118No cash rent


Percentage of workers working in this county: 61.0%
Number of people working at home: 223 (10.1% of all workers)
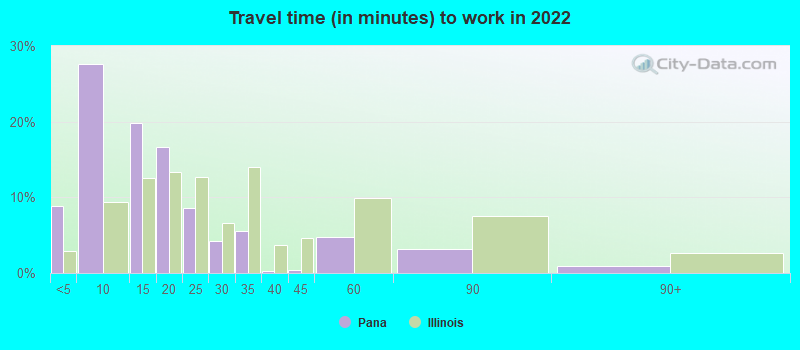
Travel time to work (commute)
- Less than 5 minutes: 165
- 5 to 9 minutes: 477
- 10 to 14 minutes: 149
- 15 to 19 minutes: 315
- 20 to 24 minutes: 149
- 25 to 29 minutes: 167
- 30 to 34 minutes: 101
- 35 to 39 minutes: 40
- 40 to 44 minutes: 91
- 45 to 59 minutes: 125
- 60 to 89 minutes: 155
- 90 or more minutes: 12
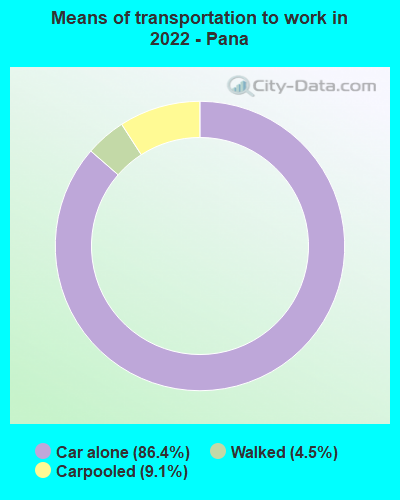
Means of transportation to work:
- Drove a car alone: 1,641 (76.6%)
- Carpooled: 184 (8.6%)
- Walked: 86 (4.0%)
- Worked at home: 223 (10.4%)

- Unemployment by race in 2022
- Unemployment rate for White non-Hispanic residents
- 2.9%Males
- 5.2%Females
- Unemployment rate for Asian residents
- 70.0%Males

- Year of entry for the foreign-born population in Pana, Illinois
- 02010 or later
- 02000 to 2009
- 01990 to 1999
- 151980 to 1989
- 111970 to 1979
- 21Before 1970

First ancestries reported:
- German: 434 (23.3%)
- American: 429 (23.1%)
- English: 212 (11.4%)
- Irish: 104 (5.6%)
- Scotch-Irish: 61 (3.3%)
- Australian: 54 (2.9%)
- British: 52 (2.8%)
- European: 50 (2.7%)
- French: 50 (2.7%)
- Swedish: 43 (2.3%)
- Eastern European: 30 (1.6%)
- Scottish: 17 (0.9%)
- Hungarian: 13 (0.7%)
- Lithuanian: 10 (0.5%)
- Norwegian: 9 (0.5%)
- Polish: 8 (0.4%)
- Austrian: 7 (0.4%)
- Danish: 7 (0.4%)
- Greek: 6 (0.3%)
- Italian: 6 (0.3%)
- Slovak: 6 (0.3%)
Most common places of birth for foreign-born residents (%):
| Pana: | 47.1% (8) |
| Illinois: | 4.1% (74,364) |
| Pana: | 35.3% (6) |
| Illinois: | 0.2% (3,065) |
Place of birth for U.S.-born residents:
- This state: 4,077
- Other state: 970
- Northeast: 72
- Midwest: 389
- South: 351
- West: 152
89.7% of Pana residents lived in the same house 1 years ago.
Out of people who lived in different houses, 20.4% lived in this county.
Out of people who lived in different counties, 35.8% lived in Illinois.
| Pana: | 89.7% |
| State average: | 88.3% |
Education attainment for males 25 years and older:
- No schooling: 11
- Nursery to 4th grade: 0
- 5th and 6th grade: 0
- 7th and 8th grade: 39
- 9th grade: 44
- 10th grade: 17
- 11th grade: 76
- 12th grade, no diploma: 47
- High school graduate (or equivalency): 843
- Less than 1 year of college: 125
- Some college more than 1 year, no degree: 191
- Associate degree: 133
- Bachelor's degree: 167
- Master's degree: 27
- Professional school degree: 6
- Doctorate degree: 107

Education attainment for females 25 years and older:
- No schooling: 14
- Nursery to 4th grade: 0
- 5th and 6th grade: 28
- 7th and 8th grade: 33
- 9th grade: 12
- 10th grade: 12
- 11th grade: 32
- 12th grade, no diploma: 41
- High school graduate (or equivalency): 939
- Less than 1 year of college: 145
- Some college more than 1 year, no degree: 133
- Associate degree: 223
- Bachelor's degree: 193
- Master's degree: 58
- Professional school degree: 0
- Doctorate degree: 14


Housing units in structures:
- One, detached: 2,147
- One, attached: 22
- Two: 42
- 3 or 4: 70
- 5 to 9: 50
- 10 to 19: 28
- 20 to 49: 15
- 50 or more: 144
- Mobile homes: 237
Median worth of mobile homes: $91,685
Housing units lacking complete kitchen facilities in 2022: 1.2%
House/condo owner moved in on average 15 years ago
Renter moved in on average 6 years ago

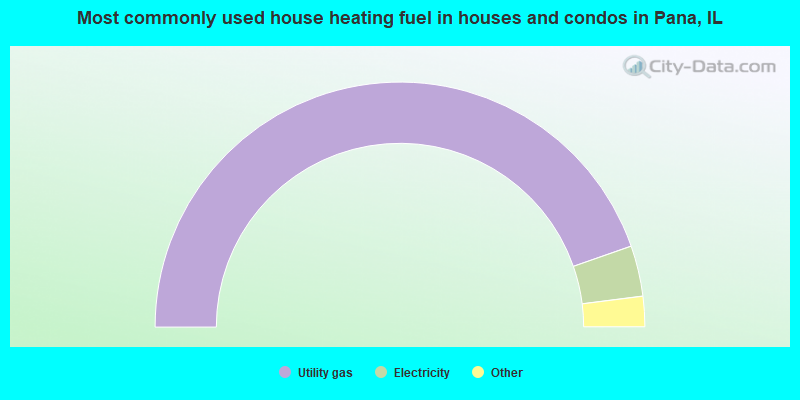
- 89.4%Utility gas
- 6.7%Electricity
- 2.4%Bottled, tank, or LP gas
- 1.6%Wood
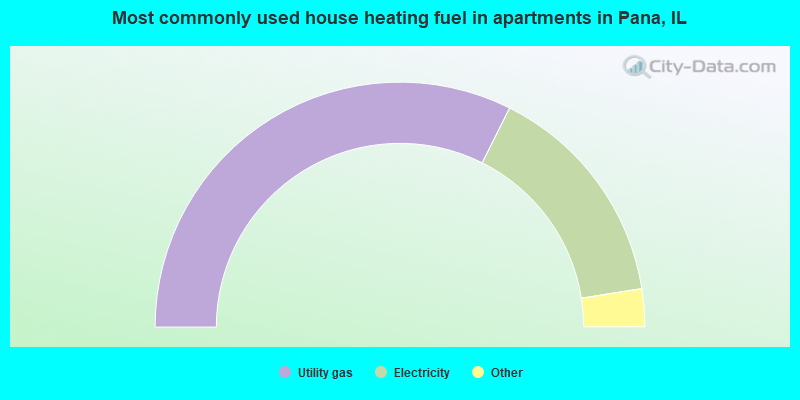
- 65.0%Utility gas
- 30.3%Electricity
- 3.2%Bottled, tank, or LP gas
- 1.4%Other fuel
Private vs. public school enrollment:
| Here: | 9.4% |
| Illinois: | 13.3% |
| Here: | 12.3% |
| Illinois: | 9.9% |
| Here: | 27.3% |
| Illinois: | 27.4% |


