Panama City, FL (Florida) Houses and Residents
Estimated median house or condo value in 2022: $270,722 (it was $75,200 in 2000 )
Panama City:
$270,722Florida:
$354,100
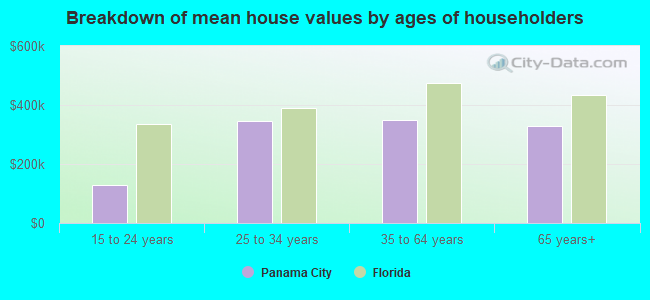
Lower value quartile - upper value quartile: $167,995 - $418,381Mean price in 2022: Detached houses: $333,026 Here:
$333,026State:
$500,941
Townhouses or other attached units: $265,414 Here:
$265,414State:
$370,869
In 2-unit structures: $274,815 Here:
$274,815State:
$423,188
In 3-to-4-unit structures: $145,232 Here:
$145,232State:
$309,944
In 5-or-more-unit structures: $200,954 Here:
$200,954State:
$447,145
Mobile homes: $82,356 Here:
$82,356State:
$113,202
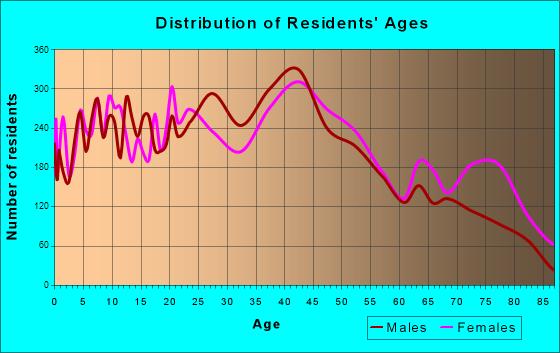
Total population: 37,681 (Urban population: 36,371, Rural population: 0)
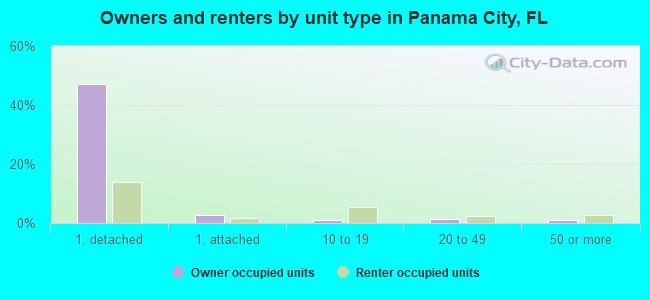
Houses: 16,771 (15,140 occupied: 8,516 owner occupied, 6,884 renter occupied )
% of renters here:
45%State:
33%
Housing density: 817 houses/condos per square mile
Median price asked for vacant for-sale houses and condos in 2022: $126,328.
Median contract rent in 2022: $975 (lower quartile is $761, upper quartile is $1,336)
Median rent asked for vacant for-rent units in 2022: $1,270
Median gross rent in Panama City, FL in 2022: $1,182
Housing units in Panama City with a mortgage: 4,981 (335 second mortgage, 6 home equity loan, 262 both second mortgage and home equity loan )Houses without a mortgage: 90
Median household income for houses/condos with a mortgage: $82,673
Median household income for apartments without a mortgage: $64,445
Median monthly housing costs: $1,139
Data:
Median house or condo value ($)
Median house or condo value ($ change since 2000)
Median house or condo value ($) - White
Median house or condo value ($) - Black or African American
Median house or condo value ($) - Asian
Median house or condo value ($) - Hispanic or Latino
Median house or condo value ($) - American Indian and Alaska Native
Median house or condo value ($) - Multirace
Median house or condo value ($) - Other Race
Median price asked for mobile homes ($)
Household density (households per square mile)
Mean house or condo value by units in structure - 1, detached ($)
Mean house or condo value by units in structure - 1, attached ($)
Mean house or condo value by units in structure - 2 ($)
Mean house or condo value by units in structure by units in structure - 3 or 4 ($)
Mean house or condo value by units in structure - 5 or more ($)
Mean house or condo value by units in structure - Boat, RV, van, etc. ($)
Mean house or condo value by units in structure - Mobile home ($)
Median contract rent ($)
Median contract rent - Lower quartile ($)
Median contract rent - Upper quartile ($)
Median gross rent ($)
Urban houses (%)
Rural houses (%)
Houses occupied (%)
Houses occupied (% change since 2000)
Houses owner occupied (%)
Houses owner occupied (% change since 2000)
Houses renter occupied (%)
Houses renter occupied (% change since 2000)
Vacant housing units - For rent (%)
Vacant housing units - For rent (% change since 2000)
Vacant housing units - For sale only (%)
Vacant housing units - For sale only (% change since 2000)
Vacant housing units - Rented or sold, not occupied (%)
Vacant housing units - Rented or sold, not occupied (% change since 2000)
Vacant housing units - For seasonal, recreational, or occasional use (%)
Vacant housing units - For seasonal, recreational, or occasional use (% change since 2000)
Vacant housing units - For migrant workers (%)
Vacant housing units - For migrant workers (% change since 2000)
Vacant housing units - Other vacant (%)
Vacant housing units - Other vacant (% change since 2000)
Median monthly housing costs ($)
Median household income for houses/condos with a mortgage ($)
Median household income for houses/condos without a mortgage ($)
Median household income ($)
Median household income ($) - White
Median household income ($) - Black or African American
Median household income ($) - Asian
Median household income ($) - Hispanic or Latino
Median household income ($) - American Indian and Alaska Native
Median household income ($) - Multirace
Median household income ($) - Other Race
Mortgage status - with mortgage (%)
Mortgage status - with second mortgage (%)
Mortgage status - with home equity loan (%)
Mortgage status - with both second mortgage and home equity loan (%)
Mortgage status - without a mortgage (%)
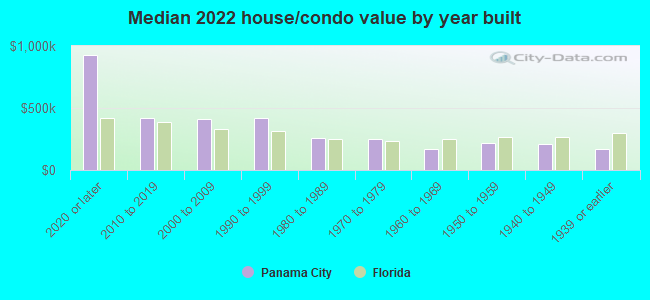
Median year house/condo built
Median year apartment built
Household type by relationship - Male householder living alone (%)
Household type by relationship - Male householder not living alone (%)
Household type by relationship - Female householder living alone (%)
Household type by relationship - Female householder not living alone (%)
Household type by relationship - Opposite-Sex spouse (%)
Household type by relationship - Same-Sex spouse (%)
Household type by relationship - Opposite-Sex unmarried partner (%)
Household type by relationship - Same-Sex unmarried partner (%)
Household type by relationship - In group quarters (%)
Size of family households - 2-person household (%)
Size of family households - 3-person household (%)
Size of family households - 4-person household (%)
Size of family households - 5-person household (%)
Size of family households - 6-person household (%)
Size of family households - 7-or-more-person household (%)
Size of nonfamily households - 1-person household (%)
Size of nonfamily households - 2-person household (%)
Size of nonfamily households - 3-person household (%)
Size of nonfamily households - 4-person household (%)
Size of nonfamily households - 5-person household (%)
Size of nonfamily households - 6-person household (%)
Size of nonfamily households - 7-or-moreperson household (%)
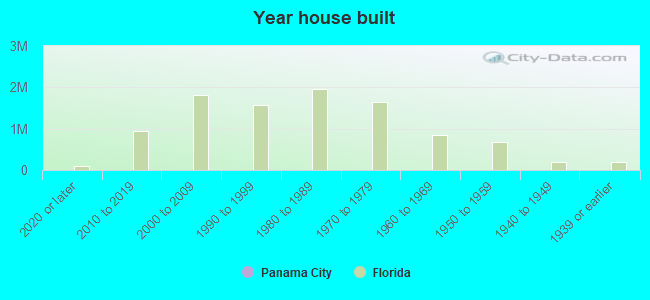
Year house built - Built 2010 or later (%)
Year house built - Built 2000 to 2009 (%)
Year house built - Built 1990 to 1999 (%)
Year house built - Built 1980 to 1989 (%)
Year house built - Built 1970 to 1979 (%)
Year house built - Built 1960 to 1969 (%)
Year house built - Built 1950 to 1959 (%)
Year house built - Built 1940 to 1949 (%)
Year house built - Built 1939 or earlier (%)
Median number of rooms in houses and condos
Median number of rooms in apartments
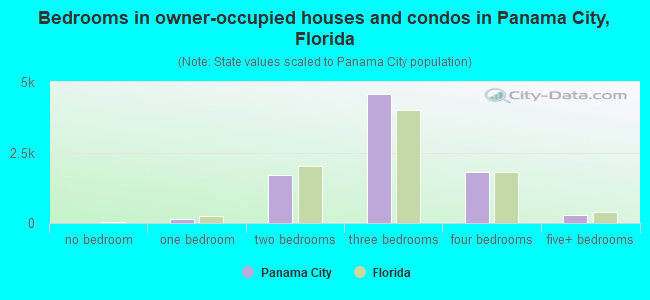
Median number of bedrooms in owner occupied houses
Mean number of bedrooms in owner occupied houses
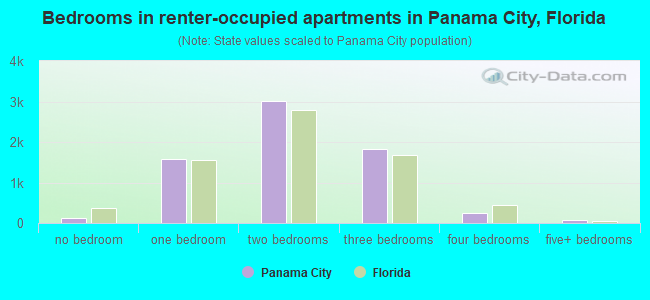
Median number of bedrooms in renter occupied houses
Mean number of bedrooms in renter occupied houses
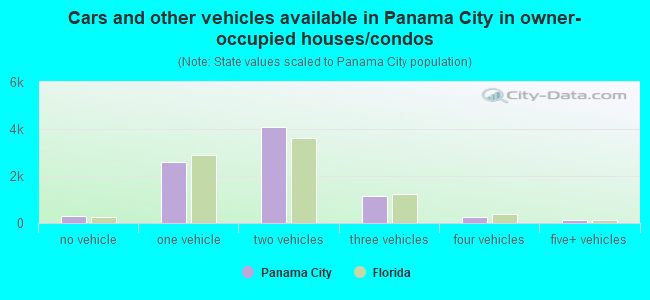
Median number of vehichles in owner occupied houses
Mean number of vehichles in owner occupied houses
Median number of vehichles in renter occupied houses
Mean number of vehichles in renter occupied houses
Rooms in owner-occupied houses - 1 room (%)
Rooms in owner-occupied houses - 2 rooms (%)
Rooms in owner-occupied houses - 3 rooms (%)
Rooms in owner-occupied houses - 4 rooms (%)
Rooms in owner-occupied houses - 5 rooms (%)
Rooms in owner-occupied houses - 6 rooms (%)
Rooms in owner-occupied houses - 7 rooms (%)
Rooms in owner-occupied houses - 8 rooms (%)
Rooms in owner-occupied houses - 9+ rooms (%)
Rooms in renter-occupied houses - 1 room (%)
Rooms in renter-occupied houses - 2 rooms (%)
Rooms in renter-occupied houses - 3 rooms (%)
Rooms in renter-occupied houses - 4 rooms (%)
Rooms in renter-occupied houses - 5 rooms (%)
Rooms in renter-occupied houses - 6 rooms (%)
Rooms in renter-occupied houses - 7 rooms (%)
Rooms in renter-occupied houses - 8 rooms (%)
Rooms in renter-occupied houses - 9+ rooms (%)
Bedrooms in owner-occupied houses - no bedrooms (%)
Bedrooms in owner-occupied houses - 1 bedroom (%)
Bedrooms in owner-occupied houses - 2 bedrooms (%)
Bedrooms in owner-occupied houses - 3 bedrooms (%)
Bedrooms in owner-occupied houses - 4 bedrooms (%)
Bedrooms in owner-occupied houses - 5+ bedrooms (%)
Bedrooms in renter-occupied houses - no bedrooms (%)
Bedrooms in renter-occupied houses - 1 bedroom (%)
Bedrooms in renter-occupied houses - 2 bedrooms (%)
Bedrooms in renter-occupied houses - 3 bedrooms (%)
Bedrooms in renter-occupied houses - 4 bedrooms (%)
Bedrooms in renter-occupied houses - 5+ bedrooms (%)
Vehicles available in owner-occupied houses - no vehicle available (%)
Vehicles available in owner-occupied houses - 1 vehicle available(%)
Vehicles available in owner-occupied houses - 2 Vehicles available (%)
Vehicles available in owner-occupied houses - 3 Vehicles available (%)
Vehicles available in owner-occupied houses - 4 Vehicles available (%)
Vehicles available in owner-occupied houses - 5+ Vehicles available (%)
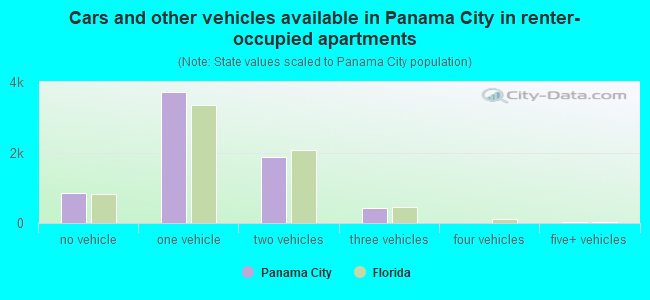
Vehicles available in renter-occupied houses - no vehicle available (%)
Vehicles available in renter-occupied houses - 1 vehicle available (%)
Vehicles available in renter-occupied houses - 2 Vehicles available (%)
Vehicles available in renter-occupied houses - 3 Vehicles available (%)
Vehicles available in renter-occupied houses - 4 Vehicles available (%)
Vehicles available in renter-occupied houses - 5+ Vehicles available (%)
Housing units in structures - 1, detached (%)
Housing units in structures - 1, attached (%)
Housing units in structures - 2 (%)
Housing units in structures - 3 or 4 (%)
Housing units in structures - 5 to 9 (%)
Housing units in structures - 10 to 19 (%)
Housing units in structures - 20 to 49 (%)
Housing units in structures - 50 or more (%)
Housing units in structures - Mobile home (%)
Housing units in structures - Boat, RV, van, etc. (%)
Housing units in structures - Owners - 1, detached (%)
Housing units in structures - Owners - 1, attached (%)
Housing units in structures - Owners - 2 (%)
Housing units in structures - Owners - 3 or 4 (%)
Housing units in structures - Owners - 5 to 9 (%)
Housing units in structures - Owners - 10 to 19 (%)
Housing units in structures - Owners - 20 to 49 (%)
Housing units in structures - Owners - 50 or more (%)
Housing units in structures - Owners - Mobile home (%)
Housing units in structures - Owners - Boat, RV, van, etc. (%)
Housing units in structures - Renters - 1, detached (%)
Housing units in structures - Renters - 1, attached (%)
Housing units in structures - Renters - 2 (%)
Housing units in structures - Renters - 3 or 4 (%)
Housing units in structures - Renters - 5 to 9 (%)
Housing units in structures - Renters - 10 to 19 (%)
Housing units in structures - Renters - 20 to 49 (%)
Housing units in structures - Renters - 50 or more (%)
Housing units in structures - Renters - Mobile home (%)
Housing units in structures - Renters - Boat, RV, van, etc. (%)
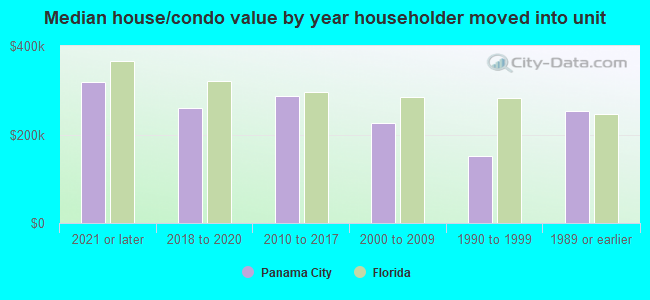
House/condo owner moved in on average (years ago)
Renter moved in on average (years ago)
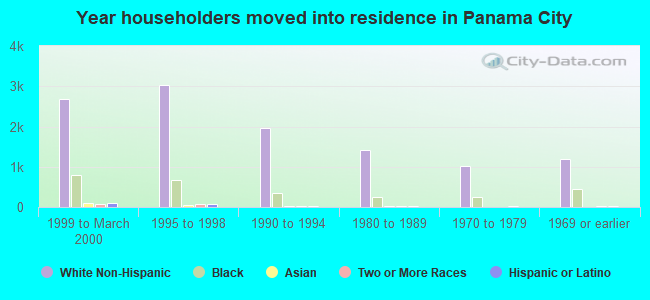
Year householder moved into unit - Moved in 1999 to March 2000 (%)
Year householder moved into unit - Moved in 1999 to March 2000 (%) - White
Year householder moved into unit - Moved in 1999 to March 2000 (%) - Black or African American
Year householder moved into unit - Moved in 1999 to March 2000 (%) - Asian
Year householder moved into unit - Moved in 1999 to March 2000 (%) - Hispanic or Latino
Year householder moved into unit - Moved in 1999 to March 2000 (%) - American Indian and Alaska Native
Year householder moved into unit - Moved in 1999 to March 2000 (%) - Multirace
Year householder moved into unit - Moved in 1999 to March 2000 (%) - Other Race
Year householder moved into unit - Moved in 1995 to 1998 (%)
Year householder moved into unit - Moved in 1995 to 1998 (%) - White
Year householder moved into unit - Moved in 1995 to 1998 (%) - Black or African American
Year householder moved into unit - Moved in 1995 to 1998 (%) - Asian
Year householder moved into unit - Moved in 1995 to 1998 (%) - Hispanic or Latino
Year householder moved into unit - Moved in 1995 to 1998 (%) - American Indian and Alaska Native
Year householder moved into unit - Moved in 1995 to 1998 (%) - Multirace
Year householder moved into unit - Moved in 1995 to 1998 (%) - Other Race
Year householder moved into unit - Moved in 1990 to 1994 (%)
Year householder moved into unit - Moved in 1990 to 1994 (%) - White
Year householder moved into unit - Moved in 1990 to 1994 (%) - Black or African American
Year householder moved into unit - Moved in 1990 to 1994 (%) - Asian
Year householder moved into unit - Moved in 1990 to 1994 (%) - Hispanic or Latino
Year householder moved into unit - Moved in 1990 to 1994 (%) - American Indian and Alaska Native
Year householder moved into unit - Moved in 1990 to 1994 (%) - Multirace
Year householder moved into unit - Moved in 1990 to 1994 (%) - Other Race
Year householder moved into unit - Moved in 1980 to 1989 (%)
Year householder moved into unit - Moved in 1980 to 1989 (%) - White
Year householder moved into unit - Moved in 1980 to 1989 (%) - Black or African American
Year householder moved into unit - Moved in 1980 to 1989 (%) - Asian
Year householder moved into unit - Moved in 1980 to 1989 (%) - Hispanic or Latino
Year householder moved into unit - Moved in 1980 to 1989 (%) - American Indian and Alaska Native
Year householder moved into unit - Moved in 1980 to 1989 (%) - Multirace
Year householder moved into unit - Moved in 1980 to 1989 (%) - Other Race
Year householder moved into unit - Moved in 1970 to 1979 (%)
Year householder moved into unit - Moved in 1970 to 1979 (%) - White
Year householder moved into unit - Moved in 1970 to 1979 (%) - Black or African American
Year householder moved into unit - Moved in 1970 to 1979 (%) - Asian
Year householder moved into unit - Moved in 1970 to 1979 (%) - Hispanic or Latino
Year householder moved into unit - Moved in 1970 to 1979 (%) - American Indian and Alaska Native
Year householder moved into unit - Moved in 1970 to 1979 (%) - Multirace
Year householder moved into unit - Moved in 1970 to 1979 (%) - Other Race
Year householder moved into unit - Moved in 1969 or earlier (%)
Year householder moved into unit - Moved in 1969 or earlier (%) - White
Year householder moved into unit - Moved in 1969 or earlier (%) - Black or African American
Year householder moved into unit - Moved in 1969 or earlier (%) - Asian
Year householder moved into unit - Moved in 1969 or earlier (%) - Hispanic or Latino
Year householder moved into unit - Moved in 1969 or earlier (%) - American Indian and Alaska Native
Year householder moved into unit - Moved in 1969 or earlier (%) - Multirace
Year householder moved into unit - Moved in 1969 or earlier (%) - Other Race
Housing units lacking complete plumbing facilities (%)
Housing units lacking complete kitchen facilities (%)
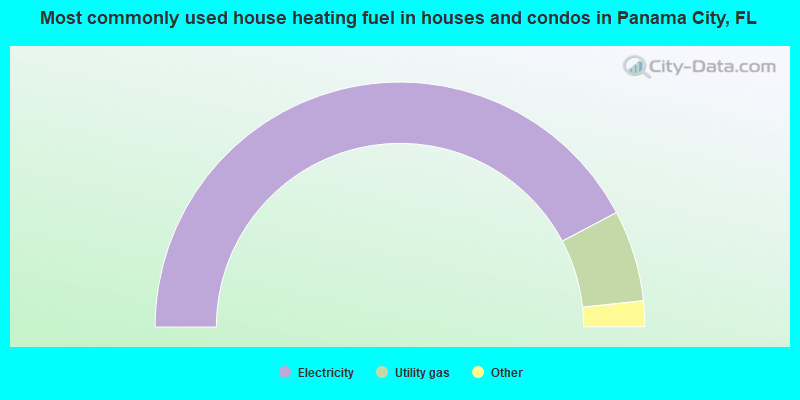
House heating fuel used in houses and condos - Utility gas (%)
House heating fuel used in houses and condos - Bottled, tank, or LP gas (%)
House heating fuel used in houses and condos - Electricity (%)
House heating fuel used in houses and condos - Fuel oil, kerosene, etc. (%)
House heating fuel used in houses and condos - Coal or coke (%)
House heating fuel used in houses and condos - Wood (%)
House heating fuel used in houses and condos - Solar energy (%)
House heating fuel used in houses and condos - Other fuel (%)
House heating fuel used in houses and condos - No fuel used (%)
House heating fuel used in apartments - Utility gas (%)
House heating fuel used in apartments - Bottled, tank, or LP gas (%)
House heating fuel used in apartments - Electricity (%)
House heating fuel used in apartments - Fuel oil, kerosene, etc. (%)
House heating fuel used in apartments - Coal or coke (%)
House heating fuel used in apartments - Wood (%)
House heating fuel used in apartments - Solar energy (%)
House heating fuel used in apartments - Other fuel (%)
House heating fuel used in apartments - No fuel used (%)
Median year house/condo built: 1980Median year apartment built: 1989Household type by relationship:
Households: 35,025
Male householders: 6,514 (2,099 living alone ), Female householders: 8,363 (2,967 living alone )5,348 spouses (5,274 opposite-sex spouses ), 1,358 unmarried partners , (1,281 opposite-sex unmarried partners ), 9,134 children (8,237 natural , 422 adopted , 474 stepchildren ), 946 grandchildren , 549 brothers or sisters , 448 parents , 11 foster children , 511 other relatives , 963 non-relatives In group quarters: 875
Size of family households: 3,962 2-persons , 2,122 3-persons , 1,469 4-persons , 720 5-persons , 222 6-persons , 277 7-or-more-persons .
Size of nonfamily households: 5,150 1-person , 1,411 2-persons , 69 3-persons , 19 4-persons , 23 5-persons .
4,008 married couples with children. single-parent households (394 men , 2,716 women ).
89.6% of residents of Panama City speak English at home. of residents speak Spanish at home (37% speak English very well , 23% speak English well , 18% speak English not well , 22% don't speak English at all ).of residents speak other Indo-European language at home (89% speak English very well , 7% speak English well , 4% speak English not well ).of residents speak Asian or Pacific Island language at home (66% speak English very well , 18% speak English well , 5% speak English not well , 11% don't speak English at all ).of residents speak other language at home (71% speak English very well , 10% speak English well , 12% speak English not well , 6% don't speak English at all ).
Foreign born population: 2,307 (6.6%)of them are naturalized citizens )
Median number of rooms in houses and condos:
Median number of rooms in apartments
Owner-occupied Renter-occupied
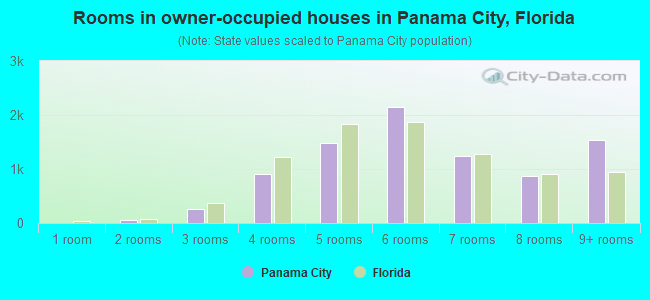
Rooms in owner-occupied houses in Panama City, Florida
4 1 room 58 2 rooms 268 3 rooms 908 4 rooms 1,481 5 rooms 2,154 6 rooms 1,232 7 rooms 872 8 rooms 1,539 9+ rooms
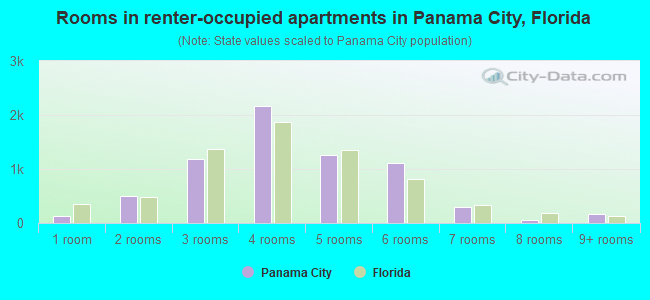
Rooms in renter-occupied apartments in Panama City, Florida
133 1 room 508 2 rooms 1,187 3 rooms 2,160 4 rooms 1,266 5 rooms 1,111 6 rooms 301 7 rooms 52 8 rooms 166 9+ rooms
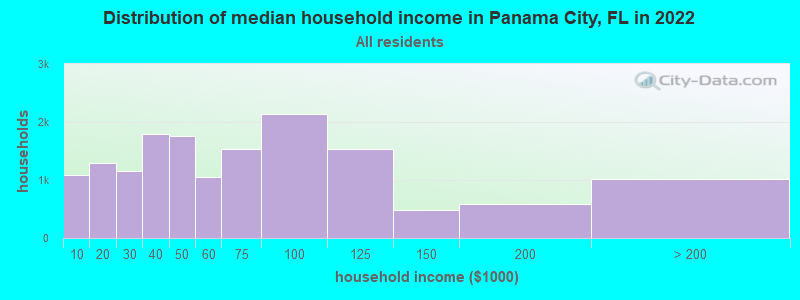
Panama City, FL household income distribution 1,092 Less than $10,0001,289 $10,000 to $19,9991,163 $20,000 to $29,9991,790 $30,000 to $39,9991,766 $40,000 to $49,9991,052 $50,000 to $59,9991,526 $60,000 to $74,9992,146 $75,000 to $99,9991,541 $100,000 to $124,999486 $125,000 to $149,999584 $150,000 to $199,9991,016 $200,000 or more
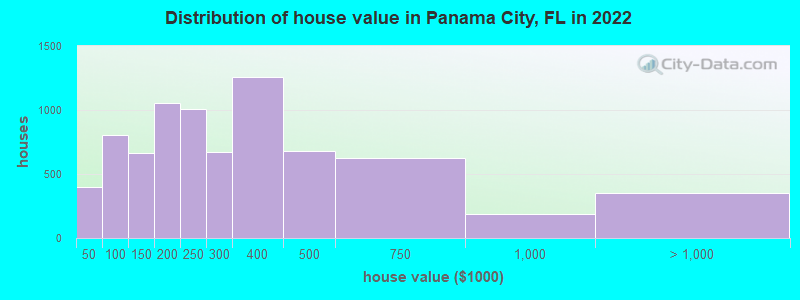
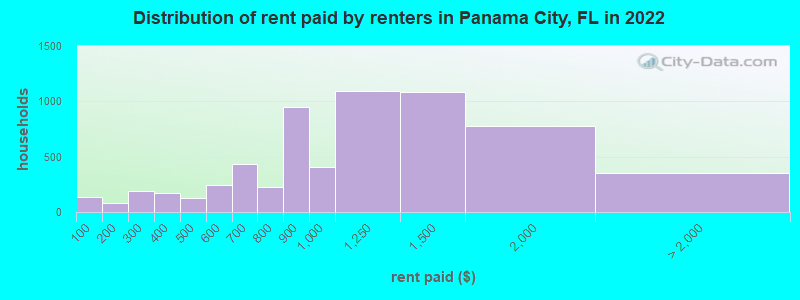
Home value of owner - occupied houses in 2022 in Panama City, FL 71 Less than $10,00017 $10,000 to $14,99929 $20,000 to $24,99919 $25,000 to $29,99981 $30,000 to $34,99932 $35,000 to $39,999144 $40,000 to $49,999205 $50,000 to $59,99942 $60,000 to $69,9998 $70,000 to $79,999221 $80,000 to $89,999182 $90,000 to $99,999422 $100,000 to $124,999239 $125,000 to $149,999531 $150,000 to $174,999524 $175,000 to $199,9991,005 $200,000 to $249,999669 $250,000 to $299,9991,260 $300,000 to $399,999681 $400,000 to $499,999625 $500,000 to $749,999186 $750,000 to $999,999227 $1,000,000 to $1,499,99926 $1,500,000 to $1,999,99993 $2,000,000 or moreRent paid by renters in 2022 in Panama City, FL 136 Less than $1004 $100 to $14974 $150 to $199128 $200 to $24966 $250 to $299123 $300 to $34950 $350 to $39965 $400 to $44956 $450 to $499153 $500 to $54988 $550 to $59952 $600 to $649385 $650 to $69987 $700 to $749141 $750 to $799948 $800 to $899409 $900 to $9991,094 $1,000 to $1,2491,087 $1,250 to $1,499776 $1,500 to $1,99956 $2,000 to $2,49964 $2,500 to $2,99922 $3,000 to $3,49944 $3,500 or more165 No cash rent
Percentage of workers working in this county: 98.3%Number of people working at home: 1,655 (9.9% of all workers )
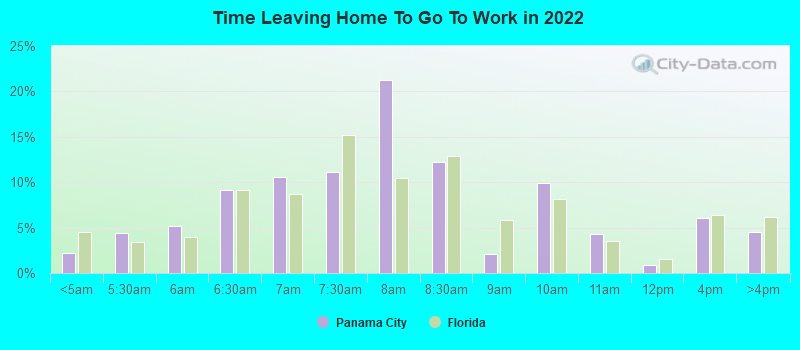
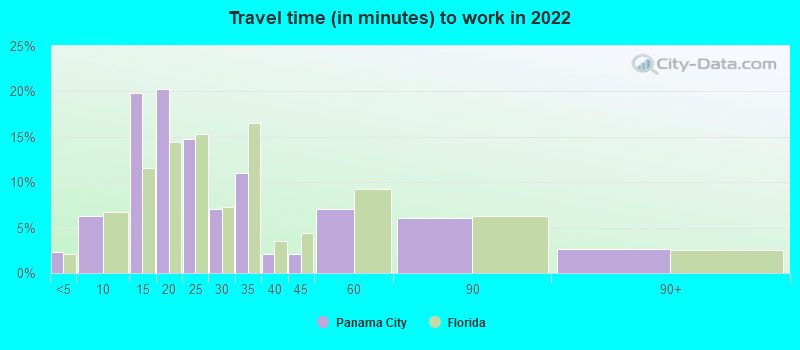
Travel time to work (commute)
Less than 5 minutes: 7245 to 9 minutes: 1,50310 to 14 minutes: 3,17315 to 19 minutes: 3,39720 to 24 minutes: 2,14825 to 29 minutes: 52730 to 34 minutes: 1,61935 to 39 minutes: 20540 to 44 minutes: 25445 to 59 minutes: 34260 to 89 minutes: 58390 or more minutes: 395
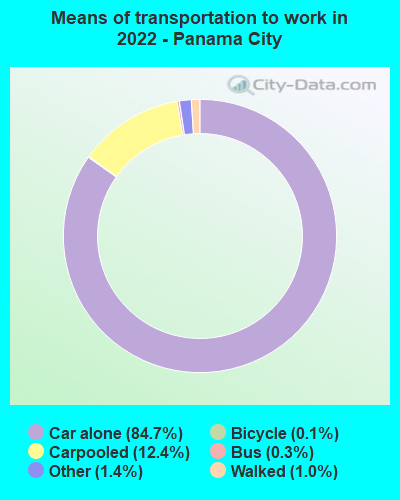
Means of transportation to work:
Drove a car alone: 25,654 (77.1%)Carpooled: 4,005 (12.0%)Bus : 75 (0.2%)Taxi: 482 (1.4%)Bicycle: 43 (0.1%)Walked: 318 (1.0%)Worked at home: 1,467 (4.4%)
Unemployment by race in 2022
Unemployment rate for White non-Hispanic residents 2.4% Males5.4% FemalesUnemployment rate for Black residents 4.6% Males10.3% FemalesUnemployment rate for two or more race residents 0.6% Males10.9% FemalesUnemployment rate for Hispanic or Latino residents 0.2% Males0.3% Females
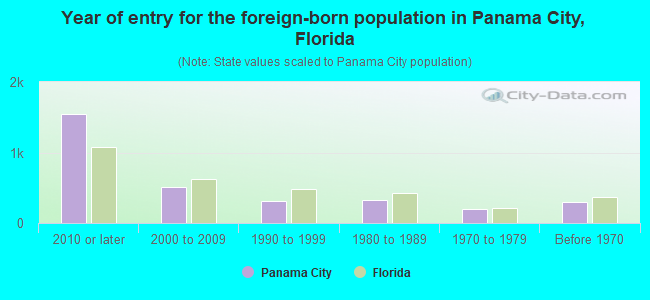
Year of entry for the foreign-born population in Panama City, Florida
1,544 2010 or later 513 2000 to 2009 313 1990 to 1999 323 1980 to 1989 192 1970 to 1979 301 Before 1970
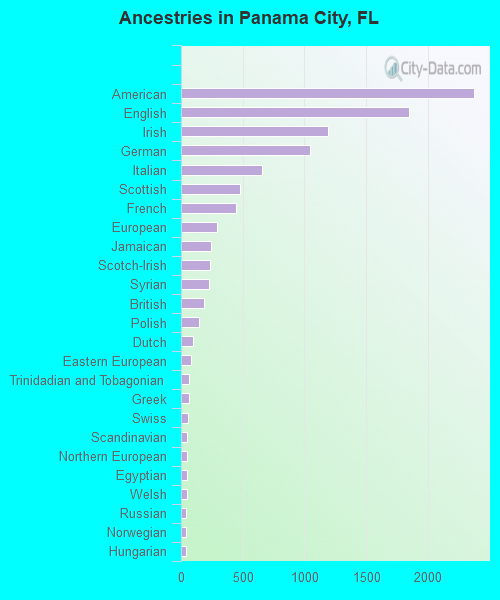
First ancestries reported:
American: 2,376 (12.8%)
English: 1,848 (10.0%)
Irish: 1,190 (6.4%)
German: 1,044 (5.6%)
Italian: 653 (3.5%)
Scottish: 479 (2.6%)
French: 445 (2.4%)
European: 291 (1.6%)
Jamaican: 244 (1.3%)
Scotch-Irish: 237 (1.3%)
Syrian: 228 (1.2%)
British: 184 (1.0%)
Polish: 146 (0.8%)
Dutch: 101 (0.5%)
Eastern European: 79 (0.4%)
Trinidadian and Tobagonian: 66 (0.4%)
Greek: 64 (0.3%)
Swiss: 58 (0.3%)
Scandinavian: 50 (0.3%)
Northern European: 49 (0.3%)
Egyptian: 47 (0.3%)
Welsh: 45 (0.2%)
Russian: 43 (0.2%)
Norwegian: 40 (0.2%)
Hungarian: 39 (0.2%)
French Canadian: 38 (0.2%)
African: 37 (0.2%)
Portuguese: 33 (0.2%)
Arab: 31 (0.2%)
Haitian: 30 (0.2%)
Lithuanian: 25 (0.1%)
Ukrainian: 19 (0.1%)
Icelander: 17 (0.09%)
Swedish: 17 (0.09%)
Lebanese: 16 (0.09%)
Romanian: 16 (0.09%)
Slavic: 14 (0.08%)
Danish: 13 (0.07%)
Belgian: 13 (0.07%)
West Indian: 11 (0.06%)
Czech: 10 (0.05%)
Czechoslovakian: 9 (0.05%)
Slovak: 9 (0.05%)
Finnish: 5 (0.03%) Most common places of birth for foreign-born residents (%): Mexico Panama City:
25.6% (676)Florida:
5.6% (257,152)
Jamaica Panama City:
16.3% (430)Florida:
5.0% (227,319)
Vietnam Panama City:
4.7% (123)Florida:
1.3% (60,604)
Honduras Panama City:
4.2% (111)Florida:
2.3% (107,160)
Philippines Panama City:
3.9% (104)Florida:
1.8% (84,403)
Nicaragua Panama City:
3.9% (103)Florida:
2.3% (105,066)
Germany Panama City:
3.3% (88)Florida:
1.2% (54,272)
Egypt Panama City:
3.2% (85)Florida:
0.3% (13,998)
Syria Panama City:
2.7% (71)Florida:
0.2% (7,299)
Trinidad and Tobago Panama City:
2.5% (66)Florida:
1.0% (43,642)
Guatemala Panama City:
2.5% (66)Florida:
2.1% (97,632)
Russia Panama City:
2.1% (56)Florida:
0.7% (31,076)
Korea Panama City:
2.0% (52)Florida:
0.4% (19,445)
Guyana Panama City:
1.9% (51)Florida:
0.7% (33,556)
Thailand Panama City:
1.6% (42)Florida:
0.3% (12,303)
England Panama City:
1.5% (40)Florida:
0.8% (37,723)
Place of birth for U.S.-born residents:
This state: 15,986Other state: 15,712Northeast: 2,724Midwest: 4,220South: 7,313West: 1,422 78.2% of Panama City residents lived in the same house 1 years ago.
Out of people who lived in different houses, 31.8% lived in this county.
Out of people who lived in different counties, 56.9% lived in Florida.
Panama City:
78.2%State average:
86.3%
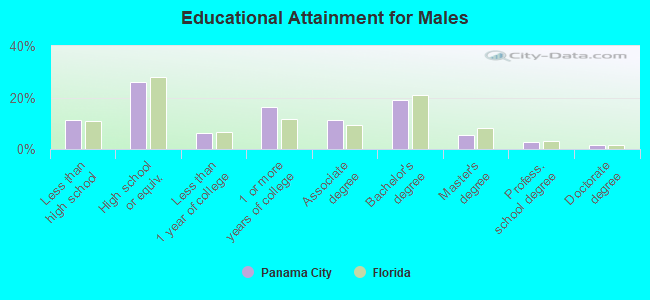
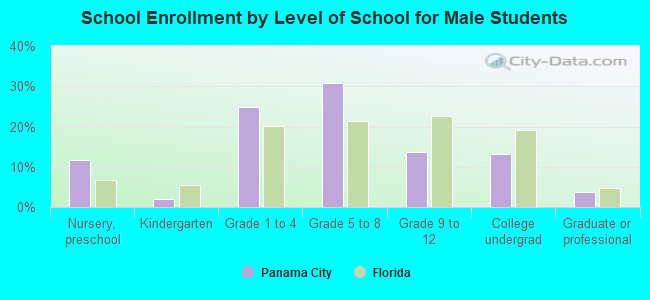
Education attainment for males 25 years and older:
No schooling: 292Nursery to 4th grade: 1085th and 6th grade: 587th and 8th grade: 889th grade: 11110th grade: 15011th grade: 22612th grade, no diploma: 226High school graduate (or equivalency): 2,873Less than 1 year of college: 679Some college more than 1 year, no degree: 1,803Associate degree: 1,242Bachelor's degree: 2,111Master's degree: 598Professional school degree: 321Doctorate degree: 155
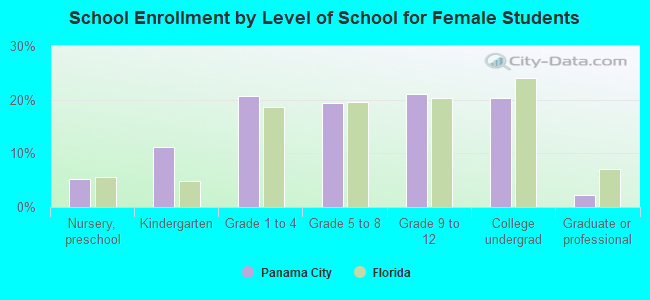
Education attainment for females 25 years and older:
No schooling: 134Nursery to 4th grade: 855th and 6th grade: 967th and 8th grade: 2469th grade: 13410th grade: 14311th grade: 11712th grade, no diploma: 147High school graduate (or equivalency): 3,536Less than 1 year of college: 949Some college more than 1 year, no degree: 2,385Associate degree: 1,744Bachelor's degree: 2,021Master's degree: 1,091Professional school degree: 168Doctorate degree: 187
Housing units in structures:
One, detached: 10,366One, attached: 915Two: 6903 or 4: 8815 to 9: 1,43810 to 19: 75420 to 49: 68050 or more: 649Mobile homes: 394Median worth of mobile homes: $54,261
Housing units lacking complete plumbing facilities in 2022: 2.2%Housing units lacking complete kitchen facilities in 2022: 3.0%House/condo owner moved in on average 9 years ago
Renter moved in on average 3 years ago
Private vs. public school enrollment:
Students in private schools in grades 1 to 8 (elementary and middle school): 517 Students in private schools in grades 9 to 12 (high school): 103 Students in private undergraduate colleges: 53