Paradise, CA (California) Houses and Residents
| Paradise: | $382,158 |
| California: | $715,900 |
Mean price in 2022:
Detached houses: $475,594
Here: $475,594 State: $988,808 Townhouses or other attached units: $396,127
Here: $396,127 State: $838,546 In 5-or-more-unit structures: $542,659
Here: $542,659 State: $730,996 Mobile homes: $196,248
Here: $196,248 State: $184,506 Occupied boats, RVs, vans, etc.: $77,873
Here: $77,873 State: $204,957
Total population: 26,449 (Urban population: 25,926 (all inside urban clusters), Rural population: 525 (all nonfarm))
Houses: 3,310 (2,990 occupied: 2,197 owner occupied, 786 renter occupied)
| % of renters here: | 26% |
| State: | 44% |
Housing density: 181 houses/condos per square mile
Median price asked for vacant for-sale houses and condos in 2022: $336,000.
Median contract rent in 2022: $1,039 (lower quartile is $825, upper quartile is $1,211)
Median rent asked for vacant for-rent units in 2022: $6,519
Median gross rent in Paradise, CA in 2022: $1,209
Housing units in Paradise with a mortgage: 1,061 (145 second mortgage, 0 home equity loan, 130 both second mortgage and home equity loan)
Houses without a mortgage: 0
Median household income for houses/condos with a mortgage: $92,048
Median household income for apartments without a mortgage: $32,946
Median monthly housing costs: $1,094
Compare current foreclosures in Paradise, CA:
| Photo | Address | Area | Beds / Baths | Price | Details |
|---|---|---|---|---|---|

|
#1
Pentz Rd
Paradise, CA 95969
|
1,674 sq. feet
|
2 baths 3 beds |
$379,900
|
show details |

|
#2
Wagstaff Rd
Paradise, CA 95969
|
1,296 sq. feet
|
2 baths 3 beds |
$13,467
|
show details |

|
#3
Stacy Ln/ptn Sec 27-22-3e
Paradise, CA 95969
|
1,111 sq. feet
|
2 baths 2 beds |
$22,865
|
show details |

|
#4
Rocky Ridge Ct
Paradise, CA 95969
|
1,250 sq. feet
|
2 baths 2 beds |
$10,190
|
show details |

|
#5
Drendel Cir
Paradise, CA 95969
|
1,237 sq. feet
|
1 baths 3 beds |
$17,100
|
show details |

|
#6
Duncombe Dr
Paradise, CA 95969
|
1,530 sq. feet
|
1 baths 2 beds |
$17,760
|
show details |

|
#7
W Wagstaff Rd
Paradise, CA 95969
|
1,150 sq. feet
|
1 baths 2 beds |
$12,183
|
show details |

|
#8
W Dottie Ln
Paradise, CA 95969
|
- sq. feet
|
2 baths 2 beds |
$26,397
|
show details |

|
#9
Acorn Ridge Dr
Paradise, CA 95969
|
2,856 sq. feet
|
4 baths 4 beds |
show details | |

|
#10
Matell Rd
Paradise, CA 95969
|
1,270 sq. feet
|
1 baths 2 beds |
show details |
| Photo | Address | Area | Beds / Baths | Price | Details |
|---|---|---|---|---|---|

|
#11
Crestwood Dr
Paradise, CA 95969
|
1,550 sq. feet
|
2 baths 3 beds |
show details | |

|
#12
Leicester Dr
Paradise, CA 95969
|
- sq. feet
|
- baths - beds |
$4,050
|
show details |

|
#13
Ac Sec 36 T20n R5e
Paradise, CA 95967
|
- sq. feet
|
- baths - beds |
$4,598
|
show details |

|
#14
Twin Pine Rd
Paradise, CA 95969
|
- sq. feet
|
- baths - beds |
$3,858
|
show details |

|
#15
Fremont Dr
Paradise, CA 95969
|
- sq. feet
|
- baths - beds |
$3,703
|
show details |

|
#16
Colter Ct
Paradise, CA 95969
|
- sq. feet
|
- baths - beds |
$4,050
|
show details |

|
#17
Carnegie Rd
Paradise, CA 95969
|
- sq. feet
|
- baths - beds |
$4,739
|
show details |

|
#18
Clarion Way
Paradise, CA 95969
|
- sq. feet
|
- baths - beds |
$3,409
|
show details |

|
#19
Dr
Paradise, CA 95969
|
- sq. feet
|
- baths - beds |
$1,753
|
show details |

|
#20
Del Rio Way
Paradise, CA 95969
|
1,282 sq. feet
|
1 baths 2 beds |
show details |
| Photo | Address | Area | Beds / Baths | Price | Details |
|---|---|---|---|---|---|

|
#21
Sanbar Ct
Paradise, CA 95969
|
- sq. feet
|
- baths - beds |
$6,591
|
show details |

|
#22
Gypsy Ln
Paradise, CA 95969
|
- sq. feet
|
- baths - beds |
$13,184
|
show details |

|
#23
Pearl Dr
Paradise, CA 95969
|
- sq. feet
|
- baths - beds |
$7,687
|
show details |

|
#24
Homestead Pl
Paradise, CA 95969
|
- sq. feet
|
- baths - beds |
$4,969
|
show details |

|
#25
Park Dr
Paradise, CA 95969
|
- sq. feet
|
- baths - beds |
$2,895
|
show details |

|
#26
Skyway
Paradise, CA 95969
|
- sq. feet
|
- baths - beds |
$13,123
|
show details |

|
#27
6 T21n R5e
Paradise, CA 95969
|
- sq. feet
|
- baths - beds |
$2,926
|
show details |

|
#28
Fawnbrook Pl
Paradise, CA 95969
|
- sq. feet
|
- baths - beds |
$9,349
|
show details |

|
#29
Merrill Rd
Paradise, CA 95969
|
- sq. feet
|
- baths - beds |
$10,193
|
show details |

|
#30
Pardes Way
Paradise, CA 95967
|
- sq. feet
|
- baths - beds |
$14,353
|
show details |
| Photo | Address | Area | Beds / Baths | Price | Details |
|---|---|---|---|---|---|

|
#31
Pardes Way
Paradise, CA 95969
|
- sq. feet
|
- baths - beds |
$29,493
|
show details |

|
#32
Skyway
Paradise, CA 95969
|
1,332 sq. feet
|
2 baths 2 beds |
show details | |

|
#33
Pearson Rd Apt C
Paradise, CA 95969
|
- sq. feet
|
- baths - beds |
show details | |

|
#34
Shadowbrook Way Apt 16
Paradise, CA 95969
|
- sq. feet
|
- baths - beds |
show details | |

|
#35
Pearl Dr
Paradise, CA 95969
|
- sq. feet
|
- baths - beds |
show details | |

|
Check over 1 million property listings on Foreclosure.com!
|
browse all offers | |||

Latest news about housing in Paradise, CA collected exclusively by city-data.com from local newspapers, TV, and radio stations


Median year apartment built: 1977
Household type by relationship:
Households: 6,469- Male householders: 1,250 (471 living alone), Female householders: 1,674 (531 living alone)
1,311 spouses (1,311 opposite-sex spouses), 160 unmarried partners, (160 opposite-sex unmarried partners), 1,328 children (1,151 natural, 20 adopted, 157 stepchildren), 83 grandchildren, 38 brothers or sisters, 31 parents, 0 foster children, 112 other relatives, 44 non-relatives
- In group quarters: 434
Size of family households: 1,037 2-persons, 369 3-persons, 154 4-persons, 102 5-persons.
Size of nonfamily households: 1,124 1-person, 163 2-persons.
772 married couples with children.
162 single-parent households (124 men, 38 women).
93.1% of residents of Paradise speak English at home.
5.5% of residents speak Spanish at home (73% speak English very well, 14% speak English well, 10% speak English not well, 3% don't speak English at all).
0.5% of residents speak other Indo-European language at home (100% speak English very well).
1.5% of residents speak Asian or Pacific Island language at home (5% speak English very well, 52% speak English well, 35% speak English not well, 8% don't speak English at all).
Foreign born population: 290 (4.5%)
(43.4% of them are naturalized citizens)
| Here: | 5.4 |
| State: | 6.0 |
| Here: | 4.2 |
| State: | 3.9 |

- Bedrooms in owner-occupied houses and condos in Paradise, California
- 9no bedroom
- 1901 bedroom
- 8252 bedrooms
- 8953 bedrooms
- 2554 bedrooms
- 235+ bedrooms

- Bedrooms in renter-occupied apartments in Paradise, California
- 0no bedroom
- 3321 bedroom
- 3002 bedrooms
- 1283 bedrooms
- 274 bedrooms
- 05+ bedrooms

- Cars and other vehicles available in Paradise in owner-occupied houses/condos
- 168no vehicle
- 6731 vehicle
- 6842 vehicles
- 4953 vehicles
- 1204 vehicles
- 565+ vehicles

- Cars and other vehicles available in Paradise in renter-occupied apartments
- 100no vehicle
- 4021 vehicle
- 2052 vehicles
- 523 vehicles
- 274 vehicles
- 05+ vehicles

- Rooms in owner-occupied houses in Paradise, California
- 91 room
- 712 rooms
- 733 rooms
- 4154 rooms
- 6645 rooms
- 3396 rooms
- 3077 rooms
- 1038 rooms
- 2169+ rooms

- Rooms in renter-occupied apartments in Paradise, California
- 01 room
- 882 rooms
- 1503 rooms
- 2414 rooms
- 2035 rooms
- 606 rooms
- 327 rooms
- 128 rooms
- 09+ rooms


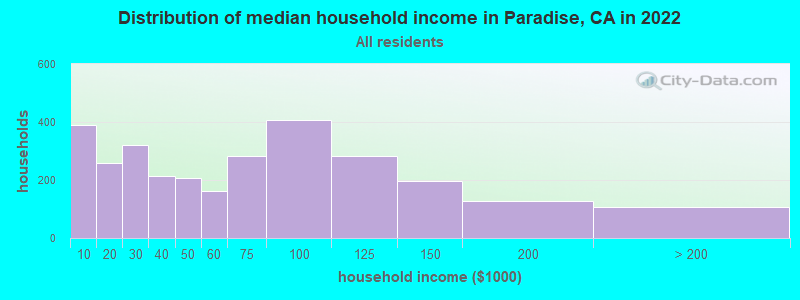
Paradise, CA household income distribution

- 388Less than $10,000
- 257$10,000 to $19,999
- 320$20,000 to $29,999
- 215$30,000 to $39,999
- 206$40,000 to $49,999
- 161$50,000 to $59,999
- 282$60,000 to $74,999
- 406$75,000 to $99,999
- 283$100,000 to $124,999
- 198$125,000 to $149,999
- 126$150,000 to $199,999
- 107$200,000 or more
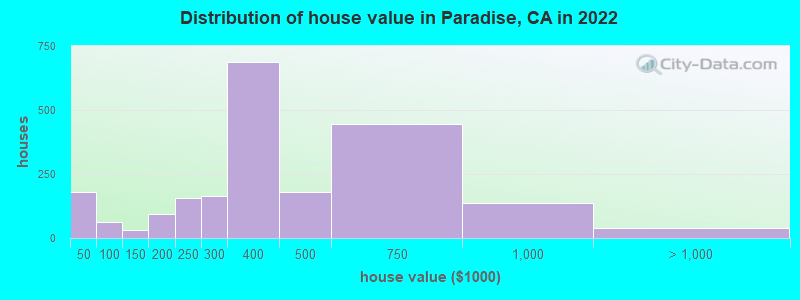
Home value of owner - occupied houses in 2022 in Paradise, CA
-
- 59Less than $10,000
- 11$10,000 to $14,999
- 11$15,000 to $19,999
- 7$20,000 to $24,999
- 12$25,000 to $29,999
- 69$35,000 to $39,999
- 7$40,000 to $49,999
- 28$50,000 to $59,999
- 25$80,000 to $89,999
- 13$100,000 to $124,999
- 19$125,000 to $149,999
- 16$150,000 to $174,999
- 76$175,000 to $199,999
- 155$200,000 to $249,999
- 163$250,000 to $299,999
- 689$300,000 to $399,999
- 178$400,000 to $499,999
- 443$500,000 to $749,999
- 137$750,000 to $999,999
- 33$1,000,000 to $1,499,999
- 4$2,000,000 or more
Rent paid by renters in 2022 in Paradise, CA
-
- 41$500 to $549
- 20$550 to $599
- 83$600 to $649
- 22$650 to $699
- 8$700 to $749
- 60$800 to $899
- 94$900 to $999
- 261$1,000 to $1,249
- 62$1,250 to $1,499
- 32$1,500 to $1,999
- 71$2,000 to $2,499
- 28$3,500 or more
- 21No cash rent


Percentage of workers working in this county: 93.3%
Number of people working at home: 323 (17.1% of all workers)
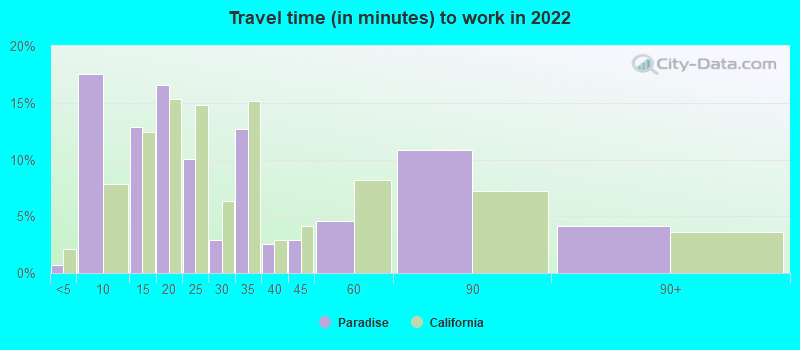
Travel time to work (commute)
- Less than 5 minutes: 0
- 5 to 9 minutes: 338
- 10 to 14 minutes: 168
- 15 to 19 minutes: 178
- 20 to 24 minutes: 168
- 25 to 29 minutes: 214
- 30 to 34 minutes: 235
- 35 to 39 minutes: 16
- 40 to 44 minutes: 0
- 45 to 59 minutes: 62
- 60 to 89 minutes: 31
- 90 or more minutes: 63
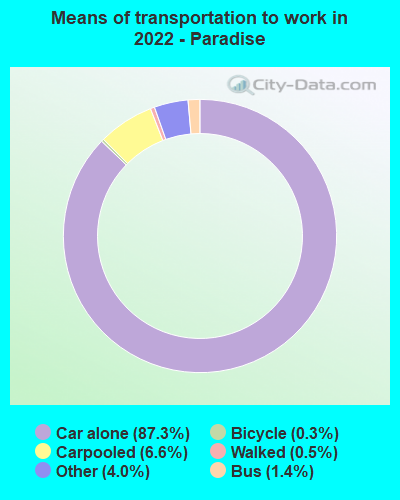
Means of transportation to work:
- Drove a car alone: 2,875 (78.9%)
- Carpooled: 223 (6.1%)
- Bus: 22 (0.6%)
- Taxi: 107 (2.9%)
- Bicycle: 6 (0.2%)
- Walked: 17 (0.5%)
- Worked at home: 323 (8.9%)

- Unemployment by race in 2022
- Unemployment rate for White non-Hispanic residents
- 7.0%Males
- 0.6%Females
- Unemployment rate for two or more race residents
- 31.1%Females

- Year of entry for the foreign-born population in Paradise, California
- 1292010 or later
- 252000 to 2009
- 371990 to 1999
- 1731980 to 1989
- 821970 to 1979
- 643Before 1970

First ancestries reported:
- American: 666 (21.7%)
- Irish: 359 (11.7%)
- English: 349 (11.4%)
- German: 131 (4.3%)
- Italian: 117 (3.8%)
- European: 100 (3.3%)
- Scottish: 64 (2.1%)
- Scandinavian: 39 (1.3%)
- Greek: 23 (0.7%)
- Northern European: 19 (0.6%)
- Scotch-Irish: 17 (0.6%)
- Dutch: 14 (0.5%)
- Norwegian: 14 (0.5%)
- Portuguese: 13 (0.4%)
- Yugoslavian: 11 (0.4%)
- Belgian: 10 (0.3%)
- French: 10 (0.3%)
- Eastern European: 9 (0.3%)
- Hungarian: 9 (0.3%)
- Pennsylvania German: 7 (0.2%)
- Swiss: 6 (0.2%)
- Ukrainian: 5 (0.2%)
- Welsh: 4 (0.1%)
- Finnish: 3 (0.10%)
- British: 2 (0.07%)
- Swedish: 2 (0.07%)
- Canadian: 1 (0.03%)
Most common places of birth for foreign-born residents (%):
| Paradise: | 60.3% (173) |
| California: | 37.2% (3,881,193) |
| Paradise: | 9.8% (28) |
| California: | 7.8% (818,297) |
| Paradise: | 4.2% (12) |
| California: | 3.0% (315,248) |
| Paradise: | 3.8% (11) |
| California: | 0.7% (73,304) |
| Paradise: | 3.8% (11) |
| California: | 0.5% (55,249) |
| Paradise: | 3.5% (10) |
| California: | 0.3% (31,439) |
| Paradise: | 3.5% (10) |
| California: | 5.2% (539,184) |
| Paradise: | 3.1% (9) |
| California: | 0.0% (4,300) |
| Paradise: | 2.8% (8) |
| California: | 0.1% (10,936) |
| Paradise: | 2.4% (7) |
| California: | 6.6% (684,672) |
Place of birth for U.S.-born residents:
- This state: 4,549
- Other state: 1,486
- Northeast: 189
- Midwest: 381
- South: 283
- West: 636
83.8% of Paradise residents lived in the same house 1 years ago.
Out of people who lived in different houses, 31.3% lived in this county.
Out of people who lived in different counties, 84.1% lived in California.
| Paradise: | 83.8% |
| State average: | 88.9% |
Education attainment for males 25 years and older:
- No schooling: 58
- Nursery to 4th grade: 0
- 5th and 6th grade: 0
- 7th and 8th grade: 3
- 9th grade: 12
- 10th grade: 59
- 11th grade: 26
- 12th grade, no diploma: 49
- High school graduate (or equivalency): 667
- Less than 1 year of college: 272
- Some college more than 1 year, no degree: 573
- Associate degree: 142
- Bachelor's degree: 527
- Master's degree: 57
- Professional school degree: 46
- Doctorate degree: 50

Education attainment for females 25 years and older:
- No schooling: 76
- Nursery to 4th grade: 1
- 5th and 6th grade: 18
- 7th and 8th grade: 17
- 9th grade: 4
- 10th grade: 62
- 11th grade: 5
- 12th grade, no diploma: 15
- High school graduate (or equivalency): 645
- Less than 1 year of college: 240
- Some college more than 1 year, no degree: 351
- Associate degree: 391
- Bachelor's degree: 538
- Master's degree: 104
- Professional school degree: 20
- Doctorate degree: 15


Housing units in structures:
- One, detached: 2,175
- One, attached: 167
- Two: 101
- 3 or 4: 209
- 5 to 9: 125
- 10 to 19: 48
- 20 to 49: 60
- 50 or more: 13
- Mobile homes: 372
- Boats, RVs, vans, etc.: 36
Housing units lacking complete kitchen facilities in 2022: 3.8%
House/condo owner moved in on average 11 years ago
Renter moved in on average 5 years ago

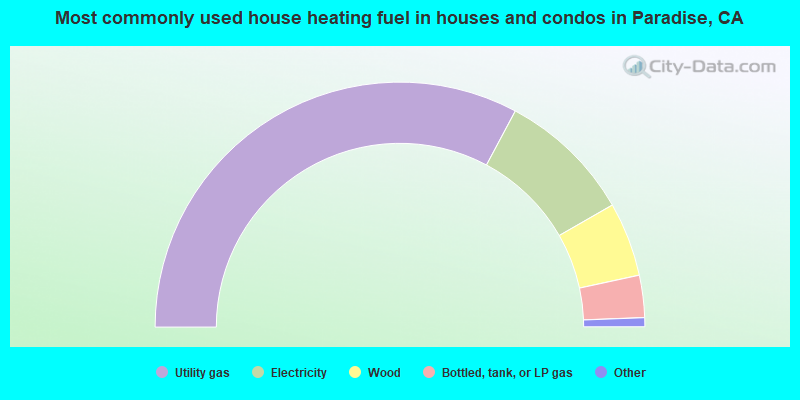
- 65.7%Utility gas
- 17.8%Electricity
- 9.8%Wood
- 5.6%Bottled, tank, or LP gas
- 0.9%No fuel used
- 0.2%Solar energy
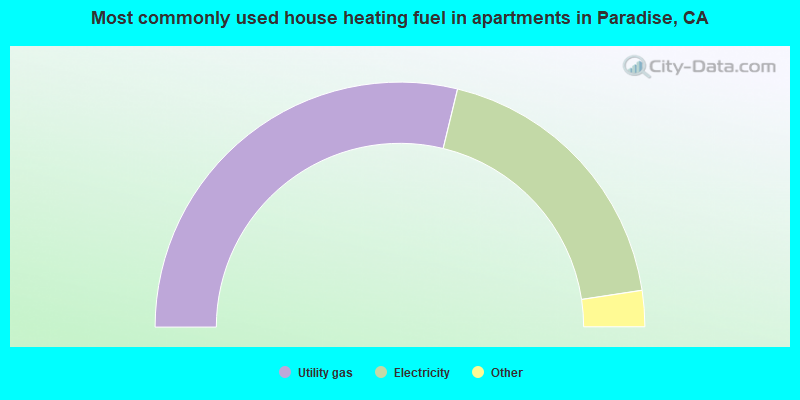
- 57.7%Utility gas
- 37.7%Electricity
- 2.3%Wood
- 1.8%Bottled, tank, or LP gas
- 0.6%Solar energy
Private vs. public school enrollment:
| Here: | 15.7% |
| California: | 10.5% |
| Here: | 11.1% |
| California: | 8.5% |
| Here: | 3.1% |
| California: | 15.9% |


