Park City, IL (Illinois) Houses and Residents
Estimated median house or condo value in 2022: $25,601 (it was $19,200 in 2000 )
Park City:
$25,601Illinois:
$251,600
Lower value quartile - upper value quartile: $12,715 - $-670,728,404Mean price in 2022: Detached houses: $210,430 Here:
$210,430State:
$310,164
Mobile homes: $29,228 Here:
$29,228State:
$78,855
Total population: 7,440 (Urban population: 6,952, Rural population: 0)
Houses: 2,669 (2,562 occupied: 1,416 owner occupied, 1,194 renter occupied )
% of renters here:
46%State:
33%
Housing density: 2,322 houses/condos per square mile
Median price asked for vacant for-sale houses and condos in 2022 in this county: $314,142.
Median contract rent in 2022: $866 (lower quartile is $840, upper quartile is $980)
Median rent asked for vacant for-rent units in 2022: $908
Median gross rent in Park City, IL in 2022: $1,104
Housing units in Park City with a mortgage: 376 (7 second mortgage, 0 home equity loan, 7 both second mortgage and home equity loan )Houses without a mortgage: 12
Median household income for houses/condos with a mortgage: $75,558
Median household income for apartments without a mortgage: $57,080
Median monthly housing costs: $1,001
Data:
Median house or condo value ($)
Median house or condo value ($ change since 2000)
Median house or condo value ($) - White
Median house or condo value ($) - Black or African American
Median house or condo value ($) - Asian
Median house or condo value ($) - Hispanic or Latino
Median house or condo value ($) - American Indian and Alaska Native
Median house or condo value ($) - Multirace
Median house or condo value ($) - Other Race
Median price asked for mobile homes ($)
Household density (households per square mile)
Mean house or condo value by units in structure - 1, detached ($)
Mean house or condo value by units in structure - 1, attached ($)
Mean house or condo value by units in structure - 2 ($)
Mean house or condo value by units in structure by units in structure - 3 or 4 ($)
Mean house or condo value by units in structure - 5 or more ($)
Mean house or condo value by units in structure - Boat, RV, van, etc. ($)
Mean house or condo value by units in structure - Mobile home ($)
Median contract rent ($)
Median contract rent - Lower quartile ($)
Median contract rent - Upper quartile ($)
Median gross rent ($)
Urban houses (%)
Rural houses (%)
Houses occupied (%)
Houses occupied (% change since 2000)
Houses owner occupied (%)
Houses owner occupied (% change since 2000)
Houses renter occupied (%)
Houses renter occupied (% change since 2000)
Vacant housing units - For rent (%)
Vacant housing units - For rent (% change since 2000)
Vacant housing units - For sale only (%)
Vacant housing units - For sale only (% change since 2000)
Vacant housing units - Rented or sold, not occupied (%)
Vacant housing units - Rented or sold, not occupied (% change since 2000)
Vacant housing units - For seasonal, recreational, or occasional use (%)
Vacant housing units - For seasonal, recreational, or occasional use (% change since 2000)
Vacant housing units - For migrant workers (%)
Vacant housing units - For migrant workers (% change since 2000)
Vacant housing units - Other vacant (%)
Vacant housing units - Other vacant (% change since 2000)
Median monthly housing costs ($)
Median household income for houses/condos with a mortgage ($)
Median household income for houses/condos without a mortgage ($)
Median household income ($)
Median household income ($) - White
Median household income ($) - Black or African American
Median household income ($) - Asian
Median household income ($) - Hispanic or Latino
Median household income ($) - American Indian and Alaska Native
Median household income ($) - Multirace
Median household income ($) - Other Race
Mortgage status - with mortgage (%)
Mortgage status - with second mortgage (%)
Mortgage status - with home equity loan (%)
Mortgage status - with both second mortgage and home equity loan (%)
Mortgage status - without a mortgage (%)
Median year house/condo built
Median year apartment built
Household type by relationship - Male householder living alone (%)
Household type by relationship - Male householder not living alone (%)
Household type by relationship - Female householder living alone (%)
Household type by relationship - Female householder not living alone (%)
Household type by relationship - Opposite-Sex spouse (%)
Household type by relationship - Same-Sex spouse (%)
Household type by relationship - Opposite-Sex unmarried partner (%)
Household type by relationship - Same-Sex unmarried partner (%)
Household type by relationship - In group quarters (%)
Size of family households - 2-person household (%)
Size of family households - 3-person household (%)
Size of family households - 4-person household (%)
Size of family households - 5-person household (%)
Size of family households - 6-person household (%)
Size of family households - 7-or-more-person household (%)
Size of nonfamily households - 1-person household (%)
Size of nonfamily households - 2-person household (%)
Size of nonfamily households - 3-person household (%)
Size of nonfamily households - 4-person household (%)
Size of nonfamily households - 5-person household (%)
Size of nonfamily households - 6-person household (%)
Size of nonfamily households - 7-or-moreperson household (%)
Year house built - Built 2010 or later (%)
Year house built - Built 2000 to 2009 (%)
Year house built - Built 1990 to 1999 (%)
Year house built - Built 1980 to 1989 (%)
Year house built - Built 1970 to 1979 (%)
Year house built - Built 1960 to 1969 (%)
Year house built - Built 1950 to 1959 (%)
Year house built - Built 1940 to 1949 (%)
Year house built - Built 1939 or earlier (%)
Median number of rooms in houses and condos
Median number of rooms in apartments
Median number of bedrooms in owner occupied houses
Mean number of bedrooms in owner occupied houses
Median number of bedrooms in renter occupied houses
Mean number of bedrooms in renter occupied houses
Median number of vehichles in owner occupied houses
Mean number of vehichles in owner occupied houses
Median number of vehichles in renter occupied houses
Mean number of vehichles in renter occupied houses
Rooms in owner-occupied houses - 1 room (%)
Rooms in owner-occupied houses - 2 rooms (%)
Rooms in owner-occupied houses - 3 rooms (%)
Rooms in owner-occupied houses - 4 rooms (%)
Rooms in owner-occupied houses - 5 rooms (%)
Rooms in owner-occupied houses - 6 rooms (%)
Rooms in owner-occupied houses - 7 rooms (%)
Rooms in owner-occupied houses - 8 rooms (%)
Rooms in owner-occupied houses - 9+ rooms (%)
Rooms in renter-occupied houses - 1 room (%)
Rooms in renter-occupied houses - 2 rooms (%)
Rooms in renter-occupied houses - 3 rooms (%)
Rooms in renter-occupied houses - 4 rooms (%)
Rooms in renter-occupied houses - 5 rooms (%)
Rooms in renter-occupied houses - 6 rooms (%)
Rooms in renter-occupied houses - 7 rooms (%)
Rooms in renter-occupied houses - 8 rooms (%)
Rooms in renter-occupied houses - 9+ rooms (%)
Bedrooms in owner-occupied houses - no bedrooms (%)
Bedrooms in owner-occupied houses - 1 bedroom (%)
Bedrooms in owner-occupied houses - 2 bedrooms (%)
Bedrooms in owner-occupied houses - 3 bedrooms (%)
Bedrooms in owner-occupied houses - 4 bedrooms (%)
Bedrooms in owner-occupied houses - 5+ bedrooms (%)
Bedrooms in renter-occupied houses - no bedrooms (%)
Bedrooms in renter-occupied houses - 1 bedroom (%)
Bedrooms in renter-occupied houses - 2 bedrooms (%)
Bedrooms in renter-occupied houses - 3 bedrooms (%)
Bedrooms in renter-occupied houses - 4 bedrooms (%)
Bedrooms in renter-occupied houses - 5+ bedrooms (%)
Vehicles available in owner-occupied houses - no vehicle available (%)
Vehicles available in owner-occupied houses - 1 vehicle available(%)
Vehicles available in owner-occupied houses - 2 Vehicles available (%)
Vehicles available in owner-occupied houses - 3 Vehicles available (%)
Vehicles available in owner-occupied houses - 4 Vehicles available (%)
Vehicles available in owner-occupied houses - 5+ Vehicles available (%)
Vehicles available in renter-occupied houses - no vehicle available (%)
Vehicles available in renter-occupied houses - 1 vehicle available (%)
Vehicles available in renter-occupied houses - 2 Vehicles available (%)
Vehicles available in renter-occupied houses - 3 Vehicles available (%)
Vehicles available in renter-occupied houses - 4 Vehicles available (%)
Vehicles available in renter-occupied houses - 5+ Vehicles available (%)
Housing units in structures - 1, detached (%)
Housing units in structures - 1, attached (%)
Housing units in structures - 2 (%)
Housing units in structures - 3 or 4 (%)
Housing units in structures - 5 to 9 (%)
Housing units in structures - 10 to 19 (%)
Housing units in structures - 20 to 49 (%)
Housing units in structures - 50 or more (%)
Housing units in structures - Mobile home (%)
Housing units in structures - Boat, RV, van, etc. (%)
Housing units in structures - Owners - 1, detached (%)
Housing units in structures - Owners - 1, attached (%)
Housing units in structures - Owners - 2 (%)
Housing units in structures - Owners - 3 or 4 (%)
Housing units in structures - Owners - 5 to 9 (%)
Housing units in structures - Owners - 10 to 19 (%)
Housing units in structures - Owners - 20 to 49 (%)
Housing units in structures - Owners - 50 or more (%)
Housing units in structures - Owners - Mobile home (%)
Housing units in structures - Owners - Boat, RV, van, etc. (%)
Housing units in structures - Renters - 1, detached (%)
Housing units in structures - Renters - 1, attached (%)
Housing units in structures - Renters - 2 (%)
Housing units in structures - Renters - 3 or 4 (%)
Housing units in structures - Renters - 5 to 9 (%)
Housing units in structures - Renters - 10 to 19 (%)
Housing units in structures - Renters - 20 to 49 (%)
Housing units in structures - Renters - 50 or more (%)
Housing units in structures - Renters - Mobile home (%)
Housing units in structures - Renters - Boat, RV, van, etc. (%)
House/condo owner moved in on average (years ago)
Renter moved in on average (years ago)
Year householder moved into unit - Moved in 1999 to March 2000 (%)
Year householder moved into unit - Moved in 1999 to March 2000 (%) - White
Year householder moved into unit - Moved in 1999 to March 2000 (%) - Black or African American
Year householder moved into unit - Moved in 1999 to March 2000 (%) - Asian
Year householder moved into unit - Moved in 1999 to March 2000 (%) - Hispanic or Latino
Year householder moved into unit - Moved in 1999 to March 2000 (%) - American Indian and Alaska Native
Year householder moved into unit - Moved in 1999 to March 2000 (%) - Multirace
Year householder moved into unit - Moved in 1999 to March 2000 (%) - Other Race
Year householder moved into unit - Moved in 1995 to 1998 (%)
Year householder moved into unit - Moved in 1995 to 1998 (%) - White
Year householder moved into unit - Moved in 1995 to 1998 (%) - Black or African American
Year householder moved into unit - Moved in 1995 to 1998 (%) - Asian
Year householder moved into unit - Moved in 1995 to 1998 (%) - Hispanic or Latino
Year householder moved into unit - Moved in 1995 to 1998 (%) - American Indian and Alaska Native
Year householder moved into unit - Moved in 1995 to 1998 (%) - Multirace
Year householder moved into unit - Moved in 1995 to 1998 (%) - Other Race
Year householder moved into unit - Moved in 1990 to 1994 (%)
Year householder moved into unit - Moved in 1990 to 1994 (%) - White
Year householder moved into unit - Moved in 1990 to 1994 (%) - Black or African American
Year householder moved into unit - Moved in 1990 to 1994 (%) - Asian
Year householder moved into unit - Moved in 1990 to 1994 (%) - Hispanic or Latino
Year householder moved into unit - Moved in 1990 to 1994 (%) - American Indian and Alaska Native
Year householder moved into unit - Moved in 1990 to 1994 (%) - Multirace
Year householder moved into unit - Moved in 1990 to 1994 (%) - Other Race
Year householder moved into unit - Moved in 1980 to 1989 (%)
Year householder moved into unit - Moved in 1980 to 1989 (%) - White
Year householder moved into unit - Moved in 1980 to 1989 (%) - Black or African American
Year householder moved into unit - Moved in 1980 to 1989 (%) - Asian
Year householder moved into unit - Moved in 1980 to 1989 (%) - Hispanic or Latino
Year householder moved into unit - Moved in 1980 to 1989 (%) - American Indian and Alaska Native
Year householder moved into unit - Moved in 1980 to 1989 (%) - Multirace
Year householder moved into unit - Moved in 1980 to 1989 (%) - Other Race
Year householder moved into unit - Moved in 1970 to 1979 (%)
Year householder moved into unit - Moved in 1970 to 1979 (%) - White
Year householder moved into unit - Moved in 1970 to 1979 (%) - Black or African American
Year householder moved into unit - Moved in 1970 to 1979 (%) - Asian
Year householder moved into unit - Moved in 1970 to 1979 (%) - Hispanic or Latino
Year householder moved into unit - Moved in 1970 to 1979 (%) - American Indian and Alaska Native
Year householder moved into unit - Moved in 1970 to 1979 (%) - Multirace
Year householder moved into unit - Moved in 1970 to 1979 (%) - Other Race
Year householder moved into unit - Moved in 1969 or earlier (%)
Year householder moved into unit - Moved in 1969 or earlier (%) - White
Year householder moved into unit - Moved in 1969 or earlier (%) - Black or African American
Year householder moved into unit - Moved in 1969 or earlier (%) - Asian
Year householder moved into unit - Moved in 1969 or earlier (%) - Hispanic or Latino
Year householder moved into unit - Moved in 1969 or earlier (%) - American Indian and Alaska Native
Year householder moved into unit - Moved in 1969 or earlier (%) - Multirace
Year householder moved into unit - Moved in 1969 or earlier (%) - Other Race
Housing units lacking complete plumbing facilities (%)
Housing units lacking complete kitchen facilities (%)
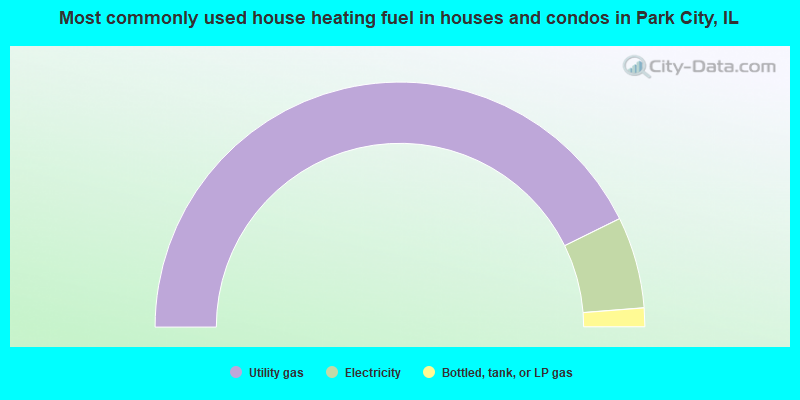
House heating fuel used in houses and condos - Utility gas (%)
House heating fuel used in houses and condos - Bottled, tank, or LP gas (%)
House heating fuel used in houses and condos - Electricity (%)
House heating fuel used in houses and condos - Fuel oil, kerosene, etc. (%)
House heating fuel used in houses and condos - Coal or coke (%)
House heating fuel used in houses and condos - Wood (%)
House heating fuel used in houses and condos - Solar energy (%)
House heating fuel used in houses and condos - Other fuel (%)
House heating fuel used in houses and condos - No fuel used (%)
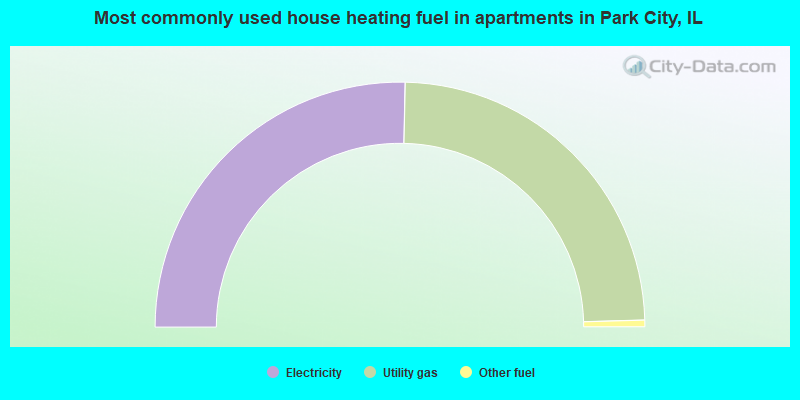
House heating fuel used in apartments - Utility gas (%)
House heating fuel used in apartments - Bottled, tank, or LP gas (%)
House heating fuel used in apartments - Electricity (%)
House heating fuel used in apartments - Fuel oil, kerosene, etc. (%)
House heating fuel used in apartments - Coal or coke (%)
House heating fuel used in apartments - Wood (%)
House heating fuel used in apartments - Solar energy (%)
House heating fuel used in apartments - Other fuel (%)
House heating fuel used in apartments - No fuel used (%)
Median year house/condo built: 1986Median year apartment built: 1986Household type by relationship:
Households: 7,658
Male householders: 1,349 (278 living alone ), Female householders: 1,187 (265 living alone )952 spouses (952 opposite-sex spouses ), 288 unmarried partners , (288 opposite-sex unmarried partners ), 2,835 children (2,710 natural , 63 adopted , 61 stepchildren ), 301 grandchildren , 229 brothers or sisters , 148 parents , 0 foster children , 95 other relatives , 270 non-relatives
Size of family households: 665 2-persons , 352 3-persons , 429 4-persons , 299 5-persons , 7 6-persons , 111 7-or-more-persons .
Size of nonfamily households: 574 1-person , 88 2-persons , 36 3-persons .
752 married couples with children. single-parent households (294 men , 464 women ).
27.5% of residents of Park City speak English at home. of residents speak Spanish at home (60% speak English very well , 18% speak English well , 17% speak English not well , 4% don't speak English at all ).of residents speak other Indo-European language at home (100% speak English very well ).of residents speak Asian or Pacific Island language at home (49% speak English very well , 36% speak English well , 15% speak English not well ).of residents speak other language at home (86% speak English very well , 14% speak English well ).
Foreign born population: 2,852 (37.2%)of them are naturalized citizens )
Median number of rooms in houses and condos:
Median number of rooms in apartments
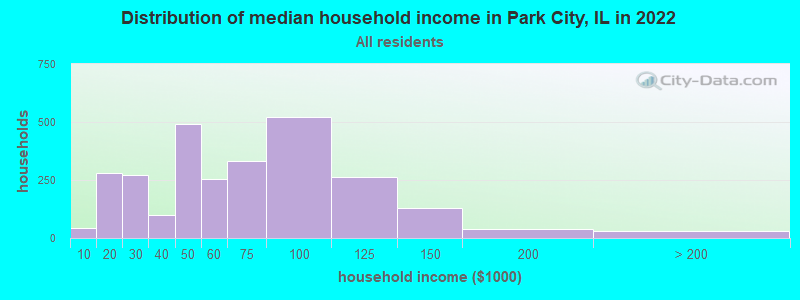
Park City, IL household income distribution 42 Less than $10,000281 $10,000 to $19,999272 $20,000 to $29,99999 $30,000 to $39,999491 $40,000 to $49,999253 $50,000 to $59,999331 $60,000 to $74,999520 $75,000 to $99,999262 $100,000 to $124,999128 $125,000 to $149,99938 $150,000 to $199,99930 $200,000 or more
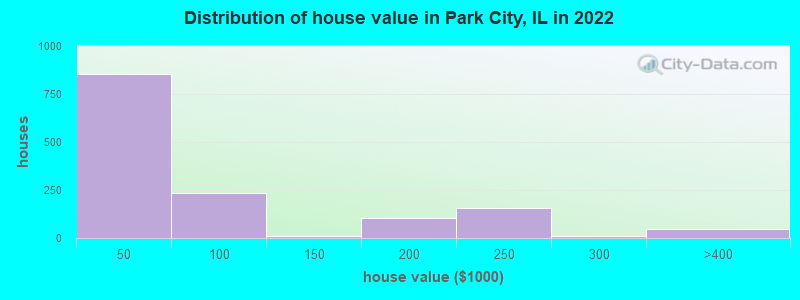
Home value of owner - occupied houses in 2022 in Park City, IL 342 Less than $10,00066 $10,000 to $14,999129 $15,000 to $19,999214 $20,000 to $24,99977 $25,000 to $29,99914 $30,000 to $34,9999 $35,000 to $39,999115 $50,000 to $59,999100 $70,000 to $79,9998 $80,000 to $89,9998 $90,000 to $99,99912 $125,000 to $149,99915 $150,000 to $174,99988 $175,000 to $199,999156 $200,000 to $249,99910 $250,000 to $299,99948 $300,000 to $399,999Rent paid by renters in 2022 in Park City, IL 10 Less than $10068 $550 to $59912 $650 to $69966 $700 to $74939 $750 to $799384 $800 to $899202 $900 to $999172 $1,000 to $1,24959 $1,250 to $1,49933 $1,500 to $1,99918 No cash rent
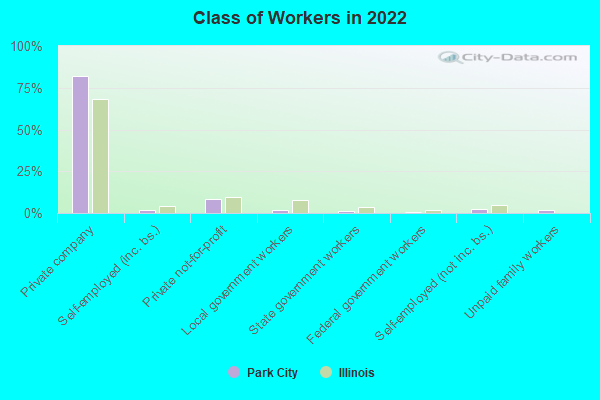
Percentage of workers working in this county: 83.6%Number of people working at home: 122 (3.1% of all workers )
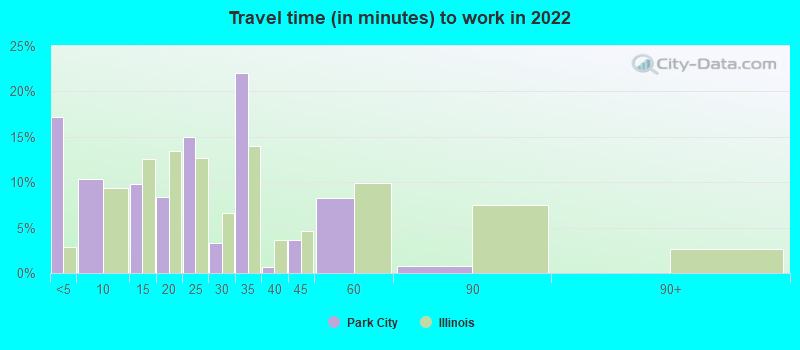
Travel time to work (commute)
Less than 5 minutes: 2605 to 9 minutes: 50510 to 14 minutes: 46915 to 19 minutes: 52620 to 24 minutes: 59925 to 29 minutes: 31430 to 34 minutes: 29835 to 39 minutes: 26340 to 44 minutes: 12845 to 59 minutes: 15560 to 89 minutes: 16590 or more minutes: 59
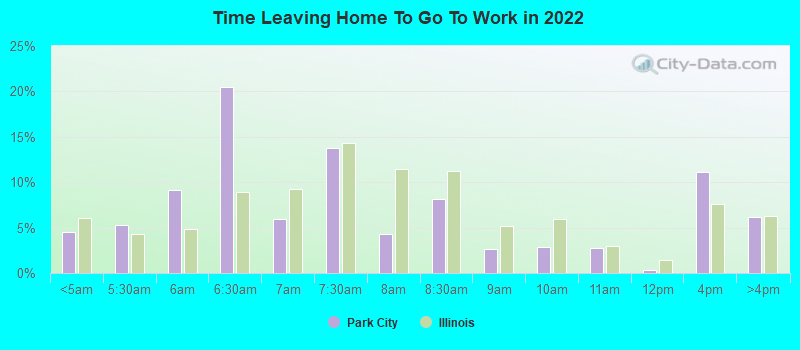
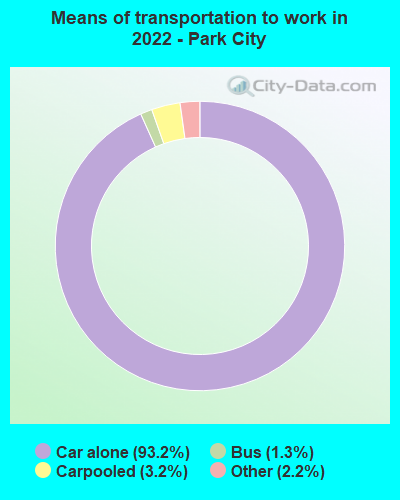
Means of transportation to work:
Drove a car alone: 1,077 (82.2%)Carpooled: 37 (2.8%)Bus : 16 (1.2%)Taxi: 26 (2.0%)Worked at home: 122 (9.3%)
Unemployment by race in 2022
Unemployment rate for Black residents 10.2% FemalesUnemployment rate for American Indian and Alaska Native residents 35.1% MalesUnemployment rate for other race residents 1.3% MalesUnemployment rate for two or more race residents 4.4% MalesUnemployment rate for Hispanic or Latino residents 4.6% Males7.3% Females
Year of entry for the foreign-born population in Park City, Illinois
469 2010 or later 759 2000 to 2009 1,094 1990 to 1999 593 1980 to 1989 223 1970 to 1979 66 Before 1970
First ancestries reported:
American: 218 (4.0%)
German: 93 (1.7%)
Irish: 61 (1.1%)
Polish: 54 (1.0%)
Belizean: 50 (0.9%)
Nigerian: 40 (0.7%)
Swedish: 30 (0.6%)
Guyanese: 25 (0.5%)
Finnish: 18 (0.3%)
Russian: 8 (0.1%)
Italian: 7 (0.1%)
British: 6 (0.1%) Most common places of birth for foreign-born residents (%): Mexico Park City:
79.7% (2,177)Illinois:
34.7% (626,958)
El Salvador Park City:
8.1% (221)Illinois:
0.6% (11,009)
Philippines Park City:
3.3% (89)Illinois:
5.2% (93,003)
Honduras Park City:
3.2% (88)Illinois:
0.6% (10,762)
Belize Park City:
2.2% (60)Illinois:
0.3% (4,639)
Place of birth for U.S.-born residents:
This state: 4,052Other state: 649Northeast: 45Midwest: 192South: 180West: 239 94.5% of Park City residents lived in the same house 1 years ago.
Out of people who lived in different houses, 45.9% lived in this county.
Out of people who lived in different counties, 0.0% lived in Illinois.
Park City:
94.5%State average:
88.3%
Education attainment for males 25 years and older:
No schooling: 130Nursery to 4th grade: 05th and 6th grade: 1317th and 8th grade: 129th grade: 4310th grade: 011th grade: 5312th grade, no diploma: 256High school graduate (or equivalency): 1,034Less than 1 year of college: 77Some college more than 1 year, no degree: 271Associate degree: 30Bachelor's degree: 132Master's degree: 45Professional school degree: 0Doctorate degree: 0
Education attainment for females 25 years and older:
No schooling: 232Nursery to 4th grade: 535th and 6th grade: 387th and 8th grade: 619th grade: 3810th grade: 7311th grade: 2912th grade, no diploma: 247High school graduate (or equivalency): 913Less than 1 year of college: 142Some college more than 1 year, no degree: 162Associate degree: 100Bachelor's degree: 179Master's degree: 131Professional school degree: 11Doctorate degree: 0
Housing units in structures:
One, detached: 457One, attached: 293 or 4: 565 to 9: 9310 to 19: 28920 to 49: 12450 or more: 33Mobile homes: 1,586Median worth of mobile homes: $22,921
House/condo owner moved in on average 11 years ago
Renter moved in on average 6 years ago
Private vs. public school enrollment:
Students in private schools in grades 1 to 8 (elementary and middle school): 14 Students in private schools in grades 9 to 12 (high school): 35 Students in private undergraduate colleges: 71