Park Forest, IL (Illinois) Houses and Residents
| Park Forest: | $97,183 |
| Illinois: | $251,600 |
Mean price in 2022:
Detached houses: $138,874
Here: $138,874 State: $310,164 Townhouses or other attached units: $67,324
Here: $67,324 State: $286,230 In 2-unit structures: $47,893
Here: $47,893 State: $299,638 In 3-to-4-unit structures: $43,235
Here: $43,235 State: $330,907 In 5-or-more-unit structures: $37,462
Here: $37,462 State: $318,887
Total population: 22,034 (All urban)
Houses: 8,921 (8,009 occupied: 4,992 owner occupied, 3,154 renter occupied)
| % of renters here: | 39% |
| State: | 33% |
Housing density: 1,811 houses/condos per square mile
Median price asked for vacant for-sale houses and condos in 2022: $98,114.
Median contract rent in 2022: $1,164 (lower quartile is $706, upper quartile is $1,415)
Median rent asked for vacant for-rent units in 2022: $1,131
Median gross rent in Park Forest, IL in 2022: $1,363
Housing units in Park Forest with a mortgage: 2,367 (44 second mortgage, 8 home equity loan, 19 both second mortgage and home equity loan)
Houses without a mortgage: 62
Median household income for houses/condos with a mortgage: $63,318
Median household income for apartments without a mortgage: $58,050
Median monthly housing costs: $1,080
Compare current foreclosures in Park Forest, IL:
| Photo | Address | Area | Beds / Baths | Price | Details |
|---|---|---|---|---|---|

|
#1
Hemlock St
Park Forest, IL 60466
|
1,000 sq. feet
|
1 baths 2 beds |
$85,000
|
show details |

|
#2
Michael Rd
Park Forest, IL 60466
|
1,200 sq. feet
|
1 baths 2 beds |
show details | |

|
#3
Gentry St
Park Forest, IL 60466
|
1,224 sq. feet
|
1 baths 3 beds |
show details | |

|
#4
Cody Ln
Park Forest, IL 60466
|
2,475 sq. feet
|
3 baths 4 beds |
show details | |

|
#5
Wilshire St
Park Forest, IL 60466
|
1,788 sq. feet
|
2 baths 4 beds |
show details | |

|
#6
Mohawk St
Park Forest, IL 60466
|
1,141 sq. feet
|
1 baths 3 beds |
show details | |

|
#7
Mohawk St
Park Forest, IL 60466
|
949 sq. feet
|
1 baths 2 beds |
show details | |

|
#8
Rutledge St
Park Forest, IL 60466
|
1,121 sq. feet
|
1 baths 3 beds |
show details | |

|
#9
Berry St
Park Forest, IL 60466
|
1,121 sq. feet
|
1 baths 3 beds |
show details | |

|
#10
Orchard Dr
Park Forest, IL 60466
|
1,217 sq. feet
|
1 baths 2 beds |
show details |
| Photo | Address | Area | Beds / Baths | Price | Details |
|---|---|---|---|---|---|

|
#11
Waverly Ct
Park Forest, IL 60466
|
1,443 sq. feet
|
1 baths - beds |
show details | |

|
#12
Merrimac St
Park Forest, IL 60466
|
974 sq. feet
|
1 baths - beds |
show details | |

|
#13
Shabbona Dr
Park Forest, IL 60466
|
949 sq. feet
|
1 baths - beds |
show details | |

|
#14
Niagara St
Park Forest, IL 60466
|
960 sq. feet
|
1 baths - beds |
show details | |

|
#15
Washington Ct
Park Forest, IL 60466
|
1,588 sq. feet
|
1 baths - beds |
show details | |

|
#16
Illinois St
Park Forest, IL 60466
|
1,121 sq. feet
|
1 baths - beds |
show details | |

|
#17
Sauk Trl
Park Forest, IL 60466
|
1,728 sq. feet
|
1 baths - beds |
show details | |

|
#18
Winona St
Park Forest, IL 60466
|
1,701 sq. feet
|
1 baths - beds |
show details | |

|
#19
Walnut St
Park Forest, IL 60466
|
1,411 sq. feet
|
2 baths - beds |
show details | |

|
#20
Westwood Dr
Park Forest, IL 60466
|
1,088 sq. feet
|
2 baths - beds |
show details |
| Photo | Address | Area | Beds / Baths | Price | Details |
|---|---|---|---|---|---|

|
#21
Blair St
Park Forest, IL 60466
|
1,215 sq. feet
|
2 baths - beds |
show details | |

|
#22
Meota St
Park Forest, IL 60466
|
1,233 sq. feet
|
1 baths - beds |
show details | |

|
#23
Antietam St
Park Forest, IL 60466
|
1,038 sq. feet
|
2 baths - beds |
show details | |

|
#24
Stanton St
Park Forest, IL 60466
|
1,211 sq. feet
|
1 baths - beds |
show details | |

|
#25
Kentucky St
Park Forest, IL 60466
|
1,218 sq. feet
|
1 baths - beds |
show details | |

|
#26
Minocqua St
Park Forest, IL 60466
|
974 sq. feet
|
1 baths - beds |
show details | |

|
#27
Farragut St
Park Forest, IL 60466
|
1,224 sq. feet
|
1 baths - beds |
show details | |

|
#28
Rich Ct
Park Forest, IL 60466
|
1,512 sq. feet
|
2 baths - beds |
show details | |

|
#29
Nashua St
Park Forest, IL 60466
|
949 sq. feet
|
1 baths - beds |
show details | |

|
#30
Gentry St
Park Forest, IL 60466
|
1,224 sq. feet
|
1 baths - beds |
show details |
| Photo | Address | Area | Beds / Baths | Price | Details |
|---|---|---|---|---|---|

|
#31
Wildwood Dr
Park Forest, IL 60466
|
1,456 sq. feet
|
1 baths - beds |
show details | |

|
#32
Herndon St
Park Forest, IL 60466
|
1,209 sq. feet
|
1 baths - beds |
show details | |

|
#33
Manitowac St
Park Forest, IL 60466
|
974 sq. feet
|
1 baths - beds |
show details | |

|
#34
Somonauk St
Park Forest, IL 60466
|
1,092 sq. feet
|
1 baths - beds |
show details | |

|
#35
Early St
Park Forest, IL 60466
|
1,121 sq. feet
|
1 baths - beds |
show details | |

|
#36
Indiana St
Park Forest, IL 60466
|
1,337 sq. feet
|
1 baths - beds |
show details | |

|
#37
Early St
Park Forest, IL 60466
|
1,551 sq. feet
|
2 baths - beds |
show details | |

|
#38
Manitowac St
Park Forest, IL 60466
|
1,228 sq. feet
|
1 baths - beds |
show details | |

|
#39
Nassau Ct
Park Forest, IL 60466
|
1,092 sq. feet
|
1 baths - beds |
show details | |

|
#40
Neola St
Park Forest, IL 60466
|
953 sq. feet
|
2 baths - beds |
show details |
| Photo | Address | Area | Beds / Baths | Price | Details |
|---|---|---|---|---|---|

|
#41
Westwood Dr
Park Forest, IL 60466
|
1,265 sq. feet
|
2 baths - beds |
show details | |

|
#42
Somonauk St
Park Forest, IL 60466
|
1,548 sq. feet
|
2 baths - beds |
show details | |

|
#43
Winnebago St
Park Forest, IL 60466
|
1,548 sq. feet
|
2 baths - beds |
show details | |

|
#44
Wilson Ct
Park Forest, IL 60466
|
1,117 sq. feet
|
2 baths - beds |
show details | |

|
#45
Westwood Dr
Park Forest, IL 60466
|
1,176 sq. feet
|
2 baths - beds |
show details | |

|
#46
Douglas St
Park Forest, IL 60466
|
1,337 sq. feet
|
1 baths - beds |
show details | |

|
#47
Gentry St
Park Forest, IL 60466
|
1,183 sq. feet
|
1 baths - beds |
show details | |

|
#48
Somonauk St
Park Forest, IL 60466
|
1,412 sq. feet
|
1 baths - beds |
show details | |

|
#49
Minocqua St
Park Forest, IL 60466
|
974 sq. feet
|
1 baths - beds |
show details | |

|
Check over 1 million property listings on Foreclosure.com!
|
browse all offers | |||


 | Park Forest real estate taxes (11 replies) |
| Very weak housing market in Highland Park (66 replies) |
| Cheapest entry level housing (NW suburbs pref) (9 replies) |
| North suburbs vs West suburbs vs South suburbs (107 replies) |
| Elgin & park forest, il (17 replies) |
| Steger in 2021 (8 replies) |

Median year apartment built: 1966
Household type by relationship:
Households: 20,574- Male householders: 2,488 (757 living alone), Female householders: 5,310 (2,068 living alone)
2,511 spouses (2,511 opposite-sex spouses), 334 unmarried partners, (334 opposite-sex unmarried partners), 6,926 children (6,277 natural, 115 adopted, 533 stepchildren), 1,281 grandchildren, 181 brothers or sisters, 250 parents, 173 foster children, 340 other relatives, 229 non-relatives
- In group quarters: 545
Size of family households: 1,769 2-persons, 1,274 3-persons, 914 4-persons, 537 5-persons, 149 6-persons, 119 7-or-more-persons.
Size of nonfamily households: 3,036 1-person, 311 2-persons, 15 3-persons.
2,120 married couples with children.
1,830 single-parent households (565 men, 1,265 women).
91.3% of residents of Park Forest speak English at home.
5.6% of residents speak Spanish at home (41% speak English very well, 34% speak English well, 22% speak English not well, 2% don't speak English at all).
1.6% of residents speak other Indo-European language at home (86% speak English very well, 12% speak English well, 2% speak English not well).
0.2% of residents speak Asian or Pacific Island language at home (17% speak English very well, 69% speak English well, 14% speak English not well).
0.3% of residents speak other language at home (79% speak English very well, 16% speak English well, 5% speak English not well).
Foreign born population: 978 (4.8%)
(55.4% of them are naturalized citizens)
| Here: | 6.0 |
| State: | 6.4 |
| Here: | 5.6 |
| State: | 4.1 |

- Bedrooms in owner-occupied houses and condos in Park Forest, Illinois
- 45no bedroom
- 1071 bedroom
- 1,7522 bedrooms
- 2,0983 bedrooms
- 9454 bedrooms
- 465+ bedrooms

- Bedrooms in renter-occupied apartments in Park Forest, Illinois
- 70no bedroom
- 4201 bedroom
- 9322 bedrooms
- 1,0823 bedrooms
- 6394 bedrooms
- 115+ bedrooms

- Cars and other vehicles available in Park Forest in owner-occupied houses/condos
- 197no vehicle
- 2,3931 vehicle
- 1,6962 vehicles
- 5923 vehicles
- 1034 vehicles
- 115+ vehicles

- Cars and other vehicles available in Park Forest in renter-occupied apartments
- 172no vehicle
- 1,6401 vehicle
- 1,0382 vehicles
- 2183 vehicles
- 874 vehicles
- 05+ vehicles

- Rooms in owner-occupied houses in Park Forest, Illinois
- 451 room
- 182 rooms
- 183 rooms
- 4794 rooms
- 1,4155 rooms
- 1,1046 rooms
- 9277 rooms
- 4978 rooms
- 4889+ rooms

- Rooms in renter-occupied apartments in Park Forest, Illinois
- 701 room
- 802 rooms
- 3333 rooms
- 3444 rooms
- 6565 rooms
- 5436 rooms
- 9377 rooms
- 768 rooms
- 1159+ rooms


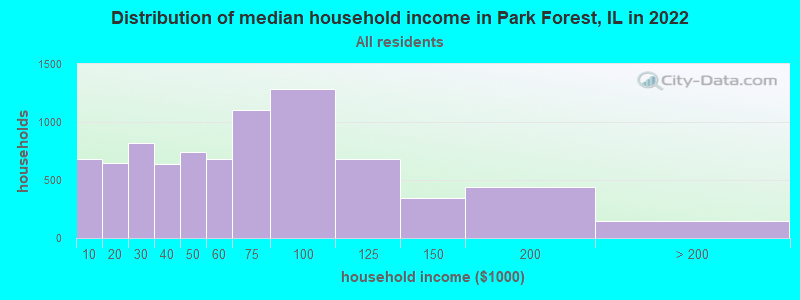
Park Forest, IL household income distribution

- 678Less than $10,000
- 649$10,000 to $19,999
- 822$20,000 to $29,999
- 638$30,000 to $39,999
- 744$40,000 to $49,999
- 684$50,000 to $59,999
- 1,104$60,000 to $74,999
- 1,281$75,000 to $99,999
- 685$100,000 to $124,999
- 344$125,000 to $149,999
- 439$150,000 to $199,999
- 146$200,000 or more
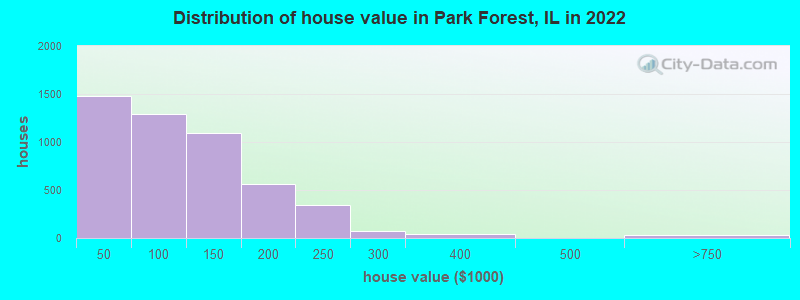
Home value of owner - occupied houses in 2022 in Park Forest, IL
-
- 123Less than $10,000
- 330$10,000 to $14,999
- 200$15,000 to $19,999
- 378$20,000 to $24,999
- 123$25,000 to $29,999
- 84$30,000 to $34,999
- 68$35,000 to $39,999
- 169$40,000 to $49,999
- 65$50,000 to $59,999
- 281$60,000 to $69,999
- 241$70,000 to $79,999
- 303$80,000 to $89,999
- 227$90,000 to $99,999
- 741$100,000 to $124,999
- 349$125,000 to $149,999
- 460$150,000 to $174,999
- 102$175,000 to $199,999
- 341$200,000 to $249,999
- 72$250,000 to $299,999
- 40$300,000 to $399,999
- 17$500,000 to $749,999
- 17$750,000 to $999,999
Rent paid by renters in 2022 in Park Forest, IL
-
- 132Less than $100
- 31$150 to $199
- 22$200 to $249
- 27$300 to $349
- 52$350 to $399
- 8$450 to $499
- 183$500 to $549
- 12$550 to $599
- 152$600 to $649
- 129$650 to $699
- 40$700 to $749
- 69$750 to $799
- 17$800 to $899
- 241$900 to $999
- 558$1,000 to $1,249
- 800$1,250 to $1,499
- 501$1,500 to $1,999
- 145No cash rent


Percentage of workers working in this county: 67.4%
Number of people working at home: 646 (7.0% of all workers)
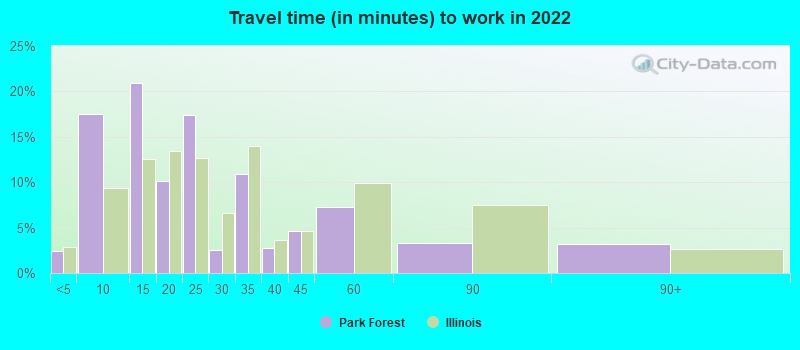
Travel time to work (commute)
- Less than 5 minutes: 92
- 5 to 9 minutes: 487
- 10 to 14 minutes: 1,466
- 15 to 19 minutes: 861
- 20 to 24 minutes: 930
- 25 to 29 minutes: 370
- 30 to 34 minutes: 880
- 35 to 39 minutes: 386
- 40 to 44 minutes: 286
- 45 to 59 minutes: 1,145
- 60 to 89 minutes: 805
- 90 or more minutes: 535
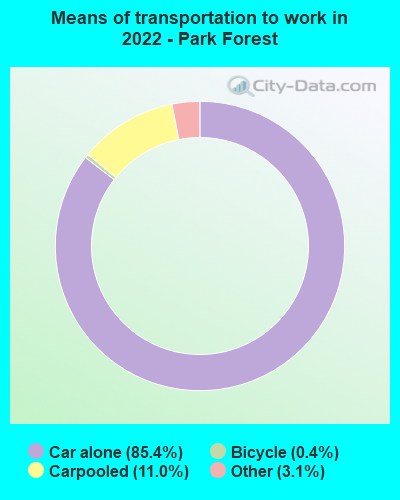
Means of transportation to work:
- Drove a car alone: 2,062 (69.5%)
- Carpooled: 284 (9.6%)
- Taxi: 76 (2.6%)
- Bicycle: 11 (0.4%)
- Worked at home: 646 (21.8%)

- Unemployment by race in 2022
- Unemployment rate for White non-Hispanic residents
- 8.4%Males
- 3.7%Females
- Unemployment rate for Black residents
- 6.6%Males
- 8.0%Females
- Unemployment rate for other race residents
- 10.8%Females
- Unemployment rate for two or more race residents
- 10.9%Males

- Year of entry for the foreign-born population in Park Forest, Illinois
- 1512010 or later
- 2182000 to 2009
- 3161990 to 1999
- 2161980 to 1989
- 921970 to 1979
- 292Before 1970

First ancestries reported:
- African: 499 (3.6%)
- English: 198 (1.4%)
- American: 184 (1.3%)
- German: 182 (1.3%)
- Irish: 148 (1.1%)
- Swedish: 122 (0.9%)
- Nigerian: 111 (0.8%)
- Polish: 82 (0.6%)
- Yugoslavian: 80 (0.6%)
- Italian: 70 (0.5%)
- Norwegian: 41 (0.3%)
- Dutch: 35 (0.3%)
- Jamaican: 32 (0.2%)
- European: 29 (0.2%)
- Scandinavian: 26 (0.2%)
- Scotch-Irish: 25 (0.2%)
- Swiss: 21 (0.2%)
- Czech: 20 (0.1%)
- Hungarian: 18 (0.1%)
- Iranian: 18 (0.1%)
- French Canadian: 15 (0.1%)
- Bulgarian: 10 (0.07%)
- Ghanaian: 10 (0.07%)
- French: 8 (0.06%)
- Haitian: 7 (0.05%)
- British: 5 (0.04%)
- Scottish: 5 (0.04%)
Most common places of birth for foreign-born residents (%):
| Park Forest: | 41.2% (403) |
| Illinois: | 34.7% (626,958) |
| Park Forest: | 14.1% (138) |
| Illinois: | 0.3% (5,397) |
| Park Forest: | 9.1% (89) |
| Illinois: | 1.2% (21,186) |
| Park Forest: | 6.4% (63) |
| Illinois: | 0.6% (10,776) |
| Park Forest: | 2.9% (28) |
| Illinois: | 0.1% (910) |
| Park Forest: | 2.8% (27) |
| Illinois: | 1.1% (19,306) |
| Park Forest: | 2.0% (20) |
| Illinois: | 0.5% (9,834) |
| Park Forest: | 1.9% (19) |
| Illinois: | 0.5% (8,235) |
| Park Forest: | 1.7% (17) |
| Illinois: | 0.5% (8,168) |
| Park Forest: | 1.6% (16) |
| Illinois: | 6.9% (124,474) |
| Park Forest: | 1.6% (16) |
| Illinois: | 0.4% (7,171) |
| Park Forest: | 1.5% (15) |
| Illinois: | 0.4% (7,043) |
Place of birth for U.S.-born residents:
- This state: 16,163
- Other state: 3,166
- Northeast: 205
- Midwest: 1,159
- South: 1,493
- West: 274
93.4% of Park Forest residents lived in the same house 1 years ago.
Out of people who lived in different houses, 40.5% lived in this county.
Out of people who lived in different counties, 81.7% lived in Illinois.
| Park Forest: | 93.4% |
| State average: | 88.3% |
Education attainment for males 25 years and older:
- No schooling: 454
- Nursery to 4th grade: 30
- 5th and 6th grade: 71
- 7th and 8th grade: 0
- 9th grade: 27
- 10th grade: 57
- 11th grade: 54
- 12th grade, no diploma: 146
- High school graduate (or equivalency): 1,544
- Less than 1 year of college: 556
- Some college more than 1 year, no degree: 1,029
- Associate degree: 606
- Bachelor's degree: 698
- Master's degree: 308
- Professional school degree: 79
- Doctorate degree: 31

Education attainment for females 25 years and older:
- No schooling: 162
- Nursery to 4th grade: 9
- 5th and 6th grade: 10
- 7th and 8th grade: 0
- 9th grade: 27
- 10th grade: 43
- 11th grade: 69
- 12th grade, no diploma: 158
- High school graduate (or equivalency): 1,780
- Less than 1 year of college: 391
- Some college more than 1 year, no degree: 1,916
- Associate degree: 913
- Bachelor's degree: 1,417
- Master's degree: 1,030
- Professional school degree: 111
- Doctorate degree: 30


Housing units in structures:
- One, detached: 5,676
- One, attached: 2,159
- Two: 111
- 3 or 4: 148
- 5 to 9: 104
- 10 to 19: 132
- 20 to 49: 63
- 50 or more: 526
Housing units lacking complete kitchen facilities in 2022: 2.7%
House/condo owner moved in on average 13 years ago
Renter moved in on average 5 years ago

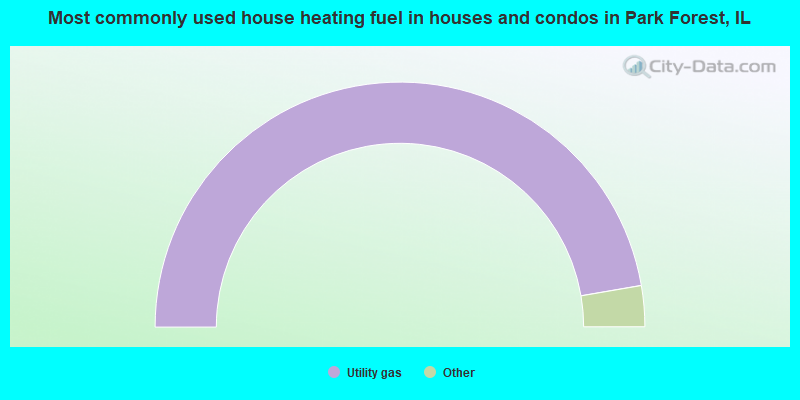
- 94.6%Utility gas
- 3.6%Electricity
- 0.8%Bottled, tank, or LP gas
- 0.8%Solar energy
- 0.2%No fuel used
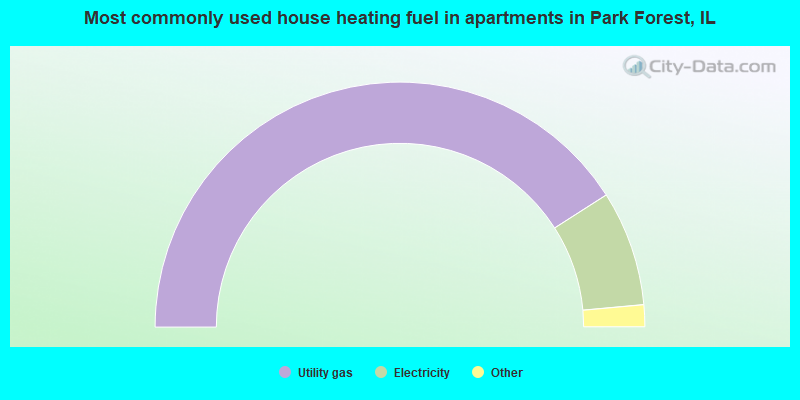
- 81.9%Utility gas
- 15.2%Electricity
- 2.1%Bottled, tank, or LP gas
- 0.7%Other fuel
Private vs. public school enrollment:
| Here: | 4.3% |
| Illinois: | 13.3% |
| Here: | 12.9% |
| Illinois: | 9.9% |
| Here: | 22.7% |
| Illinois: | 27.4% |


