Parkville, MD (Maryland) Houses and Residents
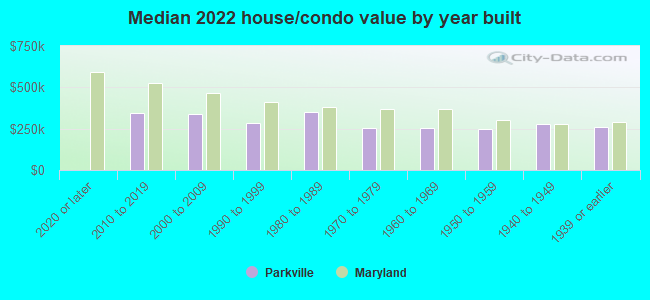
| Parkville: | $257,275 |
| Maryland: | $398,100 |
Mean price in 2022:
Detached houses: $272,940
Here: $272,940 State: $526,819 Townhouses or other attached units: $228,369
Here: $228,369 State: $328,305 In 2-unit structures: $164,581
Here: $164,581 State: $346,599 In 5-or-more-unit structures: $188,887
Here: $188,887 State: $350,378
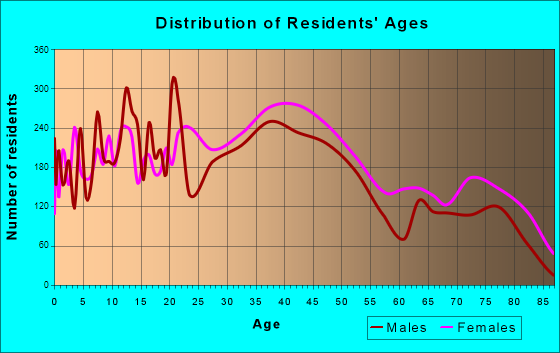
Total population: 30,734 (All urban)
Houses: 13,811 (12,500 occupied: 8,207 owner occupied, 4,571 renter occupied)
| % of renters here: | 36% |
| State: | 32% |
Housing density: 3,263 houses/condos per square mile
Median price asked for vacant for-sale houses and condos in 2022: $188,309.
Median contract rent in 2022: $1,215 (lower quartile is $985, upper quartile is $1,419)
Median rent asked for vacant for-rent units in 2022: $979
Median gross rent in Parkville, MD in 2022: $1,347
Housing units in Parkville with a mortgage: 6,018 (452 second mortgage, 12 home equity loan, 377 both second mortgage and home equity loan)
Houses without a mortgage: 119
Median household income for houses/condos with a mortgage: $101,712
Median household income for apartments without a mortgage: $77,086
Median monthly housing costs: $1,369
Compare current foreclosures in Parkville, MD:
| Photo | Address | Area | Beds / Baths | Price | Details |
|---|---|---|---|---|---|

|
#1
Ardmore Ave
Parkville, MD 21234
|
2,463 sq. feet
|
2 baths 4 beds |
$349,900
|
show details |

|
#2
Old Harford Rd
Parkville, MD 21234
|
1,080 sq. feet
|
1 baths 3 beds |
show details | |

|
#3
Glencoe Rd
Parkville, MD 21234
|
672 sq. feet
|
1 baths - beds |
show details | |

|
#4
California Ave
Parkville, MD 21234
|
1,176 sq. feet
|
1 baths - beds |
show details | |

|
#5
Turnbrook Ct
Parkville, MD 21234
|
1,348 sq. feet
|
2 baths - beds |
show details | |

|
#6
Chesley Ave
Parkville, MD 21234
|
1,200 sq. feet
|
1 baths - beds |
show details | |

|
#7
Cub Hill Rd
Parkville, MD 21234
|
1,454 sq. feet
|
1 baths - beds |
show details | |

|
#8
Stockwell Rd
Parkville, MD 21234
|
1,055 sq. feet
|
1 baths - beds |
show details | |

|
#9
Maple Hollow Ct
Parkville, MD 21234
|
1,555 sq. feet
|
2 baths - beds |
show details | |

|
#10
Canterbury Rd
Parkville, MD 21234
|
1,336 sq. feet
|
1 baths - beds |
show details |
| Photo | Address | Area | Beds / Baths | Price | Details |
|---|---|---|---|---|---|

|
#11
Orbitan Rd
Parkville, MD 21234
|
1,508 sq. feet
|
1 baths - beds |
show details | |

|
#12
Hines Estates Dr
Parkville, MD 21234
|
1,452 sq. feet
|
3 baths - beds |
show details | |

|
#13
Oakdale Ave
Parkville, MD 21234
|
1,940 sq. feet
|
2 baths - beds |
show details | |

|
#14
Wycliffe Rd
Parkville, MD 21234
|
1,428 sq. feet
|
1 baths - beds |
show details | |

|
#15
Fontaine Dr
Parkville, MD 21234
|
1,312 sq. feet
|
1 baths - beds |
show details | |

|
#16
Black Oak Rd
Parkville, MD 21234
|
1,350 sq. feet
|
1 baths - beds |
show details | |

|
#17
Oakleigh Rd
Parkville, MD 21234
|
2,044 sq. feet
|
1 baths - beds |
show details | |

|
#18
Yakona Rd
Parkville, MD 21234
|
1,350 sq. feet
|
1 baths - beds |
show details | |

|
#19
Woodring Ave
Parkville, MD 21234
|
1,558 sq. feet
|
1 baths - beds |
show details | |

|
#20
Orlando Ave
Parkville, MD 21234
|
1,774 sq. feet
|
1 baths - beds |
show details |
| Photo | Address | Area | Beds / Baths | Price | Details |
|---|---|---|---|---|---|

|
#21
Taylor Ave
Parkville, MD 21234
|
1,309 sq. feet
|
1 baths - beds |
show details | |

|
#22
9th Ave
Parkville, MD 21234
|
1,131 sq. feet
|
1 baths - beds |
show details | |

|
#23
Wentworth Ave
Parkville, MD 21234
|
1,284 sq. feet
|
1 baths - beds |
show details | |

|
#24
Harris Ave
Parkville, MD 21234
|
954 sq. feet
|
1 baths - beds |
show details | |

|
#25
Harview Ave
Parkville, MD 21234
|
1,392 sq. feet
|
2 baths - beds |
show details | |

|
#26
Wildpark Ave
Parkville, MD 21234
|
1,300 sq. feet
|
1 baths - beds |
show details | |

|
#27
Wycliffe Ave
Parkville, MD 21234
|
1,292 sq. feet
|
2 baths - beds |
show details | |

|
#28
Daniels Ave
Parkville, MD 21234
|
1,500 sq. feet
|
1 baths - beds |
show details | |

|
#29
Water Oak Rd
Parkville, MD 21234
|
896 sq. feet
|
1 baths - beds |
show details | |

|
#30
Halstead Rd
Parkville, MD 21234
|
1,440 sq. feet
|
1 baths - beds |
show details |
| Photo | Address | Area | Beds / Baths | Price | Details |
|---|---|---|---|---|---|

|
#31
Kirwin Ct
Parkville, MD 21234
|
1,860 sq. feet
|
3 baths - beds |
show details | |

|
#32
Dubois Ave
Parkville, MD 21234
|
1,120 sq. feet
|
1 baths - beds |
show details | |

|
#33
Fullerdale Ave
Parkville, MD 21234
|
1,896 sq. feet
|
1 baths - beds |
show details | |

|
#34
Topaz Rd
Parkville, MD 21234
|
2,042 sq. feet
|
4 baths - beds |
show details | |

|
#35
Throgmorton Rd
Parkville, MD 21234
|
1,560 sq. feet
|
2 baths - beds |
show details | |

|
#36
Daniels Ave
Parkville, MD 21234
|
1,468 sq. feet
|
1 baths - beds |
show details | |

|
#37
Havenfield Dr
Parkville, MD 21234
|
1,484 sq. feet
|
2 baths - beds |
show details | |

|
#38
Dartmouth Ave
Parkville, MD 21234
|
1,360 sq. feet
|
1 baths - beds |
show details | |

|
#39
Ridgely Oak Rd
Parkville, MD 21234
|
1,014 sq. feet
|
1 baths - beds |
show details | |

|
#40
Willow Oak Rd
Parkville, MD 21234
|
1,692 sq. feet
|
1 baths - beds |
show details |
| Photo | Address | Area | Beds / Baths | Price | Details |
|---|---|---|---|---|---|

|
#41
Lampost Ln
Parkville, MD 21234
|
1,609 sq. feet
|
1 baths - beds |
show details | |

|
#42
Britinay Ln
Parkville, MD 21234
|
2,016 sq. feet
|
2 baths - beds |
show details | |

|
#43
Deltom Ct
Parkville, MD 21234
|
1,120 sq. feet
|
1 baths - beds |
show details | |

|
#44
Park Dr
Parkville, MD 21234
|
1,350 sq. feet
|
1 baths - beds |
show details | |

|
#45
Pitney Rd
Parkville, MD 21234
|
1,440 sq. feet
|
2 baths - beds |
show details | |

|
#46
Linkside Dr
Parkville, MD 21234
|
1,282 sq. feet
|
2 baths - beds |
show details | |

|
#47
Fullerdale Ave
Parkville, MD 21234
|
1,164 sq. feet
|
2 baths - beds |
show details | |

|
#48
Deanwood Rd
Parkville, MD 21234
|
1,708 sq. feet
|
1 baths - beds |
show details | |

|
#49
Chesley Ave
Parkville, MD 21234
|
1,092 sq. feet
|
1 baths - beds |
show details | |

|
Check over 1 million property listings on Foreclosure.com!
|
browse all offers | |||

Latest news about housing in Parkville, MD collected exclusively by city-data.com from local newspapers, TV, and radio stations

 | Thinking about moving to parkville (7 replies) |
| ODonnell Square - New Homes (Greektown) (54 replies) |
| What’s wrong with maryland schools? (44 replies) |
| What are the negatives in re PARKVILLE ?? (8 replies) |
| Looking for an apartment outside of Baltimore (11 replies) |
| Should I look for homes in Towson? (18 replies) |
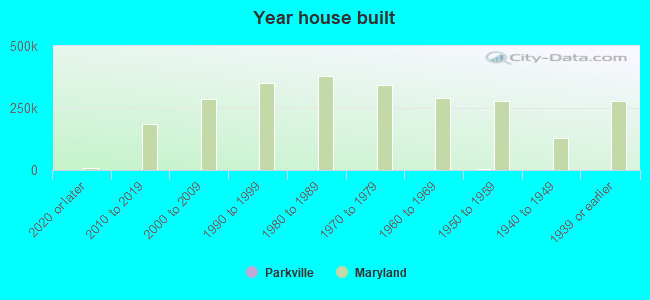
Median year apartment built: 1968
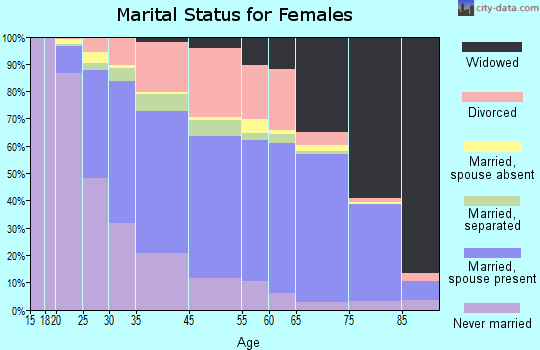
Household type by relationship:
Households: 30,355- Male householders: 5,503 (1,875 living alone), Female householders: 6,871 (2,160 living alone)
4,524 spouses (4,416 opposite-sex spouses), 849 unmarried partners, (845 opposite-sex unmarried partners), 9,041 children (8,556 natural, 113 adopted, 370 stepchildren), 607 grandchildren, 415 brothers or sisters, 499 parents, 0 foster children, 515 other relatives, 1,144 non-relatives
- In group quarters: 382
Size of family households: 3,244 2-persons, 2,144 3-persons, 1,821 4-persons, 344 5-persons, 209 6-persons, 77 7-or-more-persons.
Size of nonfamily households: 4,203 1-person, 676 2-persons, 65 3-persons, 19 4-persons.
3,468 married couples with children.
2,608 single-parent households (899 men, 1,709 women).
92.9% of residents of Parkville speak English at home.
1.7% of residents speak Spanish at home (76% speak English very well, 19% speak English well, 5% speak English not well).
2.0% of residents speak other Indo-European language at home (65% speak English very well, 32% speak English well, 3% don't speak English at all).
1.7% of residents speak Asian or Pacific Island language at home (68% speak English very well, 18% speak English well, 13% speak English not well, 2% don't speak English at all).
2.0% of residents speak other language at home (83% speak English very well, 13% speak English well, 4% speak English not well).
Foreign born population: 2,229 (7.3%)
(62.9% of them are naturalized citizens)
| Here: | 6.9 |
| State: | 7.3 |
| Here: | 4.5 |
| State: | 4.2 |
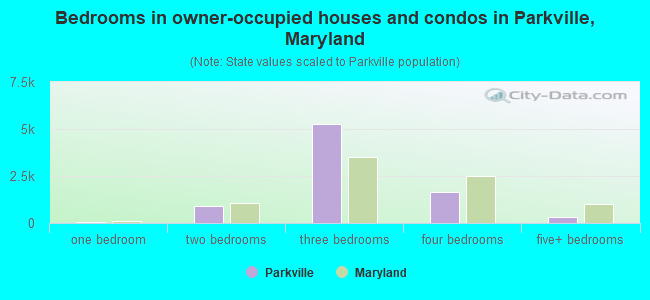
- Bedrooms in owner-occupied houses and condos in Parkville, Maryland
- 0no bedroom
- 621 bedroom
- 9202 bedrooms
- 5,2483 bedrooms
- 1,6644 bedrooms
- 3145+ bedrooms
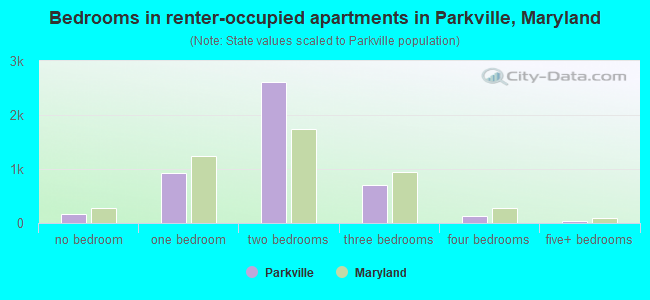
- Bedrooms in renter-occupied apartments in Parkville, Maryland
- 171no bedroom
- 9191 bedroom
- 2,6032 bedrooms
- 7093 bedrooms
- 1374 bedrooms
- 345+ bedrooms
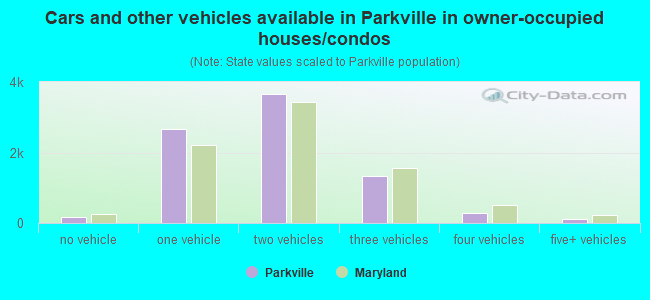
- Cars and other vehicles available in Parkville in owner-occupied houses/condos
- 178no vehicle
- 2,6641 vehicle
- 3,6482 vehicles
- 1,3233 vehicles
- 2814 vehicles
- 1135+ vehicles
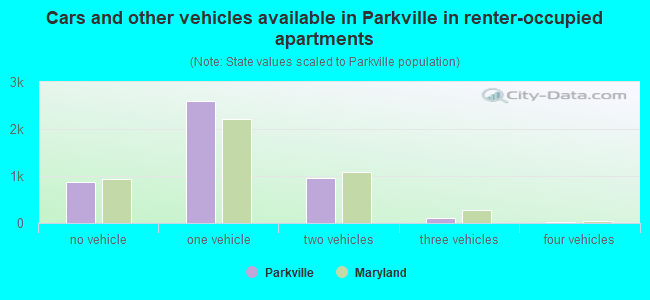
- Cars and other vehicles available in Parkville in renter-occupied apartments
- 866no vehicle
- 2,5861 vehicle
- 9682 vehicles
- 1103 vehicles
- 304 vehicles
- 125+ vehicles
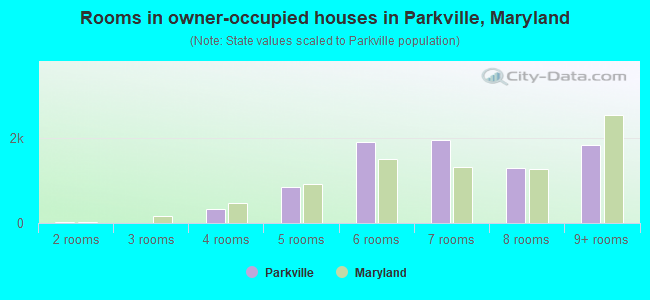
- Rooms in owner-occupied houses in Parkville, Maryland
- 01 room
- 262 rooms
- 103 rooms
- 3414 rooms
- 8485 rooms
- 1,9146 rooms
- 1,9477 rooms
- 1,2978 rooms
- 1,8249+ rooms
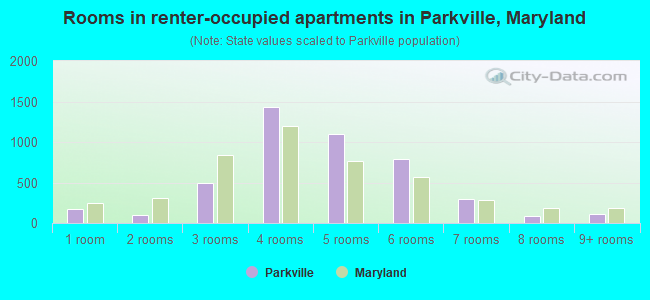
- Rooms in renter-occupied apartments in Parkville, Maryland
- 1711 room
- 982 rooms
- 4923 rooms
- 1,4374 rooms
- 1,1025 rooms
- 7866 rooms
- 2957 rooms
- 828 rooms
- 1109+ rooms
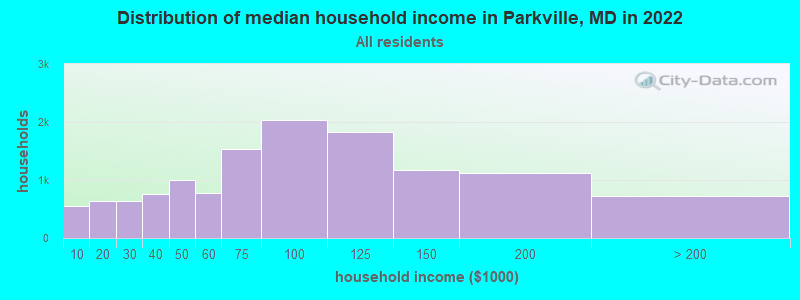
Parkville, MD household income distribution

- 559Less than $10,000
- 646$10,000 to $19,999
- 639$20,000 to $29,999
- 761$30,000 to $39,999
- 995$40,000 to $49,999
- 771$50,000 to $59,999
- 1,528$60,000 to $74,999
- 2,035$75,000 to $99,999
- 1,827$100,000 to $124,999
- 1,173$125,000 to $149,999
- 1,125$150,000 to $199,999
- 718$200,000 or more
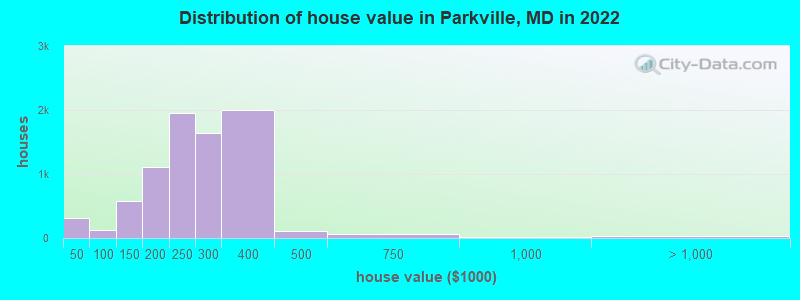
Home value of owner - occupied houses in 2022 in Parkville, MD
-
- 191Less than $10,000
- 19$10,000 to $14,999
- 20$15,000 to $19,999
- 51$20,000 to $24,999
- 9$25,000 to $29,999
- 25$30,000 to $34,999
- 5$50,000 to $59,999
- 59$70,000 to $79,999
- 22$80,000 to $89,999
- 32$90,000 to $99,999
- 384$100,000 to $124,999
- 199$125,000 to $149,999
- 542$150,000 to $174,999
- 567$175,000 to $199,999
- 1,948$200,000 to $249,999
- 1,643$250,000 to $299,999
- 1,998$300,000 to $399,999
- 111$400,000 to $499,999
- 57$500,000 to $749,999
- 15$750,000 to $999,999
- 14$1,000,000 to $1,499,999
- 14$1,500,000 to $1,999,999
- 8$2,000,000 or more
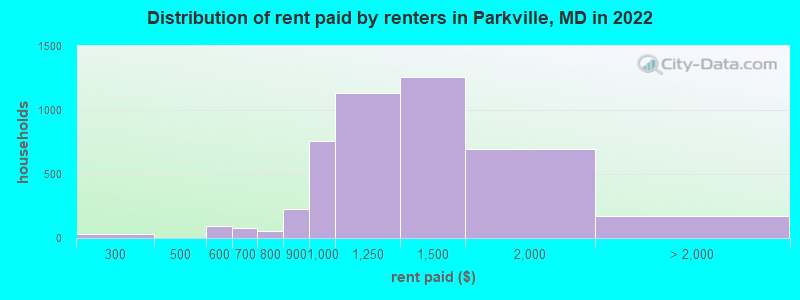
Rent paid by renters in 2022 in Parkville, MD
-
- 30$200 to $249
- 80$500 to $549
- 12$550 to $599
- 76$650 to $699
- 8$700 to $749
- 44$750 to $799
- 224$800 to $899
- 754$900 to $999
- 1,130$1,000 to $1,249
- 1,259$1,250 to $1,499
- 695$1,500 to $1,999
- 39$2,000 to $2,499
- 129No cash rent
Percentage of workers working in this county: 62.1%
Number of people working at home: 2,377 (14.6% of all workers)
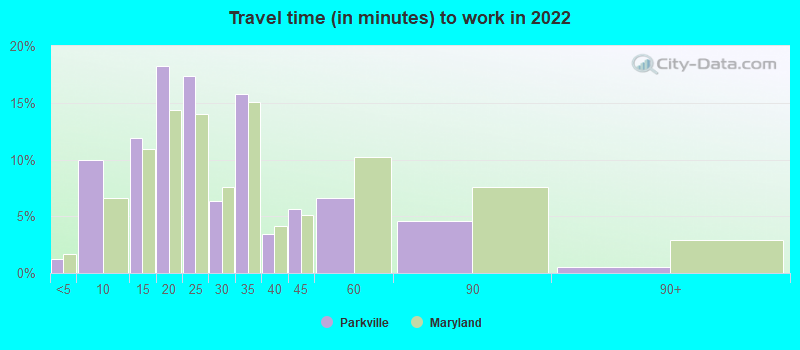
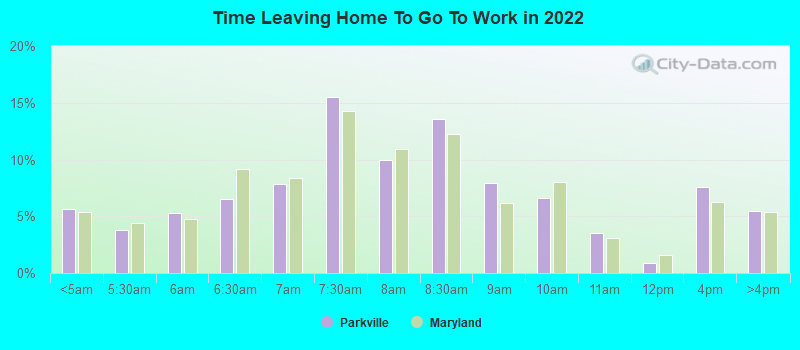
Travel time to work (commute)
- Less than 5 minutes: 90
- 5 to 9 minutes: 859
- 10 to 14 minutes: 1,087
- 15 to 19 minutes: 2,411
- 20 to 24 minutes: 2,901
- 25 to 29 minutes: 1,570
- 30 to 34 minutes: 2,088
- 35 to 39 minutes: 678
- 40 to 44 minutes: 561
- 45 to 59 minutes: 1,088
- 60 to 89 minutes: 402
- 90 or more minutes: 239
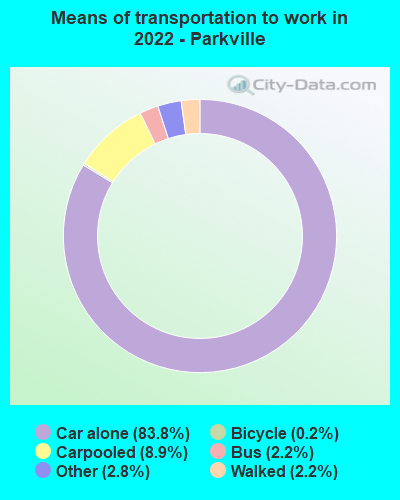
Means of transportation to work:
- Drove a car alone: 3,817 (57.5%)
- Carpooled: 462 (7.0%)
- Bus: 60 (0.9%)
- Taxi: 154 (2.3%)
- Bicycle: 6 (0.1%)
- Walked: 113 (1.7%)
- Worked at home: 2,377 (35.8%)
- Unemployment by race in 2022
- Unemployment rate for White non-Hispanic residents
- 4.3%Males
- 2.4%Females
- Unemployment rate for Black residents
- 11.6%Males
- 3.6%Females
- Unemployment rate for Asian residents
- 0.8%Males
- Unemployment rate for other race residents
- 5.6%Males
- 1.7%Females
- Unemployment rate for two or more race residents
- 2.5%Females
- Unemployment rate for Hispanic or Latino residents
- 4.0%Males
- 4.0%Females
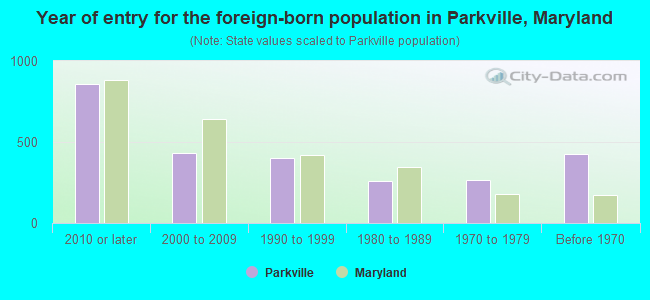
- Year of entry for the foreign-born population in Parkville, Maryland
- 8582010 or later
- 4322000 to 2009
- 4021990 to 1999
- 2611980 to 1989
- 2641970 to 1979
- 425Before 1970
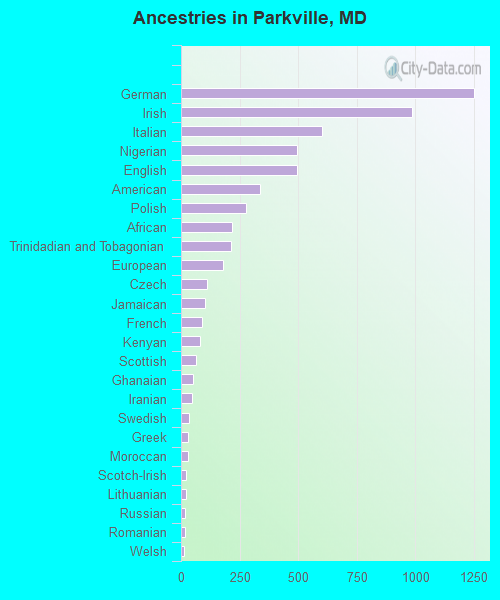
First ancestries reported:
- German: 1,253 (7.9%)
- Irish: 988 (6.2%)
- Italian: 604 (3.8%)
- Nigerian: 496 (3.1%)
- English: 494 (3.1%)
- American: 336 (2.1%)
- Polish: 276 (1.7%)
- African: 217 (1.4%)
- Trinidadian and Tobagonian: 215 (1.4%)
- European: 178 (1.1%)
- Czech: 110 (0.7%)
- Jamaican: 103 (0.7%)
- French: 89 (0.6%)
- Kenyan: 83 (0.5%)
- Scottish: 65 (0.4%)
- Ghanaian: 53 (0.3%)
- Iranian: 45 (0.3%)
- Swedish: 36 (0.2%)
- Greek: 31 (0.2%)
- Moroccan: 28 (0.2%)
- Scotch-Irish: 22 (0.1%)
- Lithuanian: 22 (0.1%)
- Russian: 18 (0.1%)
- Romanian: 17 (0.1%)
- Welsh: 13 (0.08%)
- Ethiopian: 12 (0.08%)
- Senegalese: 11 (0.07%)
- Dutch: 9 (0.06%)
- Scandinavian: 8 (0.05%)
- British: 7 (0.04%)
- Eastern European: 7 (0.04%)
- Norwegian: 6 (0.04%)
- Yugoslavian: 5 (0.03%)
- Jordanian: 3 (0.02%)
- Serbian: 2 (0.01%)
- Belizean: 1 (0.01%)
Most common places of birth for foreign-born residents (%):
| Parkville: | 17.3% (389) |
| Maryland: | 4.6% (44,825) |
| Parkville: | 9.7% (218) |
| Maryland: | 1.2% (11,481) |
| Parkville: | 8.1% (181) |
| Maryland: | 1.1% (10,205) |
| Parkville: | 5.9% (133) |
| Maryland: | 3.8% (36,698) |
| Parkville: | 4.1% (92) |
| Maryland: | 2.8% (27,444) |
| Parkville: | 4.1% (91) |
| Maryland: | 0.8% (7,497) |
| Parkville: | 4.1% (91) |
| Maryland: | 4.6% (44,742) |
| Parkville: | 3.5% (78) |
| Maryland: | 2.5% (23,969) |
| Parkville: | 3.2% (72) |
| Maryland: | 0.2% (2,108) |
| Parkville: | 3.0% (68) |
| Maryland: | 6.4% (61,725) |
| Parkville: | 3.0% (68) |
| Maryland: | 12.0% (115,412) |
| Parkville: | 2.6% (59) |
| Maryland: | 0.6% (6,211) |
| Parkville: | 2.4% (53) |
| Maryland: | 0.5% (4,995) |
| Parkville: | 2.0% (46) |
| Maryland: | 4.4% (42,350) |
| Parkville: | 2.0% (46) |
| Maryland: | 0.4% (3,418) |
| Parkville: | 2.0% (45) |
| Maryland: | 1.3% (12,074) |
| Parkville: | 2.0% (44) |
| Maryland: | 1.2% (11,265) |
| Parkville: | 1.9% (43) |
| Maryland: | 1.0% (9,481) |
| Parkville: | 1.8% (41) |
| Maryland: | 1.9% (18,716) |
| Parkville: | 1.7% (39) |
| Maryland: | 1.8% (17,774) |
| Parkville: | 1.6% (37) |
| Maryland: | 0.1% (920) |
Place of birth for U.S.-born residents:
- This state: 22,396
- Other state: 5,236
- Northeast: 2,466
- Midwest: 597
- South: 1,711
- West: 422
92.2% of Parkville residents lived in the same house 1 years ago.
Out of people who lived in different houses, 31.6% lived in this county.
Out of people who lived in different counties, 75.2% lived in Maryland.
| Parkville: | 92.2% |
| State average: | 88.5% |
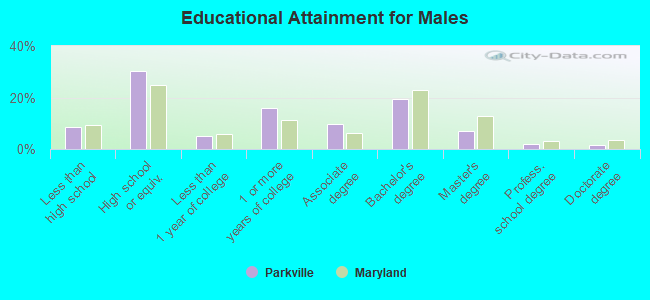
Education attainment for males 25 years and older:
- No schooling: 225
- Nursery to 4th grade: 46
- 5th and 6th grade: 4
- 7th and 8th grade: 52
- 9th grade: 52
- 10th grade: 79
- 11th grade: 104
- 12th grade, no diploma: 249
- High school graduate (or equivalency): 2,926
- Less than 1 year of college: 499
- Some college more than 1 year, no degree: 1,551
- Associate degree: 941
- Bachelor's degree: 1,865
- Master's degree: 688
- Professional school degree: 204
- Doctorate degree: 156
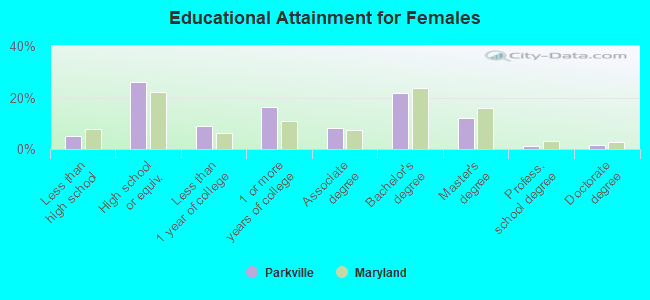
Education attainment for females 25 years and older:
- No schooling: 85
- Nursery to 4th grade: 33
- 5th and 6th grade: 8
- 7th and 8th grade: 57
- 9th grade: 76
- 10th grade: 36
- 11th grade: 150
- 12th grade, no diploma: 118
- High school graduate (or equivalency): 2,951
- Less than 1 year of college: 996
- Some college more than 1 year, no degree: 1,836
- Associate degree: 912
- Bachelor's degree: 2,462
- Master's degree: 1,360
- Professional school degree: 131
- Doctorate degree: 170
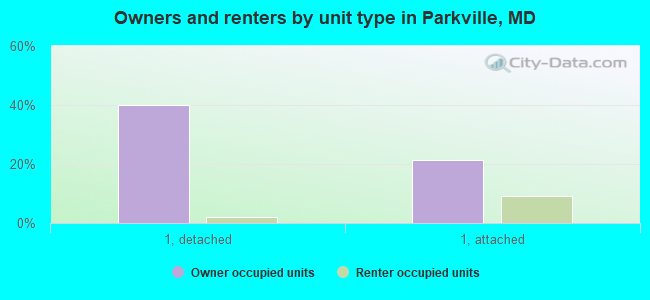
Housing units in structures:
- One, detached: 6,084
- One, attached: 3,980
- Two: 501
- 3 or 4: 400
- 5 to 9: 1,531
- 10 to 19: 1,124
- 20 to 49: 61
- 50 or more: 81
- Mobile homes: 46
Housing units lacking complete kitchen facilities in 2022: 1.3%
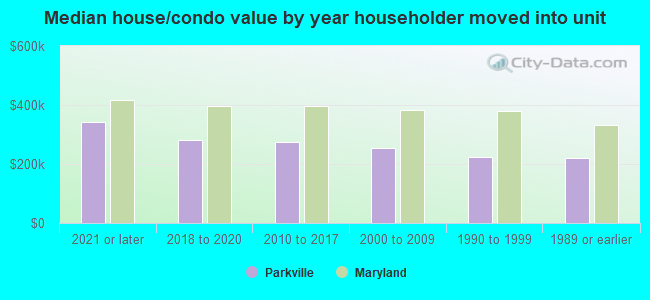
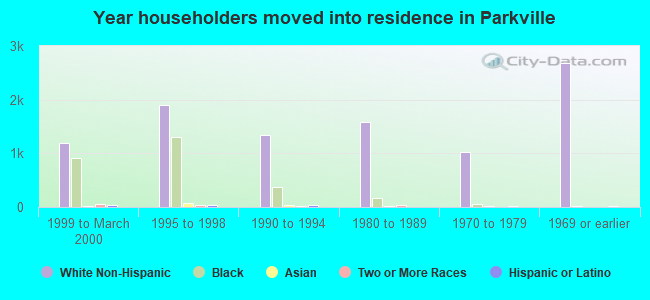
House/condo owner moved in on average 14 years ago
Renter moved in on average 5 years ago
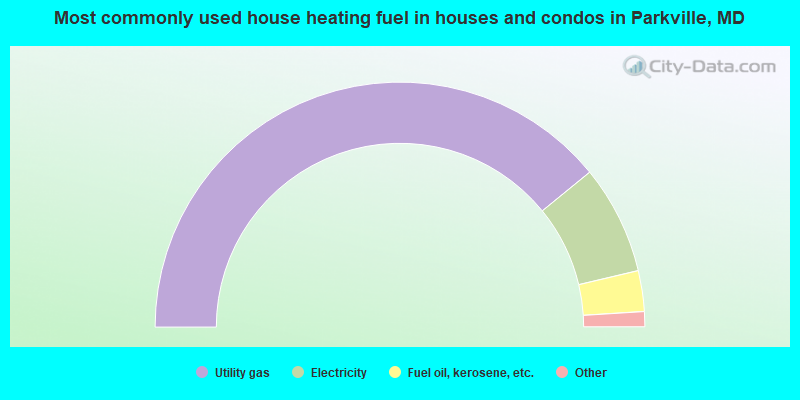
- 78.3%Utility gas
- 14.4%Electricity
- 5.4%Fuel oil, kerosene, etc.
- 1.7%Bottled, tank, or LP gas
- 0.3%No fuel used
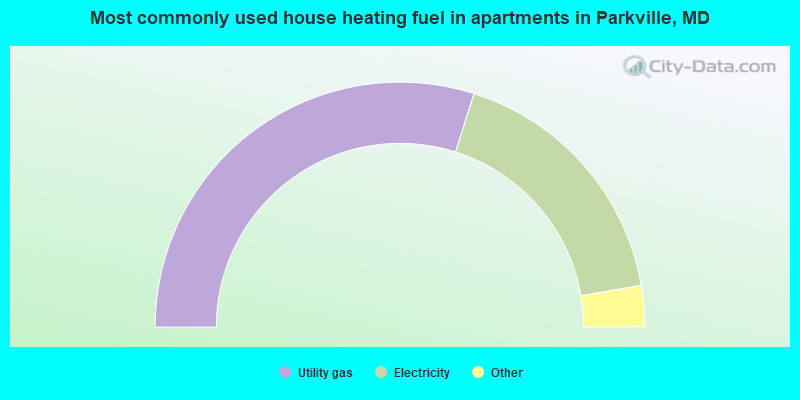
- 59.8%Utility gas
- 34.8%Electricity
- 2.3%Bottled, tank, or LP gas
- 2.1%Fuel oil, kerosene, etc.
- 0.6%Other fuel
- 0.4%No fuel used
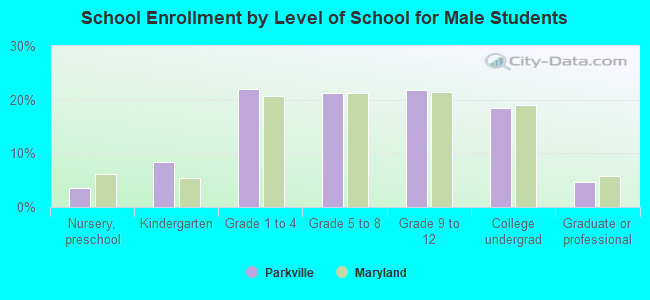
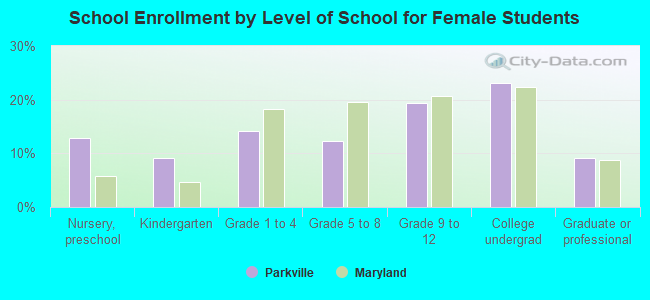
Private vs. public school enrollment:
| Here: | 11.5% |
| Maryland: | 15.2% |
| Here: | 19.0% |
| Maryland: | 14.4% |
| Here: | 18.0% |
| Maryland: | 20.2% |