Patchogue, NY (New York) Houses and Residents
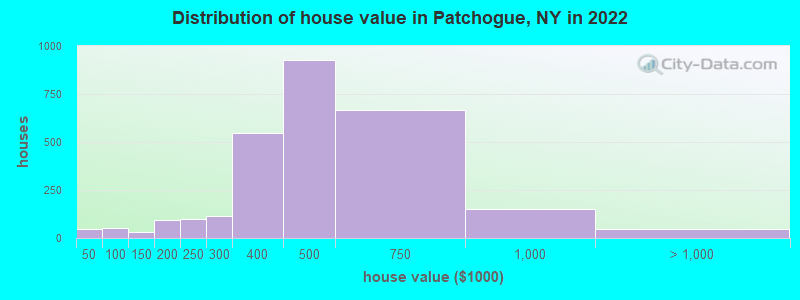
Estimated median house or condo value in 2022: $473,096 (it was $138,000 in 2000 )
Patchogue:
$473,096New York:
$400,400
Lower value quartile - upper value quartile: $359,407 - $521,972Mean price in 2022: Detached houses: $453,077 Here:
$453,077State:
$476,719
Townhouses or other attached units: $551,226 Here:
$551,226State:
$699,270
In 2-unit structures: $1,148,184 Here:
$1,148,184State:
$713,077
In 3-to-4-unit structures: $356,366 Here:
$356,366State:
$764,568
In 5-or-more-unit structures: $140,227 Here:
$140,227State:
$912,009
Total population: 12,364 (Urban population: 11,917, Rural population: 0)
Houses: 5,498 (5,284 occupied: 3,041 owner occupied, 2,240 renter occupied )
% of renters here:
42%State:
46%
Housing density: 2,445 houses/condos per square mile
Median price asked for vacant for-sale houses and condos in 2022 in this county: $940,353.
Median contract rent in 2022: over $2,000 (lower quartile is $1,168, upper quartile is over $2,000)
Median rent asked for vacant for-rent units in 2022: $3,268
Median gross rent in Patchogue, NY in 2022: over $2,000
Housing units in Patchogue with a mortgage: 1,976 (123 second mortgage, 0 home equity loan, 123 both second mortgage and home equity loan )Houses without a mortgage: 22
Median household income for houses/condos with a mortgage: $128,211
Median household income for apartments without a mortgage: $99,126
Median monthly housing costs: $2,263
Data:
Median house or condo value ($)
Median house or condo value ($ change since 2000)
Median house or condo value ($) - White
Median house or condo value ($) - Black or African American
Median house or condo value ($) - Asian
Median house or condo value ($) - Hispanic or Latino
Median house or condo value ($) - American Indian and Alaska Native
Median house or condo value ($) - Multirace
Median house or condo value ($) - Other Race
Median price asked for mobile homes ($)
Household density (households per square mile)
Mean house or condo value by units in structure - 1, detached ($)
Mean house or condo value by units in structure - 1, attached ($)
Mean house or condo value by units in structure - 2 ($)
Mean house or condo value by units in structure by units in structure - 3 or 4 ($)
Mean house or condo value by units in structure - 5 or more ($)
Mean house or condo value by units in structure - Boat, RV, van, etc. ($)
Mean house or condo value by units in structure - Mobile home ($)
Median contract rent ($)
Median contract rent - Lower quartile ($)
Median contract rent - Upper quartile ($)
Median gross rent ($)
Urban houses (%)
Rural houses (%)
Houses occupied (%)
Houses occupied (% change since 2000)
Houses owner occupied (%)
Houses owner occupied (% change since 2000)
Houses renter occupied (%)
Houses renter occupied (% change since 2000)
Vacant housing units - For rent (%)
Vacant housing units - For rent (% change since 2000)
Vacant housing units - For sale only (%)
Vacant housing units - For sale only (% change since 2000)
Vacant housing units - Rented or sold, not occupied (%)
Vacant housing units - Rented or sold, not occupied (% change since 2000)
Vacant housing units - For seasonal, recreational, or occasional use (%)
Vacant housing units - For seasonal, recreational, or occasional use (% change since 2000)
Vacant housing units - For migrant workers (%)
Vacant housing units - For migrant workers (% change since 2000)
Vacant housing units - Other vacant (%)
Vacant housing units - Other vacant (% change since 2000)
Median monthly housing costs ($)
Median household income for houses/condos with a mortgage ($)
Median household income for houses/condos without a mortgage ($)
Median household income ($)
Median household income ($) - White
Median household income ($) - Black or African American
Median household income ($) - Asian
Median household income ($) - Hispanic or Latino
Median household income ($) - American Indian and Alaska Native
Median household income ($) - Multirace
Median household income ($) - Other Race
Mortgage status - with mortgage (%)
Mortgage status - with second mortgage (%)
Mortgage status - with home equity loan (%)
Mortgage status - with both second mortgage and home equity loan (%)
Mortgage status - without a mortgage (%)
Median year house/condo built
Median year apartment built
Household type by relationship - Male householder living alone (%)
Household type by relationship - Male householder not living alone (%)
Household type by relationship - Female householder living alone (%)
Household type by relationship - Female householder not living alone (%)
Household type by relationship - Opposite-Sex spouse (%)
Household type by relationship - Same-Sex spouse (%)
Household type by relationship - Opposite-Sex unmarried partner (%)
Household type by relationship - Same-Sex unmarried partner (%)
Household type by relationship - In group quarters (%)
Size of family households - 2-person household (%)
Size of family households - 3-person household (%)
Size of family households - 4-person household (%)
Size of family households - 5-person household (%)
Size of family households - 6-person household (%)
Size of family households - 7-or-more-person household (%)
Size of nonfamily households - 1-person household (%)
Size of nonfamily households - 2-person household (%)
Size of nonfamily households - 3-person household (%)
Size of nonfamily households - 4-person household (%)
Size of nonfamily households - 5-person household (%)
Size of nonfamily households - 6-person household (%)
Size of nonfamily households - 7-or-moreperson household (%)
Year house built - Built 2010 or later (%)
Year house built - Built 2000 to 2009 (%)
Year house built - Built 1990 to 1999 (%)
Year house built - Built 1980 to 1989 (%)
Year house built - Built 1970 to 1979 (%)
Year house built - Built 1960 to 1969 (%)
Year house built - Built 1950 to 1959 (%)
Year house built - Built 1940 to 1949 (%)
Year house built - Built 1939 or earlier (%)
Median number of rooms in houses and condos
Median number of rooms in apartments
Median number of bedrooms in owner occupied houses
Mean number of bedrooms in owner occupied houses
Median number of bedrooms in renter occupied houses
Mean number of bedrooms in renter occupied houses
Median number of vehichles in owner occupied houses
Mean number of vehichles in owner occupied houses
Median number of vehichles in renter occupied houses
Mean number of vehichles in renter occupied houses
Rooms in owner-occupied houses - 1 room (%)
Rooms in owner-occupied houses - 2 rooms (%)
Rooms in owner-occupied houses - 3 rooms (%)
Rooms in owner-occupied houses - 4 rooms (%)
Rooms in owner-occupied houses - 5 rooms (%)
Rooms in owner-occupied houses - 6 rooms (%)
Rooms in owner-occupied houses - 7 rooms (%)
Rooms in owner-occupied houses - 8 rooms (%)
Rooms in owner-occupied houses - 9+ rooms (%)
Rooms in renter-occupied houses - 1 room (%)
Rooms in renter-occupied houses - 2 rooms (%)
Rooms in renter-occupied houses - 3 rooms (%)
Rooms in renter-occupied houses - 4 rooms (%)
Rooms in renter-occupied houses - 5 rooms (%)
Rooms in renter-occupied houses - 6 rooms (%)
Rooms in renter-occupied houses - 7 rooms (%)
Rooms in renter-occupied houses - 8 rooms (%)
Rooms in renter-occupied houses - 9+ rooms (%)
Bedrooms in owner-occupied houses - no bedrooms (%)
Bedrooms in owner-occupied houses - 1 bedroom (%)
Bedrooms in owner-occupied houses - 2 bedrooms (%)
Bedrooms in owner-occupied houses - 3 bedrooms (%)
Bedrooms in owner-occupied houses - 4 bedrooms (%)
Bedrooms in owner-occupied houses - 5+ bedrooms (%)
Bedrooms in renter-occupied houses - no bedrooms (%)
Bedrooms in renter-occupied houses - 1 bedroom (%)
Bedrooms in renter-occupied houses - 2 bedrooms (%)
Bedrooms in renter-occupied houses - 3 bedrooms (%)
Bedrooms in renter-occupied houses - 4 bedrooms (%)
Bedrooms in renter-occupied houses - 5+ bedrooms (%)
Vehicles available in owner-occupied houses - no vehicle available (%)
Vehicles available in owner-occupied houses - 1 vehicle available(%)
Vehicles available in owner-occupied houses - 2 Vehicles available (%)
Vehicles available in owner-occupied houses - 3 Vehicles available (%)
Vehicles available in owner-occupied houses - 4 Vehicles available (%)
Vehicles available in owner-occupied houses - 5+ Vehicles available (%)
Vehicles available in renter-occupied houses - no vehicle available (%)
Vehicles available in renter-occupied houses - 1 vehicle available (%)
Vehicles available in renter-occupied houses - 2 Vehicles available (%)
Vehicles available in renter-occupied houses - 3 Vehicles available (%)
Vehicles available in renter-occupied houses - 4 Vehicles available (%)
Vehicles available in renter-occupied houses - 5+ Vehicles available (%)
Housing units in structures - 1, detached (%)
Housing units in structures - 1, attached (%)
Housing units in structures - 2 (%)
Housing units in structures - 3 or 4 (%)
Housing units in structures - 5 to 9 (%)
Housing units in structures - 10 to 19 (%)
Housing units in structures - 20 to 49 (%)
Housing units in structures - 50 or more (%)
Housing units in structures - Mobile home (%)
Housing units in structures - Boat, RV, van, etc. (%)
Housing units in structures - Owners - 1, detached (%)
Housing units in structures - Owners - 1, attached (%)
Housing units in structures - Owners - 2 (%)
Housing units in structures - Owners - 3 or 4 (%)
Housing units in structures - Owners - 5 to 9 (%)
Housing units in structures - Owners - 10 to 19 (%)
Housing units in structures - Owners - 20 to 49 (%)
Housing units in structures - Owners - 50 or more (%)
Housing units in structures - Owners - Mobile home (%)
Housing units in structures - Owners - Boat, RV, van, etc. (%)
Housing units in structures - Renters - 1, detached (%)
Housing units in structures - Renters - 1, attached (%)
Housing units in structures - Renters - 2 (%)
Housing units in structures - Renters - 3 or 4 (%)
Housing units in structures - Renters - 5 to 9 (%)
Housing units in structures - Renters - 10 to 19 (%)
Housing units in structures - Renters - 20 to 49 (%)
Housing units in structures - Renters - 50 or more (%)
Housing units in structures - Renters - Mobile home (%)
Housing units in structures - Renters - Boat, RV, van, etc. (%)
House/condo owner moved in on average (years ago)
Renter moved in on average (years ago)
Year householder moved into unit - Moved in 1999 to March 2000 (%)
Year householder moved into unit - Moved in 1999 to March 2000 (%) - White
Year householder moved into unit - Moved in 1999 to March 2000 (%) - Black or African American
Year householder moved into unit - Moved in 1999 to March 2000 (%) - Asian
Year householder moved into unit - Moved in 1999 to March 2000 (%) - Hispanic or Latino
Year householder moved into unit - Moved in 1999 to March 2000 (%) - American Indian and Alaska Native
Year householder moved into unit - Moved in 1999 to March 2000 (%) - Multirace
Year householder moved into unit - Moved in 1999 to March 2000 (%) - Other Race
Year householder moved into unit - Moved in 1995 to 1998 (%)
Year householder moved into unit - Moved in 1995 to 1998 (%) - White
Year householder moved into unit - Moved in 1995 to 1998 (%) - Black or African American
Year householder moved into unit - Moved in 1995 to 1998 (%) - Asian
Year householder moved into unit - Moved in 1995 to 1998 (%) - Hispanic or Latino
Year householder moved into unit - Moved in 1995 to 1998 (%) - American Indian and Alaska Native
Year householder moved into unit - Moved in 1995 to 1998 (%) - Multirace
Year householder moved into unit - Moved in 1995 to 1998 (%) - Other Race
Year householder moved into unit - Moved in 1990 to 1994 (%)
Year householder moved into unit - Moved in 1990 to 1994 (%) - White
Year householder moved into unit - Moved in 1990 to 1994 (%) - Black or African American
Year householder moved into unit - Moved in 1990 to 1994 (%) - Asian
Year householder moved into unit - Moved in 1990 to 1994 (%) - Hispanic or Latino
Year householder moved into unit - Moved in 1990 to 1994 (%) - American Indian and Alaska Native
Year householder moved into unit - Moved in 1990 to 1994 (%) - Multirace
Year householder moved into unit - Moved in 1990 to 1994 (%) - Other Race
Year householder moved into unit - Moved in 1980 to 1989 (%)
Year householder moved into unit - Moved in 1980 to 1989 (%) - White
Year householder moved into unit - Moved in 1980 to 1989 (%) - Black or African American
Year householder moved into unit - Moved in 1980 to 1989 (%) - Asian
Year householder moved into unit - Moved in 1980 to 1989 (%) - Hispanic or Latino
Year householder moved into unit - Moved in 1980 to 1989 (%) - American Indian and Alaska Native
Year householder moved into unit - Moved in 1980 to 1989 (%) - Multirace
Year householder moved into unit - Moved in 1980 to 1989 (%) - Other Race
Year householder moved into unit - Moved in 1970 to 1979 (%)
Year householder moved into unit - Moved in 1970 to 1979 (%) - White
Year householder moved into unit - Moved in 1970 to 1979 (%) - Black or African American
Year householder moved into unit - Moved in 1970 to 1979 (%) - Asian
Year householder moved into unit - Moved in 1970 to 1979 (%) - Hispanic or Latino
Year householder moved into unit - Moved in 1970 to 1979 (%) - American Indian and Alaska Native
Year householder moved into unit - Moved in 1970 to 1979 (%) - Multirace
Year householder moved into unit - Moved in 1970 to 1979 (%) - Other Race
Year householder moved into unit - Moved in 1969 or earlier (%)
Year householder moved into unit - Moved in 1969 or earlier (%) - White
Year householder moved into unit - Moved in 1969 or earlier (%) - Black or African American
Year householder moved into unit - Moved in 1969 or earlier (%) - Asian
Year householder moved into unit - Moved in 1969 or earlier (%) - Hispanic or Latino
Year householder moved into unit - Moved in 1969 or earlier (%) - American Indian and Alaska Native
Year householder moved into unit - Moved in 1969 or earlier (%) - Multirace
Year householder moved into unit - Moved in 1969 or earlier (%) - Other Race
Housing units lacking complete plumbing facilities (%)
Housing units lacking complete kitchen facilities (%)
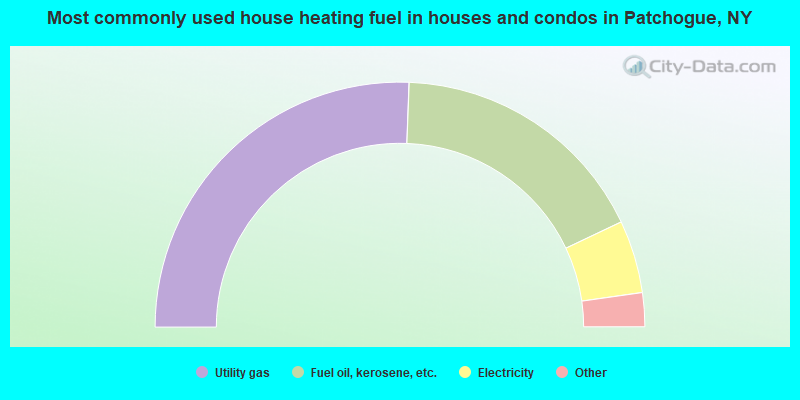
House heating fuel used in houses and condos - Utility gas (%)
House heating fuel used in houses and condos - Bottled, tank, or LP gas (%)
House heating fuel used in houses and condos - Electricity (%)
House heating fuel used in houses and condos - Fuel oil, kerosene, etc. (%)
House heating fuel used in houses and condos - Coal or coke (%)
House heating fuel used in houses and condos - Wood (%)
House heating fuel used in houses and condos - Solar energy (%)
House heating fuel used in houses and condos - Other fuel (%)
House heating fuel used in houses and condos - No fuel used (%)
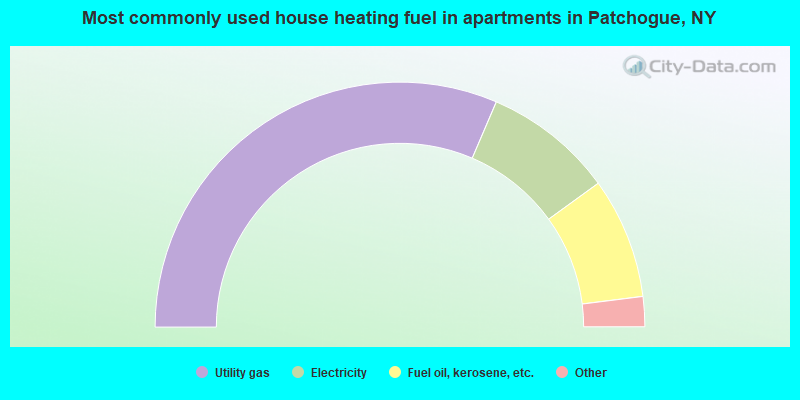
House heating fuel used in apartments - Utility gas (%)
House heating fuel used in apartments - Bottled, tank, or LP gas (%)
House heating fuel used in apartments - Electricity (%)
House heating fuel used in apartments - Fuel oil, kerosene, etc. (%)
House heating fuel used in apartments - Coal or coke (%)
House heating fuel used in apartments - Wood (%)
House heating fuel used in apartments - Solar energy (%)
House heating fuel used in apartments - Other fuel (%)
House heating fuel used in apartments - No fuel used (%)
Latest news about housing in Patchogue, NY collected exclusively by city-data.com from local newspapers, TV, and radio stations
Median year house/condo built: 1962Median year apartment built: 1971Household type by relationship:
Households: 12,350
Male householders: 2,753 (888 living alone ), Female householders: 2,518 (844 living alone )1,928 spouses (1,868 opposite-sex spouses ), 729 unmarried partners , (708 opposite-sex unmarried partners ), 3,294 children (3,203 natural , 34 adopted , 57 stepchildren ), 244 grandchildren , 112 brothers or sisters , 158 parents , 0 foster children , 290 other relatives , 211 non-relatives In group quarters: 111
Size of family households: 1,336 2-persons , 712 3-persons , 523 4-persons , 260 5-persons , 37 6-persons , 27 7-or-more-persons .
Size of nonfamily households: 1,746 1-person , 652 2-persons , 11 3-persons .
1,048 married couples with children. single-parent households (156 men , 514 women ).
76.9% of residents of Patchogue speak English at home. of residents speak Spanish at home (46% speak English very well , 36% speak English well , 15% speak English not well , 4% don't speak English at all ).of residents speak other Indo-European language at home (94% speak English very well , 5% speak English well , 1% speak English not well ).of residents speak Asian or Pacific Island language at home (74% speak English very well , 26% speak English well ).
Foreign born population: 2,063 (16.7%)of them are naturalized citizens )
Median number of rooms in houses and condos:
Median number of rooms in apartments
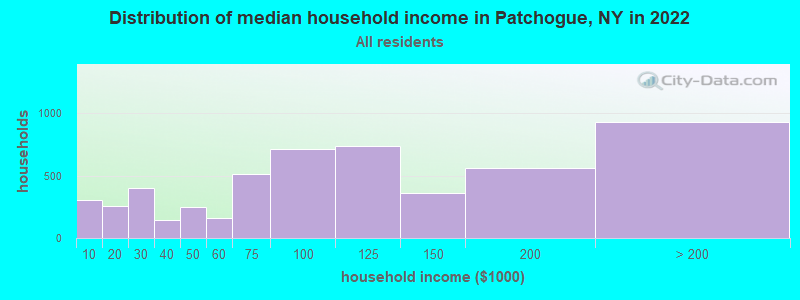
Patchogue, NY household income distribution 301 Less than $10,000254 $10,000 to $19,999397 $20,000 to $29,999145 $30,000 to $39,999246 $40,000 to $49,999163 $50,000 to $59,999516 $60,000 to $74,999715 $75,000 to $99,999739 $100,000 to $124,999360 $125,000 to $149,999560 $150,000 to $199,999930 $200,000 or more
Home value of owner - occupied houses in 2022 in Patchogue, NY 11 $30,000 to $34,99934 $40,000 to $49,99915 $60,000 to $69,99920 $100,000 to $124,99912 $125,000 to $149,99935 $150,000 to $174,99958 $175,000 to $199,999100 $200,000 to $249,999112 $250,000 to $299,999549 $300,000 to $399,999929 $400,000 to $499,999666 $500,000 to $749,999151 $750,000 to $999,99935 $1,500,000 to $1,999,99912 $2,000,000 or moreRent paid by renters in 2022 in Patchogue, NY 10 $150 to $19937 $250 to $29919 $400 to $44924 $450 to $49929 $500 to $54914 $550 to $59914 $600 to $6496 $650 to $69991 $800 to $89929 $900 to $999437 $1,000 to $1,24965 $1,250 to $1,499311 $1,500 to $1,999629 $2,000 to $2,499440 $2,500 to $2,999102 $3,000 to $3,49993 $3,500 or more61 No cash rent
Percentage of workers working in this county: 87.0%Number of people working at home: 618 (8.0% of all workers )
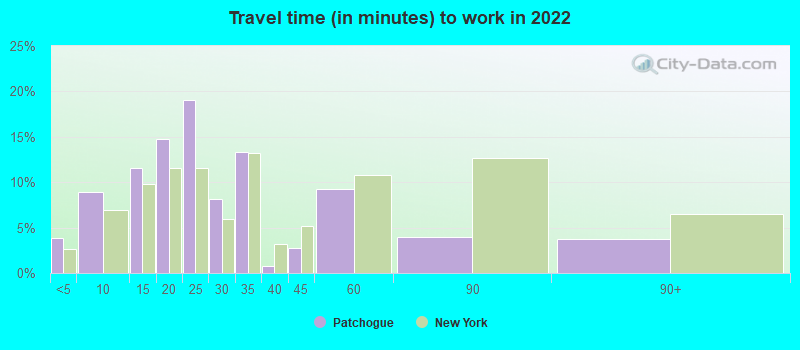
Travel time to work (commute)
Less than 5 minutes: 1335 to 9 minutes: 66810 to 14 minutes: 63615 to 19 minutes: 92420 to 24 minutes: 86125 to 29 minutes: 70730 to 34 minutes: 1,06935 to 39 minutes: 17340 to 44 minutes: 33245 to 59 minutes: 57460 to 89 minutes: 60290 or more minutes: 358
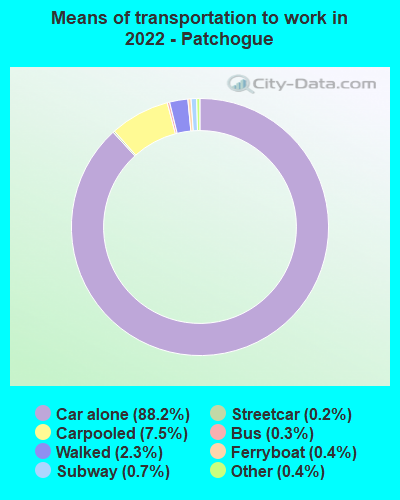
Means of transportation to work:
Drove a car alone: 5,934 (78.3%)Carpooled: 580 (7.6%)Bus : 20 (0.3%)Subway or elevated rail : 13 (0.2%)Long-distance train or commuter rail : 47 (0.6%)Ferryboat: 12 (0.2%)Taxi: 33 (0.4%)Walked: 163 (2.1%)Worked at home: 618 (8.2%)
Unemployment by race in 2022
Unemployment rate for White non-Hispanic residents 2.7% Males3.5% FemalesUnemployment rate for Black residents 38.2% FemalesUnemployment rate for two or more race residents 13.2% MalesUnemployment rate for Hispanic or Latino residents 4.8% Males10.0% Females
Year of entry for the foreign-born population in Patchogue, New York
469 2010 or later 684 2000 to 2009 584 1990 to 1999 318 1980 to 1989 157 1970 to 1979 247 Before 1970
First ancestries reported:
Italian: 1,292 (24.3%)
European: 343 (6.4%)
Irish: 338 (6.3%)
American: 309 (5.8%)
Haitian: 166 (3.1%)
German: 154 (2.9%)
Polish: 137 (2.6%)
Ghanaian: 124 (2.3%)
Eastern European: 70 (1.3%)
English: 37 (0.7%)
French: 37 (0.7%)
Egyptian: 36 (0.7%)
Dutch: 31 (0.6%)
Russian: 31 (0.6%)
Iranian: 29 (0.5%)
Scottish: 28 (0.5%)
Turkish: 25 (0.5%)
Scotch-Irish: 20 (0.4%)
Belgian: 19 (0.4%)
British: 19 (0.4%)
Hungarian: 8 (0.2%)
Scandinavian: 8 (0.2%)
Welsh: 8 (0.2%) Most common places of birth for foreign-born residents (%): Ecuador Patchogue:
35.2% (670)New York:
3.9% (177,448)
Colombia Patchogue:
8.0% (153)New York:
2.5% (111,920)
Haiti Patchogue:
7.0% (134)New York:
2.8% (126,936)
Trinidad and Tobago Patchogue:
5.7% (108)New York:
2.0% (91,428)
El Salvador Patchogue:
5.0% (96)New York:
2.4% (108,067)
Mexico Patchogue:
4.3% (82)New York:
4.8% (214,559)
Dominican Republic Patchogue:
4.1% (79)New York:
11.1% (501,040)
Poland Patchogue:
3.8% (72)New York:
1.4% (65,102)
Pakistan Patchogue:
3.4% (65)New York:
1.4% (62,442)
Philippines Patchogue:
2.8% (53)New York:
2.0% (91,070)
Ghana Patchogue:
2.8% (53)New York:
0.9% (39,058)
Turkey Patchogue:
2.4% (46)New York:
0.5% (21,009)
India Patchogue:
2.0% (38)New York:
3.5% (158,432)
Spain Patchogue:
1.9% (36)New York:
0.3% (14,949)
Germany Patchogue:
1.8% (34)New York:
0.9% (38,713)
Egypt Patchogue:
1.7% (32)New York:
0.6% (27,385)
Place of birth for U.S.-born residents:
This state: 8,954Other state: 1,067Northeast: 218Midwest: 176South: 368West: 330 84.8% of Patchogue residents lived in the same house 1 years ago.
Out of people who lived in different houses, 44.3% lived in this county.
Out of people who lived in different counties, 70.1% lived in New York.
Patchogue:
84.8%State average:
89.6%
Education attainment for males 25 years and older:
No schooling: 271Nursery to 4th grade: 05th and 6th grade: 2687th and 8th grade: 79th grade: 1810th grade: 011th grade: 3312th grade, no diploma: 11High school graduate (or equivalency): 1,006Less than 1 year of college: 251Some college more than 1 year, no degree: 649Associate degree: 565Bachelor's degree: 967Master's degree: 441Professional school degree: 181Doctorate degree: 112
Education attainment for females 25 years and older:
No schooling: 141Nursery to 4th grade: 05th and 6th grade: 587th and 8th grade: 09th grade: 7110th grade: 1511th grade: 7012th grade, no diploma: 136High school graduate (or equivalency): 970Less than 1 year of college: 92Some college more than 1 year, no degree: 625Associate degree: 584Bachelor's degree: 896Master's degree: 847Professional school degree: 154Doctorate degree: 62
Housing units in structures:
One, detached: 2,795One, attached: 297Two: 5363 or 4: 1515 to 9: 48710 to 19: 35920 to 49: 37850 or more: 493House/condo owner moved in on average 11 years ago
Renter moved in on average 1 years ago
Private vs. public school enrollment:
Students in private schools in grades 1 to 8 (elementary and middle school): 14 Students in private schools in grades 9 to 12 (high school): 0 Students in private undergraduate colleges: 252