Housing density: 116 houses/condos per square mile
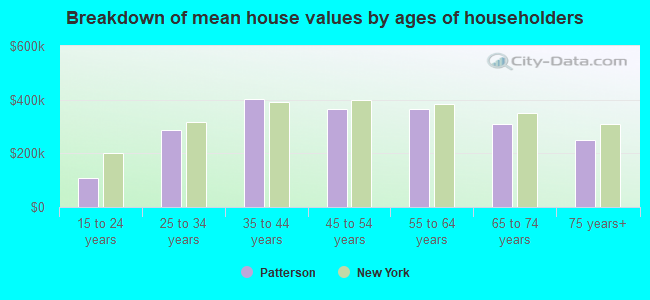
Median price asked for vacant for-sale houses and condos in 2022 in this county: $538,616.
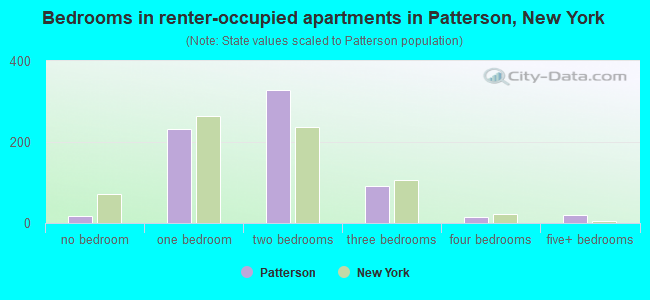
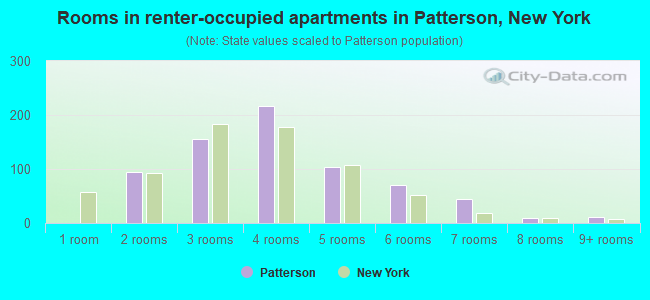
Median contract rent in 2022: $1,631 (lower quartile is $1,324, upper quartile is $1,957)
Median rent asked for vacant for-rent units in 2022: $1,319
Median gross rent in Patterson, NY in 2022: $1,782
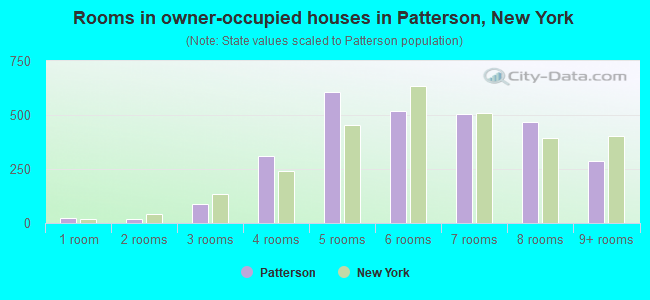
Housing units in Patterson with a mortgage: 1,919 (159 second mortgage, 194 home equity loan, 0 both second mortgage and home equity loan) Houses without a mortgage: 479
In family households: 86,182 (19,004 male householders, 7,256 female householders)
21,650 spouses, 31,544 children (30,091 natural, 616 adopted, 837 stepchildren), 1,205 grandchildren, 762 brothers or sisters, 1,136 parents, foster children, 975 other relatives, 1,732 non-relatives
In nonfamily households: 10,936 (4,152 male householders (3,154 living alone)), 4,629 female householders (3,961 living alone)), 2,155 nonrelatives
In group quarters: 2,592 (674 institutionalized population)
20,870 married couples with children.
2,877 single-parent households (655 men, 2,222 women).
90.3% of residents of Patterson speak English at home.
4.4% of residents speak Spanish at home (70% speak English very well, 18% speak English well, 12% speak English not well).
4.9% of residents speak other Indo-European language at home (65% speak English very well, 22% speak English well, 13% speak English not well).
0.1% of residents speak Asian or Pacific Island language at home (100% speak English very well).
0.3% of residents speak other language at home (29% speak English very well, 71% speak English well).
Foreign born population: 941 (8.1%)
(74.0% of them are naturalized citizens)
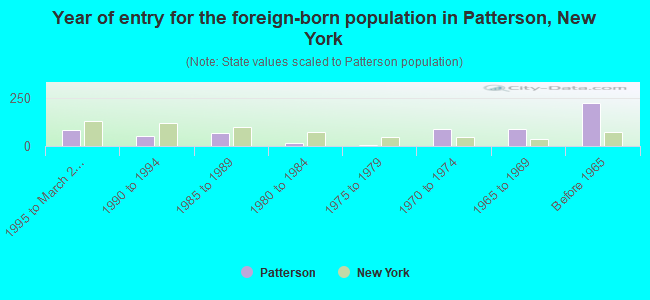
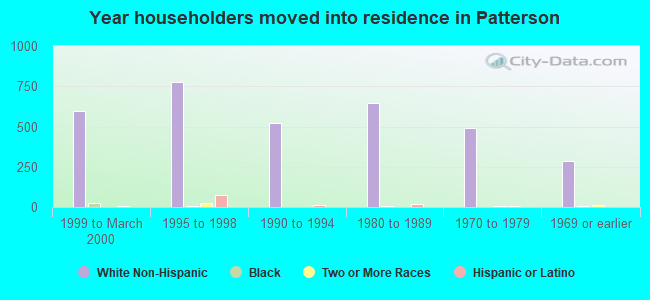
Year of entry for the foreign-born population in Patterson, New York
811995 to March 2000
531990 to 1994
691985 to 1989
181980 to 1984
41975 to 1979
861970 to 1974
881965 to 1969
220Before 1965
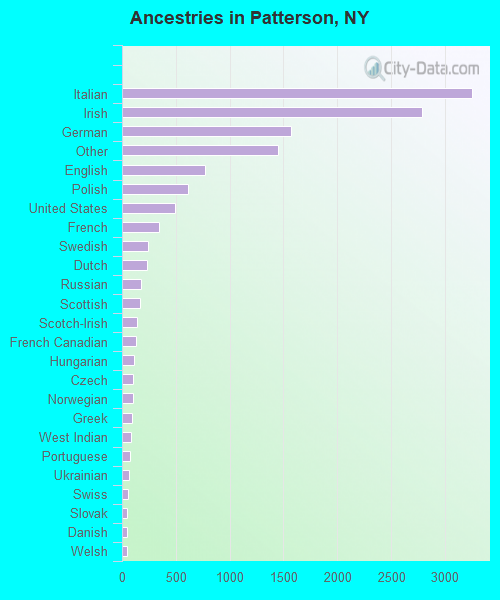
First ancestries reported:
Italian: 3,248 (24.5%)
Irish: 2,784 (21.0%)
German: 1,575 (11.9%)
Other: 1,452 (10.9%)
English: 773 (5.8%)
Polish: 614 (4.6%)
United States: 494 (3.7%)
French: 345 (2.6%)
Swedish: 245 (1.8%)
Dutch: 233 (1.8%)
Russian: 175 (1.3%)
Scottish: 171 (1.3%)
Scotch-Irish: 141 (1.1%)
French Canadian: 132 (1.0%)
Hungarian: 111 (0.8%)
Czech: 105 (0.8%)
Norwegian: 104 (0.8%)
Greek: 96 (0.7%)
West Indian: 87 (0.7%)
Portuguese: 70 (0.5%)
Ukrainian: 64 (0.5%)
Swiss: 57 (0.4%)
Slovak: 51 (0.4%)
Danish: 49 (0.4%)
Welsh: 42 (0.3%)
Lithuanian: 26 (0.2%)
Arab: 22 (0.2%)
Subsaharan African: 8 (0.06%)
Most common places of birth for foreign-born residents (%):
Italy
Patterson:
18.3% (113)
New York:
3.8% (147,729)
Germany
Patterson:
13.9% (86)
New York:
1.8% (69,327)
Canada
Patterson:
9.2% (57)
New York:
1.4% (54,876)
United Kingdom
Patterson:
7.3% (45)
New York:
1.6% (62,237)
Portugal
Patterson:
5.8% (36)
New York:
0.3% (13,508)
Jamaica
Patterson:
5.0% (31)
New York:
5.9% (226,470)
Poland
Patterson:
4.4% (27)
New York:
2.4% (93,187)
Haiti
Patterson:
4.4% (27)
New York:
3.2% (125,475)
Czechoslovakia (includes Czech Republic and Slovakia)
Patterson:
4.2% (26)
New York:
0.3% (13,246)
Ireland
Patterson:
3.2% (20)
New York:
1.1% (41,934)
Ecuador
Patterson:
2.9% (18)
New York:
3.6% (139,226)
Argentina
Patterson:
2.6% (16)
New York:
0.5% (17,906)
Other Eastern Europe
Patterson:
2.3% (14)
New York:
1.4% (53,825)
Other Northern Europe
Patterson:
1.8% (11)
New York:
0.2% (7,839)
Hungary
Patterson:
1.8% (11)
New York:
0.4% (17,401)
Hong Kong
Patterson:
1.6% (10)
New York:
1.0% (37,496)
Place of birth for U.S.-born residents:
This state: 8,782
Other state: 1,795
Northeast: 1,154
Midwest: 209
South: 318
West: 114
58% of Patterson residents lived in the same house 5 years ago. Out of people who lived in different houses, 33% lived in this county. Out of people who lived in different counties, 83% lived in New York.
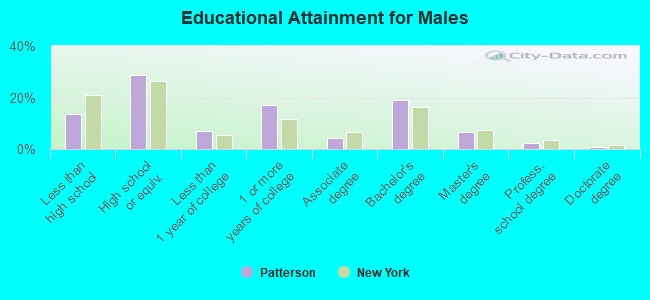
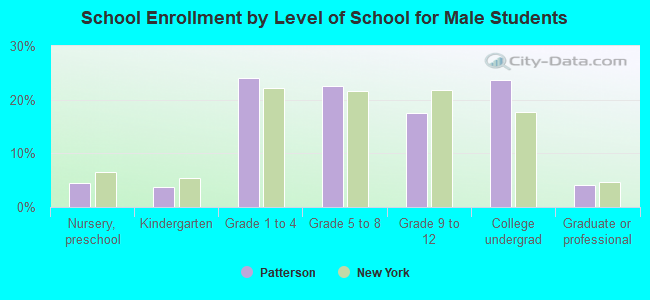
Education attainment for males 25 years and older:
No schooling: 52
Nursery to 4th grade: 0
5th and 6th grade: 16
7th and 8th grade: 99
9th grade: 91
10th grade: 84
11th grade: 45
12th grade, no diploma: 145
High school graduate (or equivalency): 1,113
Less than 1 year of college: 279
Some college more than 1 year, no degree: 664
Associate degree: 171
Bachelor's degree: 749
Master's degree: 264
Professional school degree: 94
Doctorate degree: 30
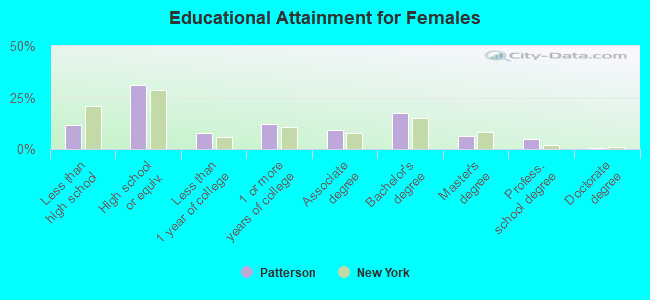
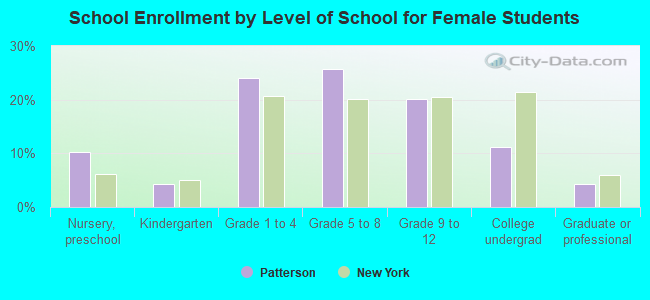
Education attainment for females 25 years and older:
No schooling: 6
Nursery to 4th grade: 5
5th and 6th grade: 19
7th and 8th grade: 44
9th grade: 44
10th grade: 175
11th grade: 40
12th grade, no diploma: 103
High school graduate (or equivalency): 1,165
Less than 1 year of college: 293
Some college more than 1 year, no degree: 448
Associate degree: 342
Bachelor's degree: 648
Master's degree: 233
Professional school degree: 176
Doctorate degree: 10
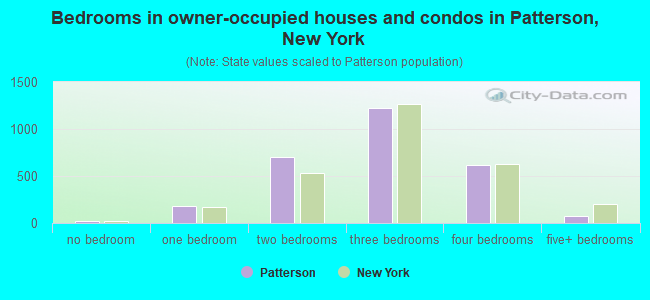
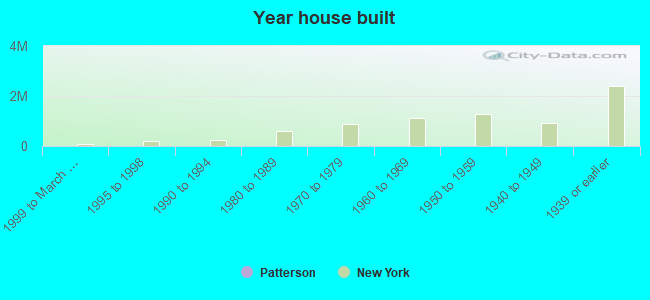
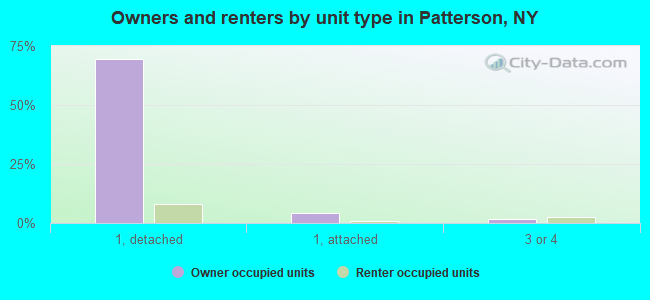
Housing units in structures:
One, detached: 2,935
One, attached: 196
Two: 141
3 or 4: 146
5 to 9: 94
10 to 19: 103
20 to 49: 65
50 or more: 7
Mobile homes: 59
Housing units lacking complete plumbing facilities: 0.2%
Housing units lacking complete kitchen facilities: 0.2%