Patterson Springs, NC (North Carolina) Houses and Residents
| Patterson Springs: | $127,739 |
| North Carolina: | $280,600 |
Mean price in 2022:
Detached houses: $135,025
Here: $135,025 State: $375,326 Mobile homes: $40,255
Here: $40,255 State: $124,933
Total population: 608 (Urban population: 474 (all inside urban clusters), Rural population: 96 (all nonfarm))
Houses: 331 (292 occupied: 205 owner occupied, 100 renter occupied)
| % of renters here: | 33% |
| State: | 33% |
Housing density: 364 houses/condos per square mile
Median price asked for vacant for-sale houses and condos in 2022 in this county: $203,522.
Median contract rent in 2022: $735 (lower quartile is $457, upper quartile is $715)
Median rent asked for vacant for-rent units in 2022: $1,483
Median gross rent in Patterson Springs, NC in 2022: $934
Housing units in Patterson Springs with a mortgage: 92 (1 second mortgage, 0 home equity loan, 1 both second mortgage and home equity loan)
Houses without a mortgage: 0
Median household income for houses/condos with a mortgage: $62,044
Median household income for apartments without a mortgage: $27,699
Median monthly housing costs: $652
Compare current foreclosures near Patterson Springs, NC:
| Photo | Address | Area | Beds / Baths | Price | Details |
|---|---|---|---|---|---|

|
#1
Webb Rd
Shelby, NC 28152
|
1,363 sq. feet
|
2 baths 3 beds |
show details | |

|
#2
Fulton St
Kings Mountain, NC 28086
|
1,136 sq. feet
|
1 baths 2 beds |
show details | |

|
#3
Fletcher Rd
Lawndale, NC 28090
|
1,460 sq. feet
|
1 baths 2 beds |
show details | |

|
#4
Mcarthur St
Gaffney, SC 29340
|
1,036 sq. feet
|
1 baths 3 beds |
show details | |

|
#5
Carver St
Gaffney, SC 29341
|
- sq. feet
|
1 baths 3 beds |
show details | |

|
#6
Hidden Valley St
Cherryville, NC 28021
|
1,628 sq. feet
|
2 baths 3 beds |
show details | |

|
#7
Toncin Ave
Bessemer City, NC 28016
|
1,599 sq. feet
|
2 baths 3 beds |
show details | |

|
#8
Lewis Curry Rd
Kings Mountain, NC 28086
|
640 sq. feet
|
1 baths 2 beds |
show details | |

|
#9
Tot Dellinger Rd
Cherryville, NC 28021
|
1,232 sq. feet
|
2 baths 3 beds |
show details | |

|
#10
Eaker Rd
Kings Mountain, NC 28086
|
1,645 sq. feet
|
1 baths 2 beds |
show details |
| Photo | Address | Area | Beds / Baths | Price | Details |
|---|---|---|---|---|---|

|
#11
Lewis Rd
Gastonia, NC 28052
|
1,620 sq. feet
|
2 baths 3 beds |
show details | |

|
#12
Spruce St
Gaffney, SC 29340
|
- sq. feet
|
- baths - beds |
$25,000
|
show details |

|
#13
Nc 120 Hwy
Mooresboro, NC 28114
|
1,680 sq. feet
|
2 baths 3 beds |
show details | |

|
#14
E Tennessee Ave
Bessemer City, NC 28016
|
1,036 sq. feet
|
1 baths 2 beds |
show details | |

|
#15
Costner School Rd
Bessemer City, NC 28016
|
1,950 sq. feet
|
1 baths 3 beds |
show details | |

|
#16
S Mountain St
Cherryville, NC 28021
|
1,701 sq. feet
|
1 baths 3 beds |
show details | |

|
#17
Surratte Dr
Kings Mountain, NC 28086
|
1,400 sq. feet
|
2 baths 3 beds |
show details | |

|
#18
W 2nd St
Cherryville, NC 28021
|
1,348 sq. feet
|
1 baths 3 beds |
show details | |

|
#19
Luckadoo Hill Ext
Mooresboro, NC 28114
|
1,272 sq. feet
|
1 baths 3 beds |
show details | |

|
#20
Unity Church Rd
Kings Mountain, NC 28086
|
1,056 sq. feet
|
2 baths 3 beds |
show details |
| Photo | Address | Area | Beds / Baths | Price | Details |
|---|---|---|---|---|---|

|
#21
Webb Rd
Ellenboro, NC 28040
|
1,652 sq. feet
|
1 baths 3 beds |
show details | |

|
#22
Todd Dr
Bessemer City, NC 28016
|
1,812 sq. feet
|
2 baths 3 beds |
show details | |

|
#23
Stoney Oaks Dr
Gastonia, NC 28052
|
1,680 sq. feet
|
2 baths 3 beds |
show details | |

|
#24
Mccrow Rd
Mooresboro, NC 28114
|
1,064 sq. feet
|
1 baths 3 beds |
show details | |

|
#25
Barkers Ridge Dr
Bessemer City, NC 28016
|
1,800 sq. feet
|
2 baths 3 beds |
show details | |

|
#26
Starrland Dr
Gastonia, NC 28052
|
1,056 sq. feet
|
1 baths 3 beds |
show details | |

|
#27
Venus Ave
Gastonia, NC 28052
|
1,000 sq. feet
|
2 baths 3 beds |
show details | |

|
#28
Oak Grove Church Rd
Ellenboro, NC 28040
|
1,528 sq. feet
|
3 baths 3 beds |
show details | |

|
#29
Stagbuck Dr
Gastonia, NC 28052
|
1,307 sq. feet
|
2 baths 3 beds |
show details | |

|
#30
Knollwood Dr
Gastonia, NC 28052
|
1,150 sq. feet
|
1 baths 3 beds |
show details |
| Photo | Address | Area | Beds / Baths | Price | Details |
|---|---|---|---|---|---|

|
#31
Matthews Dr
Gastonia, NC 28052
|
1,420 sq. feet
|
1 baths 4 beds |
show details | |

|
#32
Harris Henrietta Rd
Mooresboro, NC 28114
|
1,162 sq. feet
|
1 baths 3 beds |
show details | |

|
#33
Split Oak Trl
Gastonia, NC 28052
|
1,270 sq. feet
|
2 baths 3 beds |
show details | |

|
#34
Shannon Bradley Rd
Gastonia, NC 28052
|
1,008 sq. feet
|
1 baths 4 beds |
show details | |

|
#35
Owl Ln
Shelby, NC 28152
|
1,080 sq. feet
|
- baths - beds |
show details | |

|
#36
Merit Dr
Shelby, NC 28150
|
1,292 sq. feet
|
- baths - beds |
show details | |

|
#37
Filter Plant Rd
Gaffney, SC 29340
|
1,058 sq. feet
|
- baths - beds |
show details | |

|
#38
Goforth Rd
Kings Mountain, NC 28086
|
2,309 sq. feet
|
- baths - beds |
show details | |

|
#39
W Franklin Blvd
Gastonia, NC 28052
|
- sq. feet
|
1 baths 2 beds |
show details | |

|
#40
Mintzfield Dr
Lawndale, NC 28090
|
- sq. feet
|
- baths - beds |
show details |
| Photo | Address | Area | Beds / Baths | Price | Details |
|---|---|---|---|---|---|

|
#41
Mccluney Dr
Gaffney, SC 29340
|
- sq. feet
|
- baths - beds |
show details | |

|
#42
Davis Rd
Shelby, NC 28152
|
1,237 sq. feet
|
- baths - beds |
show details | |

|
#43
N White Oak Dr
Shelby, NC 28150
|
1,334 sq. feet
|
- baths - beds |
show details | |

|
#44
W Buford St
Gaffney, SC 29341
|
1,458 sq. feet
|
- baths - beds |
show details | |

|
#45
Old Mckown Farm Rd
Gaffney, SC 29340
|
2,016 sq. feet
|
- baths - beds |
show details | |

|
#46
Sandy Run Church Rd # 1
Mooresboro, NC 28114
|
1,152 sq. feet
|
- baths - beds |
show details | |

|
#47
Ward St
Lawndale, NC 28090
|
- sq. feet
|
- baths - beds |
show details | |

|
#48
North Dr
Cherryville, NC 28021
|
- sq. feet
|
- baths - beds |
show details | |

|
#49
E Ridge St
Kings Mountain, NC 28086
|
- sq. feet
|
- baths - beds |
show details | |

|
Check over 1 million property listings on Foreclosure.com!
|
browse all offers | |||


Median year apartment built: 1968
Household type by relationship:
Households: 863- Male householders: 148 (57 living alone), Female householders: 143 (25 living alone)
101 spouses (101 opposite-sex spouses), 33 unmarried partners, (31 opposite-sex unmarried partners), 314 children (313 natural, 0 adopted, 1 stepchildren), 15 grandchildren, 0 brothers or sisters, 26 parents, 0 foster children, 0 other relatives, 80 non-relatives
Size of family households: 47 2-persons, 71 3-persons, 21 4-persons, 23 5-persons, 36 6-persons.
Size of nonfamily households: 80 1-person, 18 2-persons, 17 3-persons.
103 married couples with children.
64 single-parent households (4 men, 60 women).
96.9% of residents of Patterson Springs speak English at home.
2.7% of residents speak Spanish at home (100% speak English very well).
Foreign born population: 7 (0.8%)
(114.3% of them are naturalized citizens)
| Here: | 5.2 |
| State: | 6.4 |
| Here: | 4.5 |
| State: | 4.4 |

- Bedrooms in owner-occupied houses and condos in Patterson Springs, North Carolina
- 2no bedroom
- 01 bedroom
- 482 bedrooms
- 1403 bedrooms
- 104 bedrooms
- 65+ bedrooms

- Bedrooms in renter-occupied apartments in Patterson Springs, North Carolina
- 0no bedroom
- 01 bedroom
- 482 bedrooms
- 533 bedrooms
- 04 bedrooms
- 05+ bedrooms

- Cars and other vehicles available in Patterson Springs in owner-occupied houses/condos
- 16no vehicle
- 431 vehicle
- 662 vehicles
- 543 vehicles
- 234 vehicles
- 35+ vehicles

- Cars and other vehicles available in Patterson Springs in renter-occupied apartments
- 2no vehicle
- 371 vehicle
- 562 vehicles
- 53 vehicles
- 04 vehicles
- 05+ vehicles

- Rooms in owner-occupied houses in Patterson Springs, North Carolina
- 01 room
- 02 rooms
- 43 rooms
- 364 rooms
- 765 rooms
- 466 rooms
- 137 rooms
- 128 rooms
- 199+ rooms

- Rooms in renter-occupied apartments in Patterson Springs, North Carolina
- 01 room
- 02 rooms
- 143 rooms
- 394 rooms
- 385 rooms
- 106 rooms
- 07 rooms
- 08 rooms
- 09+ rooms


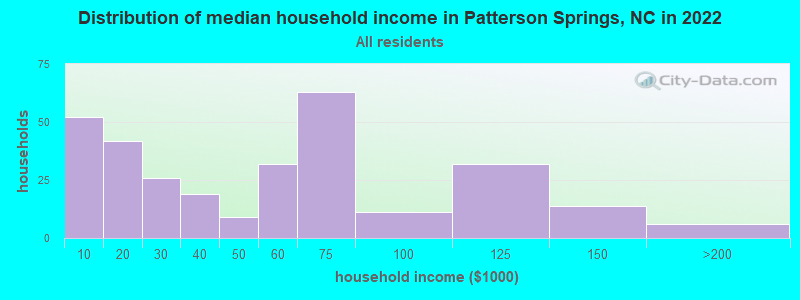
Patterson Springs, NC household income distribution

- 52Less than $10,000
- 42$10,000 to $19,999
- 26$20,000 to $29,999
- 19$30,000 to $39,999
- 9$40,000 to $49,999
- 32$50,000 to $59,999
- 63$60,000 to $74,999
- 11$75,000 to $99,999
- 32$100,000 to $124,999
- 14$125,000 to $149,999
- 6$150,000 to $199,999
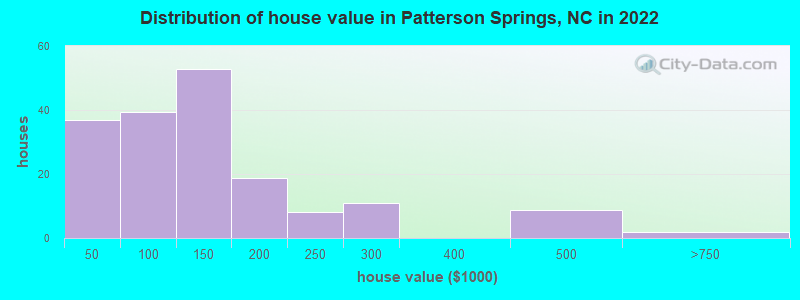
Home value of owner - occupied houses in 2022 in Patterson Springs, NC
-
- 26Less than $10,000
- 9$10,000 to $14,999
- 0$20,000 to $24,999
- 17$50,000 to $59,999
- 2$60,000 to $69,999
- 1$70,000 to $79,999
- 13$80,000 to $89,999
- 4$90,000 to $99,999
- 31$100,000 to $124,999
- 21$125,000 to $149,999
- 9$150,000 to $174,999
- 8$175,000 to $199,999
- 8$200,000 to $249,999
- 10$250,000 to $299,999
- 8$400,000 to $499,999
- 1$500,000 to $749,999
Rent paid by renters in 2022 in Patterson Springs, NC
-
- 2$100 to $149
- 3$300 to $349
- 6$350 to $399
- 13$400 to $449
- 2$450 to $499
- 3$550 to $599
- 7$600 to $649
- 94$650 to $699
- 5$800 to $899
- 8$2,000 to $2,499
- 5No cash rent


Percentage of workers working in this county: 76.5%
Number of people working at home: 0 (0.0% of all workers)
Travel time to work (commute)
- Less than 5 minutes: 6
- 5 to 9 minutes: 52
- 10 to 14 minutes: 18
- 15 to 19 minutes: 54
- 20 to 24 minutes: 49
- 25 to 29 minutes: 8
- 30 to 34 minutes: 63
- 35 to 39 minutes: 1
- 40 to 44 minutes: 5
- 45 to 59 minutes: 2
- 60 to 89 minutes: 58
- 90 or more minutes: 2
Means of transportation to work:
- Drove a car alone: 243 (85.6%)
- Carpooled: 35 (12.3%)
- Worked at home: 6 (2.1%)

- Unemployment by race in 2022
- Unemployment rate for White non-Hispanic residents
- 6.8%Males
- 9.8%Females

First ancestries reported:
- English: 193 (36.2%)
- American: 109 (20.5%)
- European: 18 (3.4%)
- German: 17 (3.2%)
- Italian: 12 (2.3%)
- Irish: 5 (0.9%)
- Scottish: 4 (0.8%)
- Welsh: 2 (0.4%)
- Scotch-Irish: 1 (0.2%)
Most common places of birth for foreign-born residents (%):
| Patterson Springs: | 100.0% (8) |
| North Carolina: | 2.1% (18,105) |
Place of birth for U.S.-born residents:
- This state: 647
- Other state: 205
- Northeast: 30
- Midwest: 34
- South: 87
- West: 57
88.9% of Patterson Springs residents lived in the same house 1 years ago.
Out of people who lived in different houses, 35.4% lived in this county.
Out of people who lived in different counties, 64.1% lived in North Carolina.
| Patterson Springs: | 88.9% |
| State average: | 87.3% |
Education attainment for males 25 years and older:
- No schooling: 0
- Nursery to 4th grade: 0
- 5th and 6th grade: 0
- 7th and 8th grade: 7
- 9th grade: 7
- 10th grade: 7
- 11th grade: 0
- 12th grade, no diploma: 1
- High school graduate (or equivalency): 82
- Less than 1 year of college: 18
- Some college more than 1 year, no degree: 27
- Associate degree: 70
- Bachelor's degree: 30
- Master's degree: 11
- Professional school degree: 0
- Doctorate degree: 0

Education attainment for females 25 years and older:
- No schooling: 0
- Nursery to 4th grade: 0
- 5th and 6th grade: 0
- 7th and 8th grade: 4
- 9th grade: 0
- 10th grade: 0
- 11th grade: 1
- 12th grade, no diploma: 0
- High school graduate (or equivalency): 175
- Less than 1 year of college: 22
- Some college more than 1 year, no degree: 19
- Associate degree: 35
- Bachelor's degree: 24
- Master's degree: 13
- Professional school degree: 0
- Doctorate degree: 0


Housing units in structures:
- One, detached: 226
- One, attached: 3
- 50 or more: 6
- Mobile homes: 95
Median worth of mobile homes: $10,874
House/condo owner moved in on average 22 years ago
Renter moved in on average 6 years ago

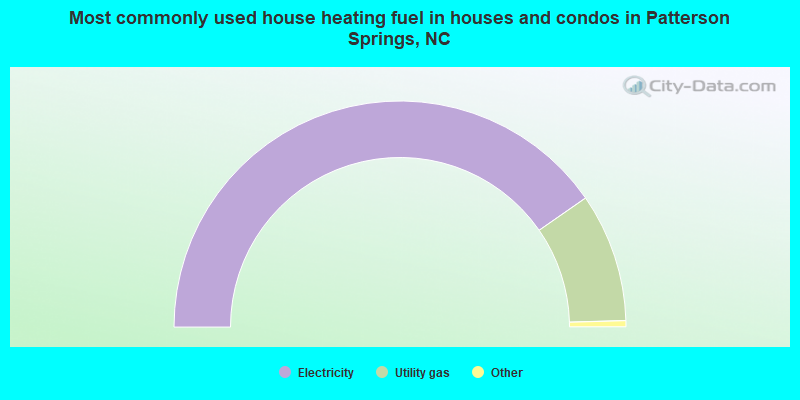
- 81.4%Electricity
- 18.6%Utility gas
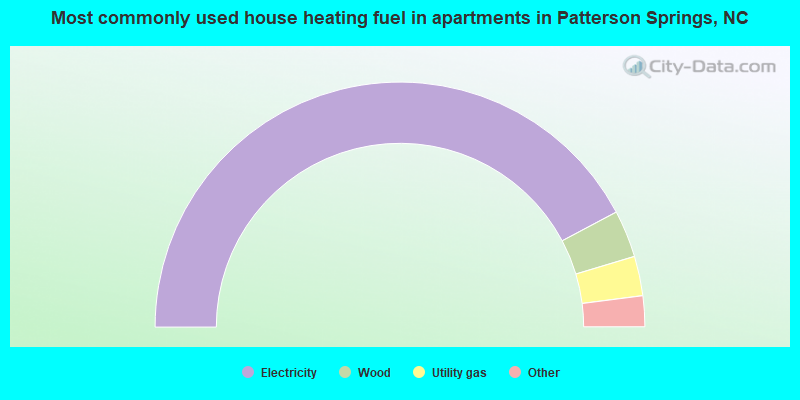
- 85.3%Electricity
- 6.3%Wood
- 5.3%Utility gas
- 2.1%Fuel oil, kerosene, etc.
- 1.1%No fuel used
Private vs. public school enrollment:
| Here: | 6.5% |
| North Carolina: | 13.8% |
| Here: | 25.9% |
| North Carolina: | 11.9% |
| Here: | 9.1% |
| North Carolina: | 19.3% |


