Penn Valley, CA (California) Houses and Residents
| Penn Valley: | $594,603 |
| California: | $715,900 |
Mean price in 2022:
Detached houses: $559,577
Here: $559,577 State: $988,808 Mobile homes: $80,343
Here: $80,343 State: $184,506
Total population: 1,621 (Urban population: 1,331 (all inside urban clusters), Rural population: 109 (all nonfarm))
Houses: 606 (483 occupied: 389 owner occupied, 117 renter occupied)
| % of renters here: | 23% |
| State: | 44% |
Housing density: 288 houses/condos per square mile
Median price asked for vacant for-sale houses and condos in 2022 in this county: $490,066.
Median contract rent in 2022: $1,386 (lower quartile is $874, upper quartile is $1,433)
Median gross rent in Penn Valley, CA in 2022: $1,714
Housing units in Penn Valley with a mortgage: 150 (0 second mortgage, 0 home equity loan, 0 both second mortgage and home equity loan)
Houses without a mortgage: 0
Median household income for apartments without a mortgage: $107,274
Median monthly housing costs: $1,577
Compare current foreclosures near Penn Valley, CA:
| Photo | Address | Area | Beds / Baths | Price | Details |
|---|---|---|---|---|---|

|
#1
Donovan Rd
Penn Valley, CA 95946
|
1,334 sq. feet
|
2 baths 3 beds |
show details | |

|
#2
Thistle Loop
Penn Valley, CA 95946
|
2,353 sq. feet
|
2 baths 4 beds |
show details | |

|
#3
Elnora Dr
Penn Valley, CA 95946
|
- sq. feet
|
3 baths 2 beds |
show details | |

|
#4
Sunfish Ct
Penn Valley, CA 95946
|
- sq. feet
|
3 baths 4 beds |
show details | |

|
#5
Silver Pine Dr
Penn Valley, CA 95946
|
- sq. feet
|
2 baths 3 beds |
show details | |

|
#6
Sierra Cir
Penn Valley, CA 95946
|
- sq. feet
|
- baths - beds |
show details | |

|
#7
Glenn Loop
Penn Valley, CA 95946
|
- sq. feet
|
- baths - beds |
show details | |

|
#8
Duckabush Ct
Grass Valley, CA 95949
|
3,210 sq. feet
|
2 baths 3 beds |
$739,000
|
show details |

|
#9
Bar Hill Rd
Penn Valley, CA 95946
|
- sq. feet
|
- baths - beds |
show details | |

|
#10
Indian Springs Rd
Penn Valley, CA 95946
|
- sq. feet
|
- baths - beds |
show details |
| Photo | Address | Area | Beds / Baths | Price | Details |
|---|---|---|---|---|---|

|
#11
Burlington Pkwy
Penn Valley, CA 95946
|
- sq. feet
|
- baths - beds |
show details | |

|
#12
Everglade Trl
Browns Valley, CA 95918
|
1,716 sq. feet
|
2 baths 3 beds |
show details | |

|
#13
Connie Dr
Grass Valley, CA 95949
|
2,304 sq. feet
|
2 baths 4 beds |
show details | |

|
#14
Indiana School Road
Oregon House, CA 95962
|
3,752 sq. feet
|
4 baths 4 beds |
show details | |

|
#15
Carrie Dr
Grass Valley, CA 95949
|
2,647 sq. feet
|
3 baths 2 beds |
show details | |

|
#16
Shadow Dr
Auburn, CA 95602
|
2,352 sq. feet
|
2 baths 3 beds |
show details | |

|
#17
Queenan Ln
Dobbins, CA 95935
|
1,698 sq. feet
|
2 baths 2 beds |
show details | |

|
#18
Scotts Flat Rd
Nevada City, CA 95959
|
1,850 sq. feet
|
3 baths 3 beds |
show details | |

|
#19
S Forest Hill St
Colfax, CA 95713
|
1,468 sq. feet
|
1 baths 3 beds |
show details | |

|
#20
Moonshine Rd
Camptonville, CA 95922
|
1,292 sq. feet
|
2 baths 3 beds |
show details |
| Photo | Address | Area | Beds / Baths | Price | Details |
|---|---|---|---|---|---|

|
#21
Turkey Hollow Trl
Browns Valley, CA 95918
|
2,117 sq. feet
|
2 baths 3 beds |
show details | |

|
#22
Volley Ln
Meadow Vista, CA 95722
|
1,826 sq. feet
|
2 baths 3 beds |
show details | |

|
#23
La Cuesta Trl
Rough And Ready, CA 95975
|
1,472 sq. feet
|
2 baths 2 beds |
show details | |

|
#24
Bell Brook Dr
Auburn, CA 95602
|
2,608 sq. feet
|
2 baths 2 beds |
show details | |

|
#25
Florence Ct
Auburn, CA 95602
|
1,992 sq. feet
|
1 baths 2 beds |
show details | |

|
#26
Sierra Dr
Grass Valley, CA 95945
|
- sq. feet
|
2 baths 3 beds |
show details | |

|
#27
Long Bar Ln
Browns Valley, CA 95918
|
1,040 sq. feet
|
1 baths 3 beds |
show details | |

|
#28
Tanglewood Rd
Grass Valley, CA 95945
|
- sq. feet
|
2 baths 3 beds |
show details | |

|
#29
Campbell Dr
Auburn, CA 95602
|
3,458 sq. feet
|
3 baths 5 beds |
show details | |

|
#30
Campbell Dr
Auburn, CA 95602
|
1,914 sq. feet
|
2 baths 2 beds |
show details |
| Photo | Address | Area | Beds / Baths | Price | Details |
|---|---|---|---|---|---|

|
#31
Kimo Way
Auburn, CA 95602
|
4,054 sq. feet
|
4 baths 4 beds |
show details | |

|
#32
Kimo Way
Auburn, CA 95602
|
4,054 sq. feet
|
4 baths 4 beds |
show details | |

|
#33
Grand View Ave
Colfax, CA 95713
|
1,100 sq. feet
|
2 baths 3 beds |
show details | |

|
#34
Barde Ct
Grass Valley, CA 95949
|
- sq. feet
|
2 baths 3 beds |
show details | |

|
#35
Fruitland Rd
Marysville, CA 95901
|
1,504 sq. feet
|
2 baths 2 beds |
show details | |

|
#36
Sunnyside Dr
Colfax, CA 95713
|
2,326 sq. feet
|
3 baths 4 beds |
show details | |

|
#37
Los Verjeles Rd
Marysville, CA 95901
|
1,456 sq. feet
|
2 baths 2 beds |
show details | |

|
#38
Meadow View Ln
Auburn, CA 95602
|
1,484 sq. feet
|
2 baths 3 beds |
show details | |

|
#39
Tree Farm Rd
Colfax, CA 95713
|
1,512 sq. feet
|
2 baths 3 beds |
show details | |

|
#40
Hannah Ln
Colfax, CA 95713
|
1,340 sq. feet
|
2 baths 3 beds |
show details |
| Photo | Address | Area | Beds / Baths | Price | Details |
|---|---|---|---|---|---|

|
#41
Torrey Pines Dr
Auburn, CA 95602
|
- sq. feet
|
2 baths 3 beds |
show details | |

|
#42
Manion Canyon Rd
Grass Valley, CA 95945
|
- sq. feet
|
2 baths 3 beds |
show details | |

|
#43
Torrey Pines Dr
Auburn, CA 95602
|
- sq. feet
|
2 baths 3 beds |
show details | |

|
#44
Sontag Rd
Grass Valley, CA 95945
|
- sq. feet
|
2 baths 3 beds |
show details | |

|
#45
Rock Creek Rd
Nevada City, CA 95959
|
- sq. feet
|
2 baths 3 beds |
show details | |

|
#46
N Bloomfield Rd
Nevada City, CA 95959
|
- sq. feet
|
1 baths 2 beds |
show details | |

|
#47
Sadie D Dr
Nevada City, CA 95959
|
- sq. feet
|
2 baths 3 beds |
show details | |

|
#48
Gunstock Rd
Grass Valley, CA 95949
|
- sq. feet
|
3 baths 3 beds |
show details | |

|
#49
Buck Ridge Rd
Grass Valley, CA 95949
|
- sq. feet
|
2 baths 2 beds |
show details | |

|
Check over 1 million property listings on Foreclosure.com!
|
browse all offers | |||


 | Thoughts on Green Grass, CA? (4 replies) |
| Grass Valley vs. Nevada City (18 replies) |
| Nevada City-Grass Valley (27 replies) |
| Susanvill, CA. Milford, CA. Pros and cons of purchasing a home in this area? (7 replies) |
| Nicer folks in Auburn or Grass Valley? (10 replies) |
| Retirement areas near Sacramento or San Jose. (11 replies) |

Median year apartment built: 2005
Household type by relationship:
Households: 1,187- Male householders: 337 (78 living alone), Female householders: 139 (0 living alone)
318 spouses (318 opposite-sex spouses), 11 unmarried partners, (11 opposite-sex unmarried partners), 267 children (267 natural, 0 adopted, 0 stepchildren), 35 grandchildren, 0 brothers or sisters, 0 parents, 0 foster children, 30 other relatives, 24 non-relatives
- In group quarters: 18
Size of family households: 321 2-persons, 27 3-persons, 56 4-persons, 26 5-persons.
Size of nonfamily households: 74 1-person.
72 married couples with children.
49 single-parent households (25 men, 24 women).
96.1% of residents of Penn Valley speak English at home.
4.6% of residents speak Spanish at home (100% speak English very well).
| Here: | 5.6 |
| State: | 6.0 |
| Here: | 5.5 |
| State: | 3.9 |

- Bedrooms in owner-occupied houses and condos in Penn Valley, California
- 0no bedroom
- 01 bedroom
- 1532 bedrooms
- 2163 bedrooms
- 214 bedrooms
- 05+ bedrooms

- Bedrooms in renter-occupied apartments in Penn Valley, California
- 0no bedroom
- 01 bedroom
- 562 bedrooms
- 623 bedrooms
- 04 bedrooms
- 05+ bedrooms

- Cars and other vehicles available in Penn Valley in owner-occupied houses/condos
- 0no vehicle
- 661 vehicle
- 1302 vehicles
- 1533 vehicles
- 224 vehicles
- 195+ vehicles

- Cars and other vehicles available in Penn Valley in renter-occupied apartments
- 0no vehicle
- 641 vehicle
- 362 vehicles
- 183 vehicles
- 04 vehicles
- 05+ vehicles

- Rooms in owner-occupied houses in Penn Valley, California
- 01 room
- 02 rooms
- 03 rooms
- 384 rooms
- 1635 rooms
- 1016 rooms
- 407 rooms
- 08 rooms
- 489+ rooms

- Rooms in renter-occupied apartments in Penn Valley, California
- 01 room
- 02 rooms
- 03 rooms
- 384 rooms
- 185 rooms
- 516 rooms
- 07 rooms
- 118 rooms
- 09+ rooms


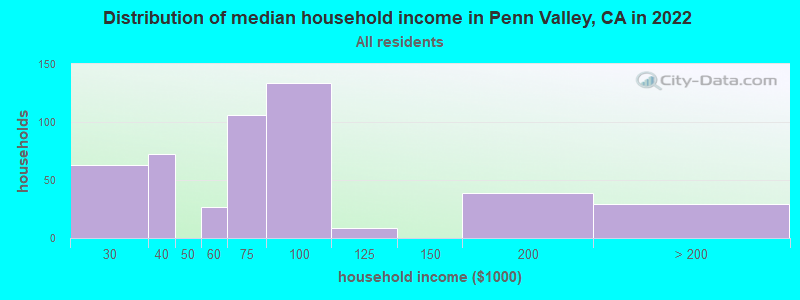
Penn Valley, CA household income distribution

- 63$20,000 to $29,999
- 72$30,000 to $39,999
- 27$50,000 to $59,999
- 106$60,000 to $74,999
- 134$75,000 to $99,999
- 9$100,000 to $124,999
- 39$150,000 to $199,999
- 29$200,000 or more
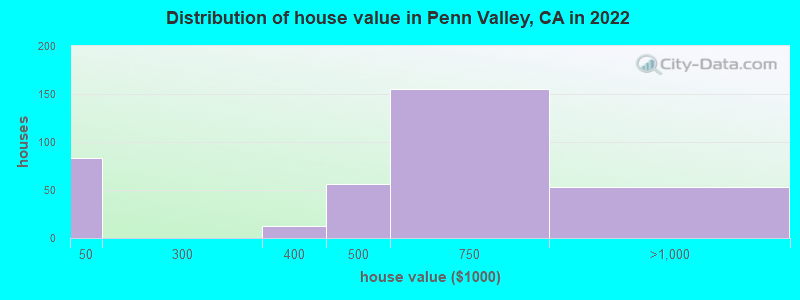
Home value of owner - occupied houses in 2022 in Penn Valley, CA
-
- 83$10,000 to $14,999
- 12$300,000 to $399,999
- 55$400,000 to $499,999
- 155$500,000 to $749,999
- 53$750,000 to $999,999
Rent paid by renters in 2022 in Penn Valley, CA
-
- 25$800 to $899
- 55$1,250 to $1,499
- 10$1,500 to $1,999
- 18No cash rent


Percentage of workers working in this county: 79.2%
Number of people working at home: 0 (0.0% of all workers)
Travel time to work (commute)
- Less than 5 minutes: 0
- 5 to 9 minutes: 0
- 10 to 14 minutes: 0
- 15 to 19 minutes: 100
- 20 to 24 minutes: 135
- 25 to 29 minutes: 0
- 30 to 34 minutes: 34
- 35 to 39 minutes: 0
- 40 to 44 minutes: 0
- 45 to 59 minutes: 9
- 60 to 89 minutes: 24
- 90 or more minutes: 186
Means of transportation to work:
- Drove a car alone: 430 (73.3%)
- Carpooled: 79 (13.5%)
- Motorcycle: 9 (1.5%)
- Walked: 22 (3.7%)
- Worked at home: 47 (8.0%)


- Year of entry for the foreign-born population in Penn Valley, California
- 01995 to March 2000
- 01990 to 1994
- 01985 to 1989
- 01980 to 1984
- 01975 to 1979
- 01970 to 1974
- 01965 to 1969
- 47Before 1965

First ancestries reported:
- Norwegian: 125 (25.0%)
- English: 47 (9.4%)
- German: 28 (5.6%)
- American: 20 (4.0%)
- Italian: 12 (2.4%)
- Irish: 4 (0.8%)
Most common places of birth for foreign-born residents (%):
| Penn Valley: | 27.7% (13) |
| California: | 1.6% (141,181) |
| Penn Valley: | 25.5% (12) |
| California: | 0.5% (44,953) |
| Penn Valley: | 17.0% (8) |
| California: | 0.5% (46,744) |
| Penn Valley: | 14.9% (7) |
| California: | 1.1% (98,160) |
| Penn Valley: | 14.9% (7) |
| California: | 7.5% (664,935) |
Place of birth for U.S.-born residents:
- This state: 1,044
- Other state: 134
- Northeast: 3
- Midwest: 42
- South: 15
- West: 72
88.9% of Penn Valley residents lived in the same house 1 years ago.
Out of people who lived in different houses, 40.7% lived in this county.
| Penn Valley: | 88.9% |
| State average: | 88.9% |
Education attainment for males 25 years and older:
- No schooling: 5
- Nursery to 4th grade: 0
- 5th and 6th grade: 0
- 7th and 8th grade: 0
- 9th grade: 0
- 10th grade: 0
- 11th grade: 0
- 12th grade, no diploma: 2
- High school graduate (or equivalency): 124
- Less than 1 year of college: 70
- Some college more than 1 year, no degree: 110
- Associate degree: 171
- Bachelor's degree: 29
- Master's degree: 0
- Professional school degree: 0
- Doctorate degree: 0

Education attainment for females 25 years and older:
- No schooling: 22
- Nursery to 4th grade: 0
- 5th and 6th grade: 0
- 7th and 8th grade: 0
- 9th grade: 0
- 10th grade: 0
- 11th grade: 0
- 12th grade, no diploma: 4
- High school graduate (or equivalency): 121
- Less than 1 year of college: 31
- Some college more than 1 year, no degree: 83
- Associate degree: 98
- Bachelor's degree: 126
- Master's degree: 0
- Professional school degree: 0
- Doctorate degree: 0


Housing units in structures:
- One, detached: 383
- One, attached: 12
- 3 or 4: 24
- Mobile homes: 186
House/condo owner moved in on average 12 years ago
Renter moved in on average 8 years ago

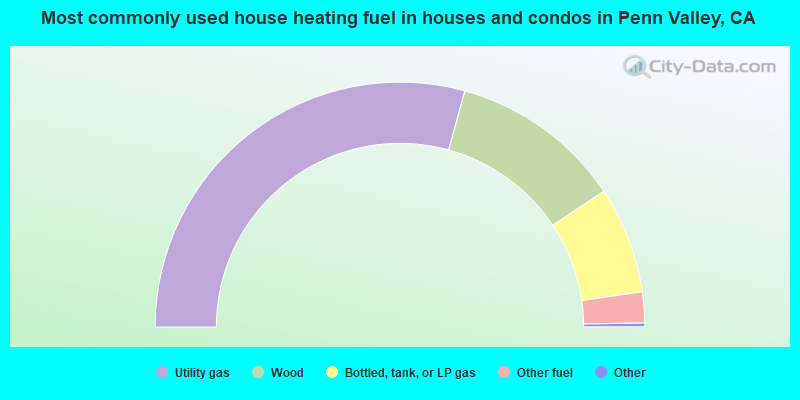
- 58.9%Utility gas
- 22.9%Wood
- 14.2%Bottled, tank, or LP gas
- 4.1%Other fuel

- 63.1%Utility gas
- 21.6%Electricity
- 15.3%Wood
Private vs. public school enrollment:
| Here: | 0.0% |
| California: | 10.5% |
| Here: | 0.0% |
| California: | 8.5% |


