Peoria Heights, IL (Illinois) Houses and Residents
| Peoria Heights: | $109,081 |
| Illinois: | $251,600 |
Total population: 6,020 (All urban)
Houses: 3,177 (2,793 occupied: 1,794 owner occupied, 1,080 renter occupied)
| % of renters here: | 38% |
| State: | 33% |
Housing density: 1,201 houses/condos per square mile
Median price asked for vacant for-sale houses and condos in 2022: $76,571.
Median contract rent in 2022: $697 (lower quartile is $595, upper quartile is $881)
Median rent asked for vacant for-rent units in 2022: $1,280
Median gross rent in Peoria Heights, IL in 2022: $883
Housing units in Peoria Heights with a mortgage: 975 (107 second mortgage, 0 home equity loan, 62 both second mortgage and home equity loan)
Houses without a mortgage: 35
Median household income for houses/condos with a mortgage: $73,044
Median household income for apartments without a mortgage: $66,282
Median monthly housing costs: $884
Compare current foreclosures near Peoria Heights, IL:
| Photo | Address | Area | Beds / Baths | Price | Details |
|---|---|---|---|---|---|

|
#1
N Galena Rd
Peoria Heights, IL 61616
|
2,494 sq. feet
|
3 baths 3 beds |
show details | |

|
#2
E Duryea Ave
Peoria Heights, IL 61616
|
1,216 sq. feet
|
1 baths 2 beds |
show details | |

|
#3
N Glenaire Ct
Peoria Heights, IL 61616
|
868 sq. feet
|
1 baths 2 beds |
show details | |

|
#4
E Glen Ave
Peoria Heights, IL 61616
|
968 sq. feet
|
1 baths 2 beds |
show details | |

|
#5
E Highland Pl
Peoria Heights, IL 61616
|
2,038 sq. feet
|
2 baths 3 beds |
show details | |

|
#6
E Wilson Ave
Peoria Heights, IL 61616
|
760 sq. feet
|
1 baths 1 beds |
show details | |

|
#7
E Lake Ave
Peoria Heights, IL 61616
|
1,382 sq. feet
|
2 baths 3 beds |
show details | |

|
#8
E Robin Ct
Peoria Heights, IL 61616
|
- sq. feet
|
- baths - beds |
show details | |

|
#9
N Atlantic Ave
Peoria Heights, IL 61616
|
- sq. feet
|
- baths - beds |
show details | |

|
#10
E Gardner Ln Apt 602
Peoria Heights, IL 61616
|
- sq. feet
|
- baths - beds |
show details |
| Photo | Address | Area | Beds / Baths | Price | Details |
|---|---|---|---|---|---|

|
#11
E Gardner Ln Apt 620
Peoria Heights, IL 61616
|
- sq. feet
|
- baths - beds |
show details | |

|
#12
E Gardner Ln Apt 417
Peoria Heights, IL 61616
|
- sq. feet
|
- baths - beds |
show details | |

|
#13
N Terrace Three Ct, No 3
Peoria Heights, IL 61616
|
- sq. feet
|
- baths - beds |
show details | |

|
#14
E Toledo Ave
Peoria Heights, IL 61616
|
- sq. feet
|
- baths - beds |
show details | |

|
#15
E Robin Ct
Peoria Heights, IL 61616
|
- sq. feet
|
- baths - beds |
show details | |

|
#16
N Boulevard Ave
Peoria Heights, IL 61616
|
- sq. feet
|
- baths - beds |
show details | |

|
#17
N Illinois Ave Heights
Peoria Heights, IL 61616
|
- sq. feet
|
- baths - beds |
show details | |

|
#18
N Molleck Dr # 5
Peoria, IL 61604
|
952 sq. feet
|
2 baths 2 beds |
$129,000
|
show details |

|
#19
W Brookside Dr
Peoria, IL 61615
|
2,391 sq. feet
|
2 baths 3 beds |
$241,000
|
show details |

|
#20
Herman St
Pekin, IL 61554
|
915 sq. feet
|
1 baths 2 beds |
$135,000
|
show details |
| Photo | Address | Area | Beds / Baths | Price | Details |
|---|---|---|---|---|---|

|
#21
2nd St
Pekin, IL 61554
|
1,058 sq. feet
|
1 baths 3 beds |
$127,000
|
show details |

|
#22
State St
Pekin, IL 61554
|
1,652 sq. feet
|
1 baths 6 beds |
$29,900
|
show details |

|
#23
N Highland St
Creve Coeur, IL 61610
|
750 sq. feet
|
1 baths 1 beds |
$24,900
|
show details |

|
#24
Hickory Point Rd
Metamora, IL 61548
|
- sq. feet
|
1 baths 2 beds |
$114,900
|
show details |

|
#25
Court Dr
Washington, IL 61571
|
1,760 sq. feet
|
1 baths 3 beds |
show details | |

|
#26
S Hanna City Glasford Rd
Hanna City, IL 61536
|
1,162 sq. feet
|
1 baths 2 beds |
show details | |

|
#27
Kaskaskia Rd
Pekin, IL 61554
|
2,292 sq. feet
|
2 baths 3 beds |
show details | |

|
#28
W Garden St
Peoria, IL 61605
|
950 sq. feet
|
1 baths 5 beds |
show details | |

|
#29
N Hamilton Rd
Peoria, IL 61614
|
- sq. feet
|
2 baths 4 beds |
show details | |

|
#30
N Bourland Ave
Peoria, IL 61604
|
792 sq. feet
|
1 baths 2 beds |
show details |
| Photo | Address | Area | Beds / Baths | Price | Details |
|---|---|---|---|---|---|

|
#31
W Albany Ave
Peoria, IL 61604
|
1,014 sq. feet
|
1 baths 3 beds |
show details | |

|
#32
N Saint Michael Ave
Peoria, IL 61615
|
1,653 sq. feet
|
2 baths 4 beds |
show details | |

|
#33
Peoria St
Washington, IL 61571
|
1,518 sq. feet
|
1 baths 3 beds |
show details | |

|
#34
W Thrush Ave
Peoria, IL 61604
|
1,142 sq. feet
|
2 baths 3 beds |
show details | |

|
#35
Meadow Ave
East Peoria, IL 61611
|
- sq. feet
|
1 baths 2 beds |
show details | |

|
#36
Ave
Peoria, IL 61603
|
756 sq. feet
|
1 baths 3 beds |
show details | |

|
#37
Jim Ct
East Peoria, IL 61611
|
1,788 sq. feet
|
1 baths 3 beds |
show details | |

|
#38
S 7th St
Pekin, IL 61554
|
2,040 sq. feet
|
3 baths 3 beds |
show details | |

|
#39
W Heading Ave
Peoria, IL 61604
|
1,040 sq. feet
|
2 baths 3 beds |
show details | |

|
#40
Illinois St
Pekin, IL 61554
|
1,008 sq. feet
|
1 baths 2 beds |
show details |
| Photo | Address | Area | Beds / Baths | Price | Details |
|---|---|---|---|---|---|

|
#41
Bloomington Rd
East Peoria, IL 61611
|
980 sq. feet
|
1 baths 3 beds |
show details | |

|
#42
E Madison St
Morton, IL 61550
|
1,638 sq. feet
|
1 baths 3 beds |
show details | |

|
#43
W Southport Rd
Peoria, IL 61615
|
1,006 sq. feet
|
1 baths 2 beds |
show details | |

|
#44
S Cedar St
Washington, IL 61571
|
1,264 sq. feet
|
1 baths 3 beds |
show details | |

|
#45
N 18th St
Pekin, IL 61554
|
1,548 sq. feet
|
1 baths 3 beds |
show details | |

|
#46
Cypress St
Pekin, IL 61554
|
1,008 sq. feet
|
1 baths 3 beds |
show details | |

|
#47
N Mccabe Dr
Chillicothe, IL 61523
|
1,104 sq. feet
|
1 baths 3 beds |
show details | |

|
#48
N 3rd St
Chillicothe, IL 61523
|
- sq. feet
|
- baths - beds |
$34,500
|
show details |

|
#49
S Granville Ave
Peoria, IL 61607
|
2,412 sq. feet
|
2 baths 4 beds |
show details | |

|
Check over 1 million property listings on Foreclosure.com!
|
browse all offers | |||


 | Safe apartments and places to live in Peoria, IL (19 replies) |
| Gay realtors in Peoria (27 replies) |
| Peoria, Illinois apartments (6 replies) |
| Peoria Rental Suggestions (5 replies) |
| Moving to Peoria for Caterpillar, where to rent? (15 replies) |
| Peoria/Chicago—where to live in between? (21 replies) |

Median year apartment built: 1969
Household type by relationship:
Households: 5,798- Male householders: 1,278 (710 living alone), Female householders: 1,471 (544 living alone)
915 spouses (915 opposite-sex spouses), 295 unmarried partners, (282 opposite-sex unmarried partners), 1,485 children (1,248 natural, 125 adopted, 112 stepchildren), 8 grandchildren, 0 brothers or sisters, 59 parents, 0 foster children, 17 other relatives, 142 non-relatives
- In group quarters: 123
Size of family households: 719 2-persons, 204 3-persons, 82 4-persons, 153 5-persons, 83 6-persons, 41 7-or-more-persons.
Size of nonfamily households: 1,294 1-person, 267 2-persons, 38 3-persons.
828 married couples with children.
396 single-parent households (0 men, 396 women).
94.5% of residents of Peoria Heights speak English at home.
1.7% of residents speak Spanish at home (34% speak English very well, 60% speak English well, 5% speak English not well).
0.3% of residents speak other Indo-European language at home (100% speak English very well).
2.9% of residents speak Asian or Pacific Island language at home (94% speak English very well, 6% speak English well).
0.3% of residents speak other language at home (100% speak English very well).
Foreign born population: 187 (3.2%)
(65.2% of them are naturalized citizens)
| Here: | 6.0 |
| State: | 6.4 |
| Here: | 4.1 |
| State: | 4.1 |
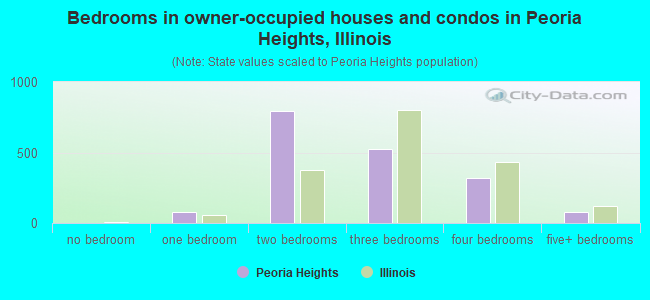
- Bedrooms in owner-occupied houses and condos in Peoria Heights, Illinois
- 0no bedroom
- 781 bedroom
- 7932 bedrooms
- 5273 bedrooms
- 3204 bedrooms
- 765+ bedrooms
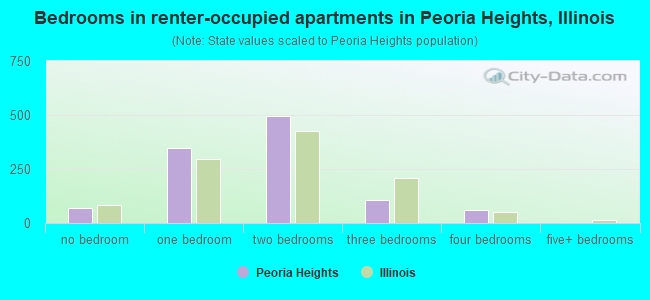
- Bedrooms in renter-occupied apartments in Peoria Heights, Illinois
- 70no bedroom
- 3471 bedroom
- 4952 bedrooms
- 1083 bedrooms
- 614 bedrooms
- 05+ bedrooms
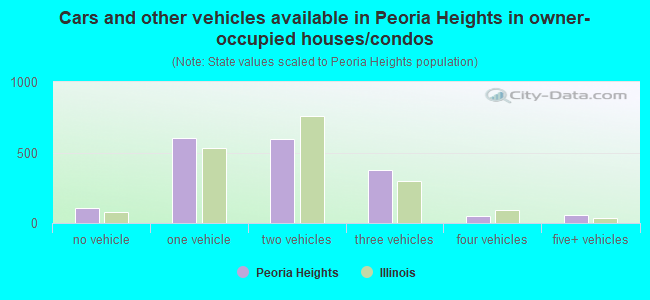
- Cars and other vehicles available in Peoria Heights in owner-occupied houses/condos
- 109no vehicle
- 6031 vehicle
- 5972 vehicles
- 3753 vehicles
- 524 vehicles
- 595+ vehicles
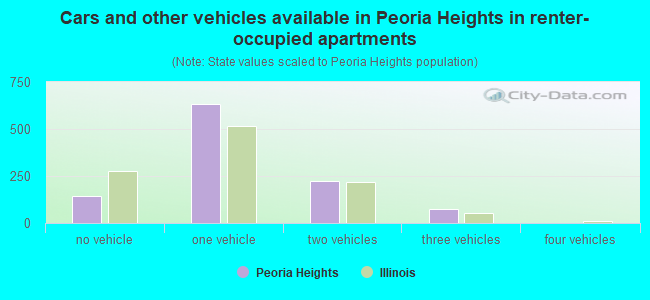
- Cars and other vehicles available in Peoria Heights in renter-occupied apartments
- 145no vehicle
- 6351 vehicle
- 2262 vehicles
- 743 vehicles
- 04 vehicles
- 05+ vehicles
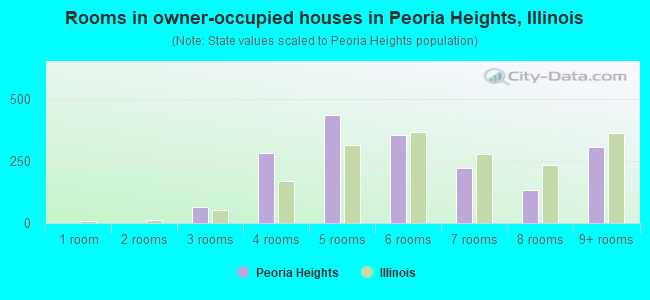
- Rooms in owner-occupied houses in Peoria Heights, Illinois
- 01 room
- 02 rooms
- 643 rooms
- 2804 rooms
- 4355 rooms
- 3566 rooms
- 2207 rooms
- 1348 rooms
- 3069+ rooms
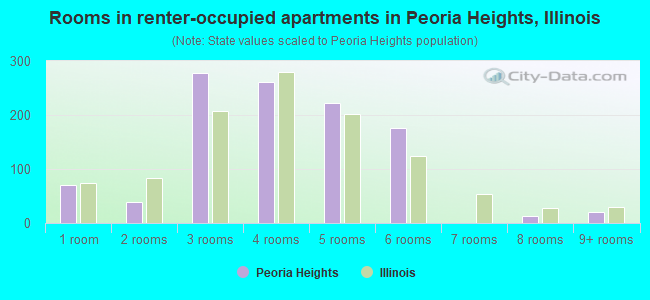
- Rooms in renter-occupied apartments in Peoria Heights, Illinois
- 701 room
- 392 rooms
- 2783 rooms
- 2614 rooms
- 2225 rooms
- 1766 rooms
- 07 rooms
- 138 rooms
- 219+ rooms
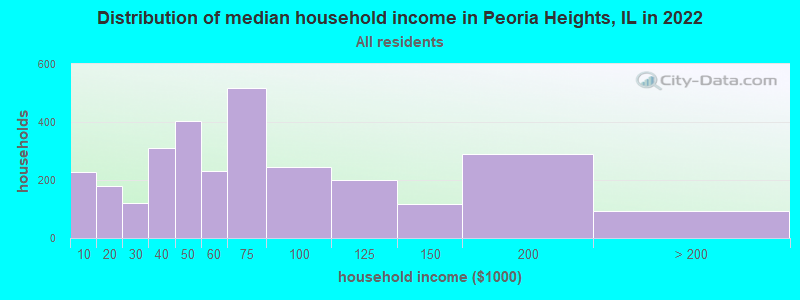
Peoria Heights, IL household income distribution

- 226Less than $10,000
- 181$10,000 to $19,999
- 121$20,000 to $29,999
- 310$30,000 to $39,999
- 402$40,000 to $49,999
- 230$50,000 to $59,999
- 516$60,000 to $74,999
- 246$75,000 to $99,999
- 201$100,000 to $124,999
- 116$125,000 to $149,999
- 291$150,000 to $199,999
- 92$200,000 or more
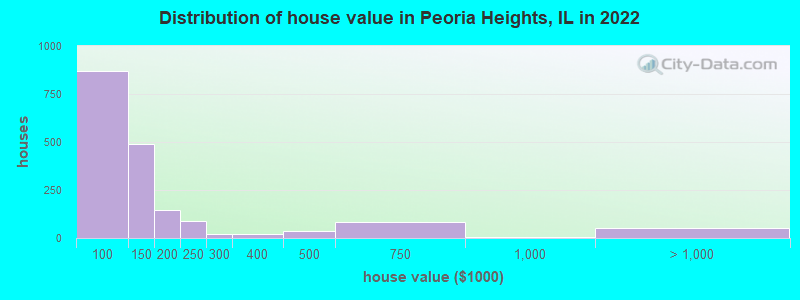
Home value of owner - occupied houses in 2022 in Peoria Heights, IL
-
- 6Less than $10,000
- 119$50,000 to $59,999
- 97$60,000 to $69,999
- 234$70,000 to $79,999
- 280$80,000 to $89,999
- 138$90,000 to $99,999
- 260$100,000 to $124,999
- 227$125,000 to $149,999
- 94$150,000 to $174,999
- 50$175,000 to $199,999
- 87$200,000 to $249,999
- 23$250,000 to $299,999
- 18$300,000 to $399,999
- 35$400,000 to $499,999
- 80$500,000 to $749,999
- 6$750,000 to $999,999
- 51$1,000,000 to $1,499,999
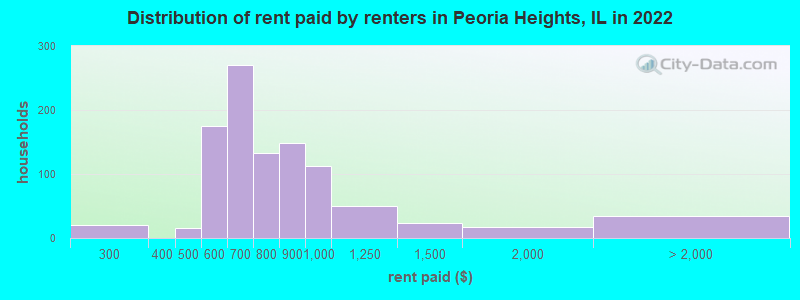
Rent paid by renters in 2022 in Peoria Heights, IL
-
- 13$200 to $249
- 7$250 to $299
- 15$450 to $499
- 74$500 to $549
- 100$550 to $599
- 125$600 to $649
- 145$650 to $699
- 76$700 to $749
- 56$750 to $799
- 149$800 to $899
- 111$900 to $999
- 49$1,000 to $1,249
- 23$1,250 to $1,499
- 17$1,500 to $1,999
- 8$2,000 to $2,499
- 26No cash rent
Percentage of workers working in this county: 71.6%
Number of people working at home: 295 (9.7% of all workers)
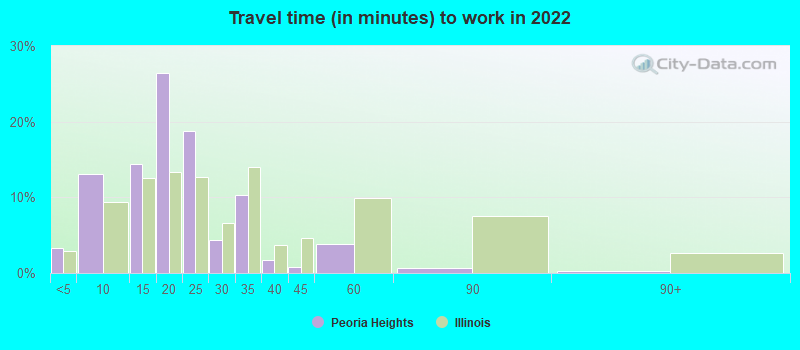
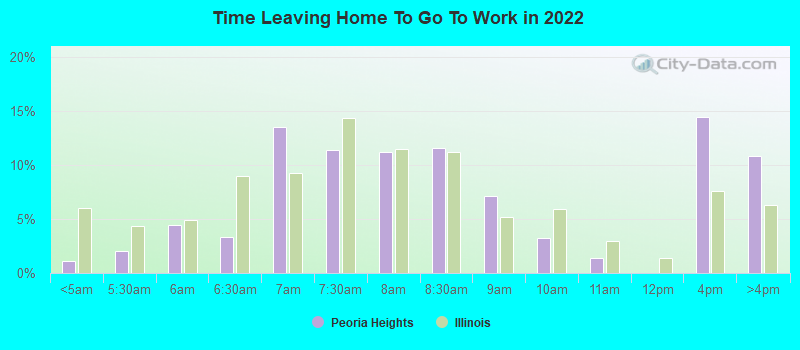
Travel time to work (commute)
- Less than 5 minutes: 115
- 5 to 9 minutes: 335
- 10 to 14 minutes: 675
- 15 to 19 minutes: 714
- 20 to 24 minutes: 425
- 25 to 29 minutes: 126
- 30 to 34 minutes: 78
- 35 to 39 minutes: 92
- 40 to 44 minutes: 17
- 45 to 59 minutes: 70
- 60 to 89 minutes: 10
- 90 or more minutes: 62
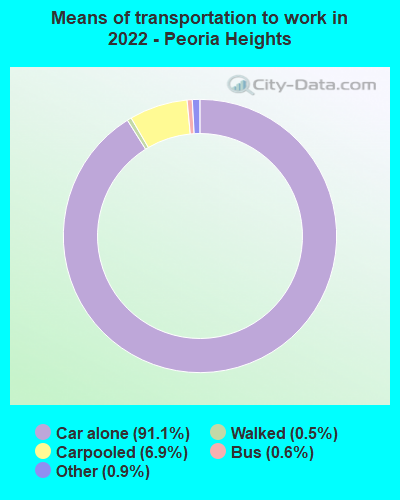
Means of transportation to work:
- Drove a car alone: 1,890 (78.3%)
- Carpooled: 165 (6.8%)
- Bus: 14 (0.6%)
- Taxi: 39 (1.6%)
- Walked: 9 (0.4%)
- Worked at home: 320 (13.3%)
- Unemployment by race in 2022
- Unemployment rate for White non-Hispanic residents
- 5.8%Males
- 2.9%Females
- Unemployment rate for two or more race residents
- 21.3%Females
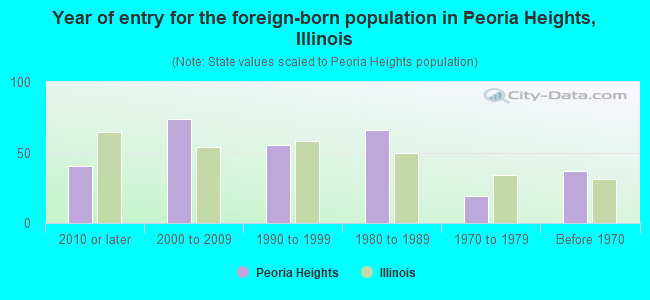
- Year of entry for the foreign-born population in Peoria Heights, Illinois
- 412010 or later
- 742000 to 2009
- 551990 to 1999
- 661980 to 1989
- 191970 to 1979
- 37Before 1970
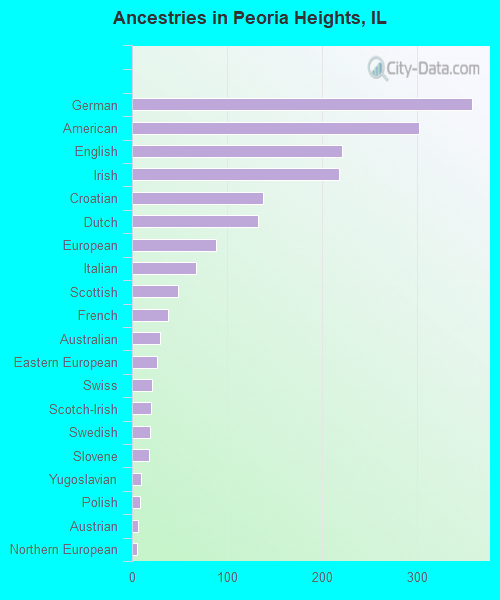
First ancestries reported:
- German: 358 (17.0%)
- American: 302 (14.3%)
- English: 221 (10.5%)
- Irish: 218 (10.3%)
- Croatian: 138 (6.5%)
- Dutch: 133 (6.3%)
- European: 88 (4.2%)
- Italian: 67 (3.2%)
- Scottish: 48 (2.3%)
- French: 38 (1.8%)
- Australian: 30 (1.4%)
- Eastern European: 26 (1.2%)
- Swiss: 21 (1.0%)
- Scotch-Irish: 20 (0.9%)
- Swedish: 19 (0.9%)
- Slovene: 18 (0.9%)
- Yugoslavian: 10 (0.5%)
- Polish: 8 (0.4%)
- Austrian: 6 (0.3%)
- Northern European: 5 (0.2%)
Most common places of birth for foreign-born residents (%):
| Peoria Heights: | 22.5% (51) |
| Illinois: | 34.7% (626,958) |
| Peoria Heights: | 18.9% (43) |
| Illinois: | 1.1% (19,306) |
| Peoria Heights: | 11.5% (26) |
| Illinois: | 2.2% (40,393) |
| Peoria Heights: | 10.1% (23) |
| Illinois: | 0.5% (9,834) |
| Peoria Heights: | 10.1% (23) |
| Illinois: | 0.1% (980) |
| Peoria Heights: | 9.7% (22) |
| Illinois: | 5.2% (93,003) |
| Peoria Heights: | 5.7% (13) |
| Illinois: | 0.1% (2,458) |
| Peoria Heights: | 2.6% (6) |
| Illinois: | 0.3% (5,895) |
| Peoria Heights: | 2.2% (5) |
| Illinois: | 1.3% (22,793) |
Place of birth for U.S.-born residents:
- This state: 4,527
- Other state: 1,025
- Northeast: 86
- Midwest: 346
- South: 368
- West: 227
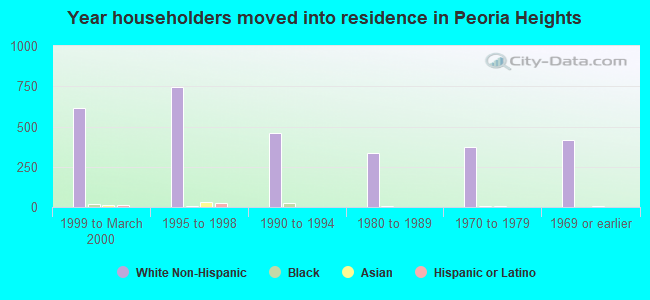
86.6% of Peoria Heights residents lived in the same house 1 years ago.
Out of people who lived in different houses, 28.6% lived in this county.
Out of people who lived in different counties, 70.0% lived in Illinois.
| Peoria Heights: | 86.6% |
| State average: | 88.3% |
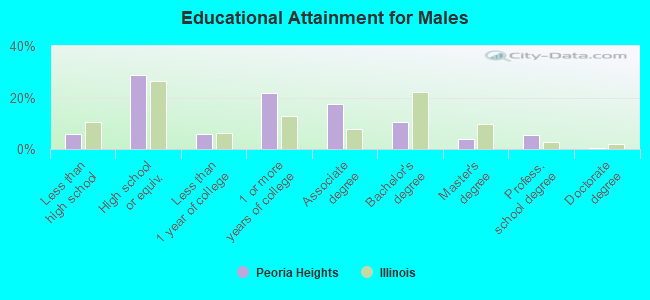
Education attainment for males 25 years and older:
- No schooling: 17
- Nursery to 4th grade: 0
- 5th and 6th grade: 0
- 7th and 8th grade: 0
- 9th grade: 25
- 10th grade: 2
- 11th grade: 6
- 12th grade, no diploma: 74
- High school graduate (or equivalency): 611
- Less than 1 year of college: 126
- Some college more than 1 year, no degree: 462
- Associate degree: 370
- Bachelor's degree: 228
- Master's degree: 87
- Professional school degree: 118
- Doctorate degree: 12
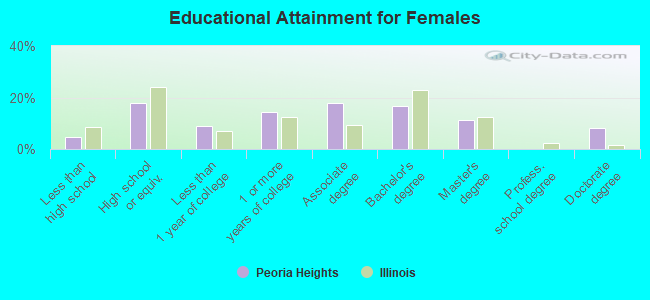
Education attainment for females 25 years and older:
- No schooling: 24
- Nursery to 4th grade: 0
- 5th and 6th grade: 10
- 7th and 8th grade: 0
- 9th grade: 34
- 10th grade: 0
- 11th grade: 22
- 12th grade, no diploma: 6
- High school graduate (or equivalency): 381
- Less than 1 year of college: 189
- Some college more than 1 year, no degree: 303
- Associate degree: 379
- Bachelor's degree: 356
- Master's degree: 235
- Professional school degree: 3
- Doctorate degree: 171


Housing units in structures:
- One, detached: 2,450
- One, attached: 73
- Two: 85
- 3 or 4: 6
- 5 to 9: 73
- 10 to 19: 178
- 20 to 49: 232
- 50 or more: 74
Housing units lacking complete kitchen facilities in 2022: 4.6%
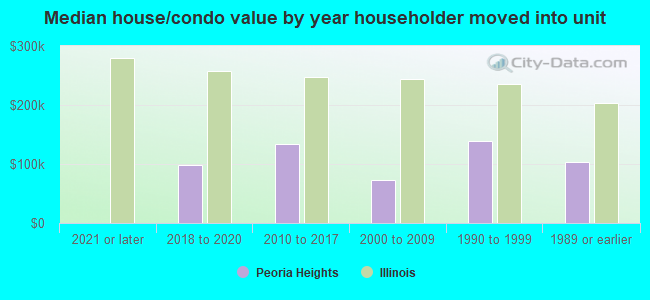
House/condo owner moved in on average 14 years ago
Renter moved in on average 2 years ago
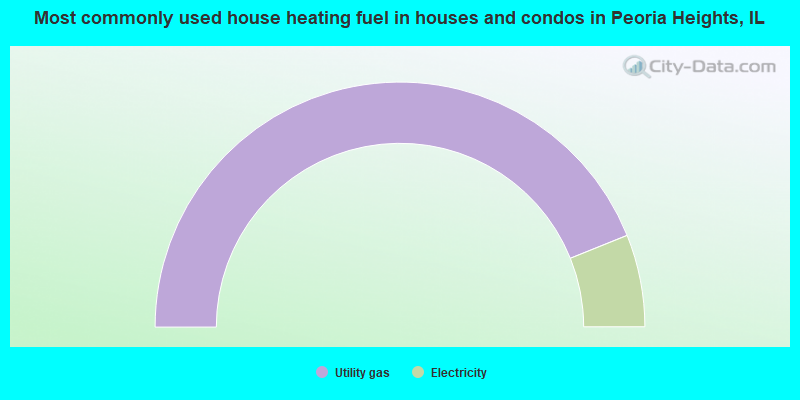
- 87.8%Utility gas
- 12.2%Electricity
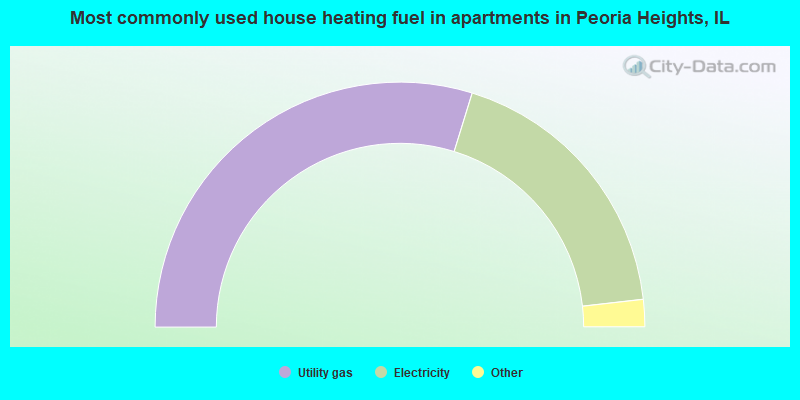
- 59.6%Utility gas
- 36.9%Electricity
- 2.7%Wood
- 0.9%Bottled, tank, or LP gas
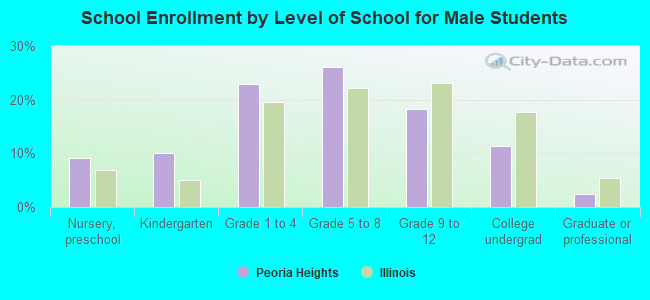
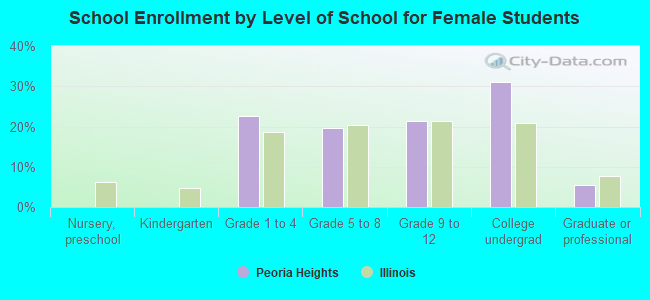
Private vs. public school enrollment:
| Here: | 22.2% |
| Illinois: | 13.3% |
| Here: | 17.6% |
| Illinois: | 9.9% |
| Here: | 21.2% |
| Illinois: | 27.4% |