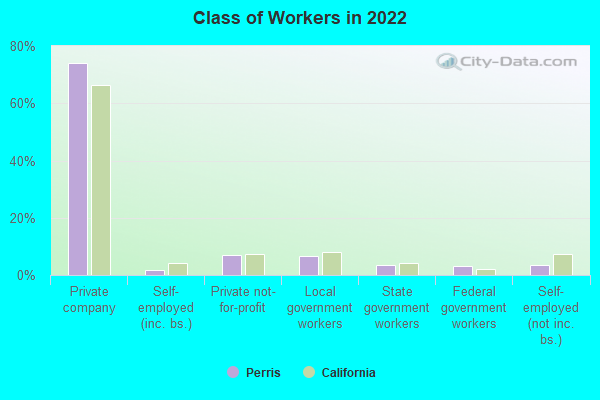
Perris, CA (California) Houses and Residents
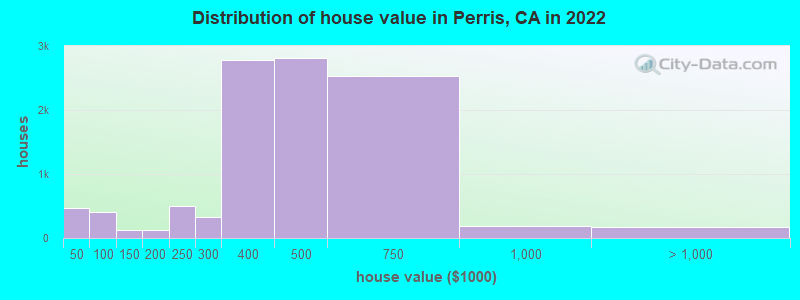
Estimated median house or condo value in 2022: $476,400 (it was $87,100 in 2000 )
Perris:
$476,400California:
$715,900
Lower value quartile - upper value quartile: $403,300 - $612,500Mean price in 2022: Detached houses: $407,482 Here:
$407,482State:
$988,808
Townhouses or other attached units: $288,140 Here:
$288,140State:
$838,546
Mobile homes: $204,845 Here:
$204,845State:
$184,506
Total population: 73,756 (Urban population: 35,258, Rural population: 945 (all nonfarm) )
Houses: 20,367 (19,243 occupied: 13,129 owner occupied, 6,114 renter occupied )
% of renters here:
32%State:
44%
Housing density: 649 houses/condos per square mile
Median price asked for vacant for-sale houses and condos in 2022: $1,439,538.
Median contract rent in 2022: $1,460 (lower quartile is $1,015, upper quartile is $1,876)
Median rent asked for vacant for-rent units in 2022: $1,531
Median gross rent in Perris, CA in 2022: $1,760
Housing units in Perris with a mortgage: 9,323 (455 second mortgage, 0 home equity loan, 369 both second mortgage and home equity loan )Houses without a mortgage: 127
Median household income for houses/condos with a mortgage: $96,883
Median household income for apartments without a mortgage: $90,371
Median monthly housing costs: $1,751
Data:
Median house or condo value ($)
Median house or condo value ($ change since 2000)
Median house or condo value ($) - White
Median house or condo value ($) - Black or African American
Median house or condo value ($) - Asian
Median house or condo value ($) - Hispanic or Latino
Median house or condo value ($) - American Indian and Alaska Native
Median house or condo value ($) - Multirace
Median house or condo value ($) - Other Race
Median price asked for mobile homes ($)
Household density (households per square mile)
Mean house or condo value by units in structure - 1, detached ($)
Mean house or condo value by units in structure - 1, attached ($)
Mean house or condo value by units in structure - 2 ($)
Mean house or condo value by units in structure by units in structure - 3 or 4 ($)
Mean house or condo value by units in structure - 5 or more ($)
Mean house or condo value by units in structure - Boat, RV, van, etc. ($)
Mean house or condo value by units in structure - Mobile home ($)
Median contract rent ($)
Median contract rent - Lower quartile ($)
Median contract rent - Upper quartile ($)
Median gross rent ($)
Urban houses (%)
Rural houses (%)
Houses occupied (%)
Houses occupied (% change since 2000)
Houses owner occupied (%)
Houses owner occupied (% change since 2000)
Houses renter occupied (%)
Houses renter occupied (% change since 2000)
Vacant housing units - For rent (%)
Vacant housing units - For rent (% change since 2000)
Vacant housing units - For sale only (%)
Vacant housing units - For sale only (% change since 2000)
Vacant housing units - Rented or sold, not occupied (%)
Vacant housing units - Rented or sold, not occupied (% change since 2000)
Vacant housing units - For seasonal, recreational, or occasional use (%)
Vacant housing units - For seasonal, recreational, or occasional use (% change since 2000)
Vacant housing units - For migrant workers (%)
Vacant housing units - For migrant workers (% change since 2000)
Vacant housing units - Other vacant (%)
Vacant housing units - Other vacant (% change since 2000)
Median monthly housing costs ($)
Median household income for houses/condos with a mortgage ($)
Median household income for houses/condos without a mortgage ($)
Median household income ($)
Median household income ($) - White
Median household income ($) - Black or African American
Median household income ($) - Asian
Median household income ($) - Hispanic or Latino
Median household income ($) - American Indian and Alaska Native
Median household income ($) - Multirace
Median household income ($) - Other Race
Mortgage status - with mortgage (%)
Mortgage status - with second mortgage (%)
Mortgage status - with home equity loan (%)
Mortgage status - with both second mortgage and home equity loan (%)
Mortgage status - without a mortgage (%)
Median year house/condo built
Median year apartment built
Household type by relationship - Male householder living alone (%)
Household type by relationship - Male householder not living alone (%)
Household type by relationship - Female householder living alone (%)
Household type by relationship - Female householder not living alone (%)
Household type by relationship - Opposite-Sex spouse (%)
Household type by relationship - Same-Sex spouse (%)
Household type by relationship - Opposite-Sex unmarried partner (%)
Household type by relationship - Same-Sex unmarried partner (%)
Household type by relationship - In group quarters (%)
Size of family households - 2-person household (%)
Size of family households - 3-person household (%)
Size of family households - 4-person household (%)
Size of family households - 5-person household (%)
Size of family households - 6-person household (%)
Size of family households - 7-or-more-person household (%)
Size of nonfamily households - 1-person household (%)
Size of nonfamily households - 2-person household (%)
Size of nonfamily households - 3-person household (%)
Size of nonfamily households - 4-person household (%)
Size of nonfamily households - 5-person household (%)
Size of nonfamily households - 6-person household (%)
Size of nonfamily households - 7-or-moreperson household (%)
Year house built - Built 2010 or later (%)
Year house built - Built 2000 to 2009 (%)
Year house built - Built 1990 to 1999 (%)
Year house built - Built 1980 to 1989 (%)
Year house built - Built 1970 to 1979 (%)
Year house built - Built 1960 to 1969 (%)
Year house built - Built 1950 to 1959 (%)
Year house built - Built 1940 to 1949 (%)
Year house built - Built 1939 or earlier (%)
Median number of rooms in houses and condos
Median number of rooms in apartments
Median number of bedrooms in owner occupied houses
Mean number of bedrooms in owner occupied houses
Median number of bedrooms in renter occupied houses
Mean number of bedrooms in renter occupied houses
Median number of vehichles in owner occupied houses
Mean number of vehichles in owner occupied houses
Median number of vehichles in renter occupied houses
Mean number of vehichles in renter occupied houses
Rooms in owner-occupied houses - 1 room (%)
Rooms in owner-occupied houses - 2 rooms (%)
Rooms in owner-occupied houses - 3 rooms (%)
Rooms in owner-occupied houses - 4 rooms (%)
Rooms in owner-occupied houses - 5 rooms (%)
Rooms in owner-occupied houses - 6 rooms (%)
Rooms in owner-occupied houses - 7 rooms (%)
Rooms in owner-occupied houses - 8 rooms (%)
Rooms in owner-occupied houses - 9+ rooms (%)
Rooms in renter-occupied houses - 1 room (%)
Rooms in renter-occupied houses - 2 rooms (%)
Rooms in renter-occupied houses - 3 rooms (%)
Rooms in renter-occupied houses - 4 rooms (%)
Rooms in renter-occupied houses - 5 rooms (%)
Rooms in renter-occupied houses - 6 rooms (%)
Rooms in renter-occupied houses - 7 rooms (%)
Rooms in renter-occupied houses - 8 rooms (%)
Rooms in renter-occupied houses - 9+ rooms (%)
Bedrooms in owner-occupied houses - no bedrooms (%)
Bedrooms in owner-occupied houses - 1 bedroom (%)
Bedrooms in owner-occupied houses - 2 bedrooms (%)
Bedrooms in owner-occupied houses - 3 bedrooms (%)
Bedrooms in owner-occupied houses - 4 bedrooms (%)
Bedrooms in owner-occupied houses - 5+ bedrooms (%)
Bedrooms in renter-occupied houses - no bedrooms (%)
Bedrooms in renter-occupied houses - 1 bedroom (%)
Bedrooms in renter-occupied houses - 2 bedrooms (%)
Bedrooms in renter-occupied houses - 3 bedrooms (%)
Bedrooms in renter-occupied houses - 4 bedrooms (%)
Bedrooms in renter-occupied houses - 5+ bedrooms (%)
Vehicles available in owner-occupied houses - no vehicle available (%)
Vehicles available in owner-occupied houses - 1 vehicle available(%)
Vehicles available in owner-occupied houses - 2 Vehicles available (%)
Vehicles available in owner-occupied houses - 3 Vehicles available (%)
Vehicles available in owner-occupied houses - 4 Vehicles available (%)
Vehicles available in owner-occupied houses - 5+ Vehicles available (%)
Vehicles available in renter-occupied houses - no vehicle available (%)
Vehicles available in renter-occupied houses - 1 vehicle available (%)
Vehicles available in renter-occupied houses - 2 Vehicles available (%)
Vehicles available in renter-occupied houses - 3 Vehicles available (%)
Vehicles available in renter-occupied houses - 4 Vehicles available (%)
Vehicles available in renter-occupied houses - 5+ Vehicles available (%)
Housing units in structures - 1, detached (%)
Housing units in structures - 1, attached (%)
Housing units in structures - 2 (%)
Housing units in structures - 3 or 4 (%)
Housing units in structures - 5 to 9 (%)
Housing units in structures - 10 to 19 (%)
Housing units in structures - 20 to 49 (%)
Housing units in structures - 50 or more (%)
Housing units in structures - Mobile home (%)
Housing units in structures - Boat, RV, van, etc. (%)
Housing units in structures - Owners - 1, detached (%)
Housing units in structures - Owners - 1, attached (%)
Housing units in structures - Owners - 2 (%)
Housing units in structures - Owners - 3 or 4 (%)
Housing units in structures - Owners - 5 to 9 (%)
Housing units in structures - Owners - 10 to 19 (%)
Housing units in structures - Owners - 20 to 49 (%)
Housing units in structures - Owners - 50 or more (%)
Housing units in structures - Owners - Mobile home (%)
Housing units in structures - Owners - Boat, RV, van, etc. (%)
Housing units in structures - Renters - 1, detached (%)
Housing units in structures - Renters - 1, attached (%)
Housing units in structures - Renters - 2 (%)
Housing units in structures - Renters - 3 or 4 (%)
Housing units in structures - Renters - 5 to 9 (%)
Housing units in structures - Renters - 10 to 19 (%)
Housing units in structures - Renters - 20 to 49 (%)
Housing units in structures - Renters - 50 or more (%)
Housing units in structures - Renters - Mobile home (%)
Housing units in structures - Renters - Boat, RV, van, etc. (%)
House/condo owner moved in on average (years ago)
Renter moved in on average (years ago)
Year householder moved into unit - Moved in 1999 to March 2000 (%)
Year householder moved into unit - Moved in 1999 to March 2000 (%) - White
Year householder moved into unit - Moved in 1999 to March 2000 (%) - Black or African American
Year householder moved into unit - Moved in 1999 to March 2000 (%) - Asian
Year householder moved into unit - Moved in 1999 to March 2000 (%) - Hispanic or Latino
Year householder moved into unit - Moved in 1999 to March 2000 (%) - American Indian and Alaska Native
Year householder moved into unit - Moved in 1999 to March 2000 (%) - Multirace
Year householder moved into unit - Moved in 1999 to March 2000 (%) - Other Race
Year householder moved into unit - Moved in 1995 to 1998 (%)
Year householder moved into unit - Moved in 1995 to 1998 (%) - White
Year householder moved into unit - Moved in 1995 to 1998 (%) - Black or African American
Year householder moved into unit - Moved in 1995 to 1998 (%) - Asian
Year householder moved into unit - Moved in 1995 to 1998 (%) - Hispanic or Latino
Year householder moved into unit - Moved in 1995 to 1998 (%) - American Indian and Alaska Native
Year householder moved into unit - Moved in 1995 to 1998 (%) - Multirace
Year householder moved into unit - Moved in 1995 to 1998 (%) - Other Race
Year householder moved into unit - Moved in 1990 to 1994 (%)
Year householder moved into unit - Moved in 1990 to 1994 (%) - White
Year householder moved into unit - Moved in 1990 to 1994 (%) - Black or African American
Year householder moved into unit - Moved in 1990 to 1994 (%) - Asian
Year householder moved into unit - Moved in 1990 to 1994 (%) - Hispanic or Latino
Year householder moved into unit - Moved in 1990 to 1994 (%) - American Indian and Alaska Native
Year householder moved into unit - Moved in 1990 to 1994 (%) - Multirace
Year householder moved into unit - Moved in 1990 to 1994 (%) - Other Race
Year householder moved into unit - Moved in 1980 to 1989 (%)
Year householder moved into unit - Moved in 1980 to 1989 (%) - White
Year householder moved into unit - Moved in 1980 to 1989 (%) - Black or African American
Year householder moved into unit - Moved in 1980 to 1989 (%) - Asian
Year householder moved into unit - Moved in 1980 to 1989 (%) - Hispanic or Latino
Year householder moved into unit - Moved in 1980 to 1989 (%) - American Indian and Alaska Native
Year householder moved into unit - Moved in 1980 to 1989 (%) - Multirace
Year householder moved into unit - Moved in 1980 to 1989 (%) - Other Race
Year householder moved into unit - Moved in 1970 to 1979 (%)
Year householder moved into unit - Moved in 1970 to 1979 (%) - White
Year householder moved into unit - Moved in 1970 to 1979 (%) - Black or African American
Year householder moved into unit - Moved in 1970 to 1979 (%) - Asian
Year householder moved into unit - Moved in 1970 to 1979 (%) - Hispanic or Latino
Year householder moved into unit - Moved in 1970 to 1979 (%) - American Indian and Alaska Native
Year householder moved into unit - Moved in 1970 to 1979 (%) - Multirace
Year householder moved into unit - Moved in 1970 to 1979 (%) - Other Race
Year householder moved into unit - Moved in 1969 or earlier (%)
Year householder moved into unit - Moved in 1969 or earlier (%) - White
Year householder moved into unit - Moved in 1969 or earlier (%) - Black or African American
Year householder moved into unit - Moved in 1969 or earlier (%) - Asian
Year householder moved into unit - Moved in 1969 or earlier (%) - Hispanic or Latino
Year householder moved into unit - Moved in 1969 or earlier (%) - American Indian and Alaska Native
Year householder moved into unit - Moved in 1969 or earlier (%) - Multirace
Year householder moved into unit - Moved in 1969 or earlier (%) - Other Race
Housing units lacking complete plumbing facilities (%)
Housing units lacking complete kitchen facilities (%)
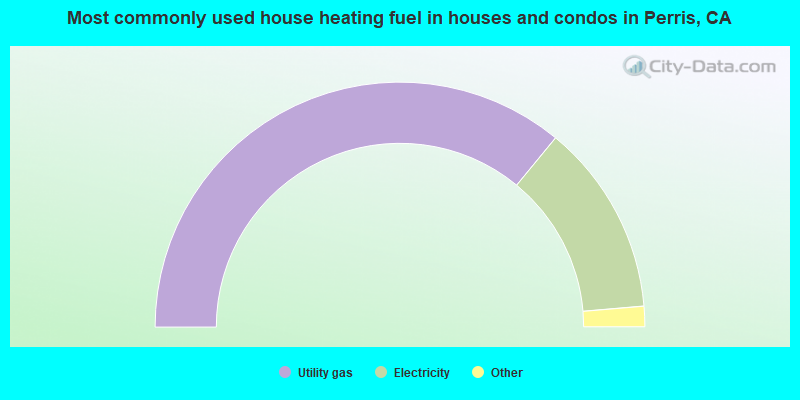
House heating fuel used in houses and condos - Utility gas (%)
House heating fuel used in houses and condos - Bottled, tank, or LP gas (%)
House heating fuel used in houses and condos - Electricity (%)
House heating fuel used in houses and condos - Fuel oil, kerosene, etc. (%)
House heating fuel used in houses and condos - Coal or coke (%)
House heating fuel used in houses and condos - Wood (%)
House heating fuel used in houses and condos - Solar energy (%)
House heating fuel used in houses and condos - Other fuel (%)
House heating fuel used in houses and condos - No fuel used (%)
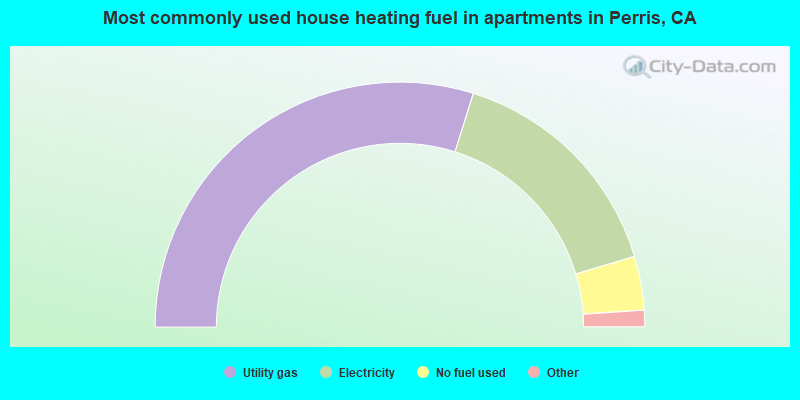
House heating fuel used in apartments - Utility gas (%)
House heating fuel used in apartments - Bottled, tank, or LP gas (%)
House heating fuel used in apartments - Electricity (%)
House heating fuel used in apartments - Fuel oil, kerosene, etc. (%)
House heating fuel used in apartments - Coal or coke (%)
House heating fuel used in apartments - Wood (%)
House heating fuel used in apartments - Solar energy (%)
House heating fuel used in apartments - Other fuel (%)
House heating fuel used in apartments - No fuel used (%)
Latest news about housing in Perris, CA collected exclusively by city-data.com from local newspapers, TV, and radio stations
Median year house/condo built: 2001Median year apartment built: 1997Household type by relationship:
Households: 80,258
Male householders: 7,533 (937 living alone ), Female householders: 11,710 (1,273 living alone )11,297 spouses (11,201 opposite-sex spouses ), 1,856 unmarried partners , (1,856 opposite-sex unmarried partners ), 33,263 children (31,765 natural , 974 adopted , 524 stepchildren ), 3,625 grandchildren , 1,814 brothers or sisters , 3,497 parents , 0 foster children , 3,308 other relatives , 2,207 non-relatives In group quarters: 148
Size of family households: 2,481 2-persons , 3,063 3-persons , 3,529 4-persons , 3,630 5-persons , 1,407 6-persons , 2,233 7-or-more-persons .
Size of nonfamily households: 2,210 1-person , 353 2-persons , 301 3-persons , 36 4-persons .
12,775 married couples with children. single-parent households (832 men , 7,069 women ).
33.6% of residents of Perris speak English at home. of residents speak Spanish at home (68% speak English very well , 14% speak English well , 10% speak English not well , 7% don't speak English at all ).of residents speak other Indo-European language at home (67% speak English very well , 19% speak English well , 8% speak English not well , 6% don't speak English at all ).of residents speak Asian or Pacific Island language at home (47% speak English very well , 30% speak English well , 19% speak English not well , 4% don't speak English at all ).of residents speak other language at home (68% speak English very well , 27% speak English well , 5% speak English not well ).
Foreign born population: 22,498 (28.0%)of them are naturalized citizens )
Median number of rooms in houses and condos:
Median number of rooms in apartments
Owner-occupied Renter-occupied
Rooms in owner-occupied houses in Perris, California
243 1 room 51 2 rooms 429 3 rooms 2,527 4 rooms 2,520 5 rooms 2,370 6 rooms 1,552 7 rooms 1,407 8 rooms 2,030 9+ rooms
Rooms in renter-occupied apartments in Perris, California
54 1 room 141 2 rooms 1,358 3 rooms 1,140 4 rooms 1,126 5 rooms 1,199 6 rooms 463 7 rooms 0 8 rooms 633 9+ rooms
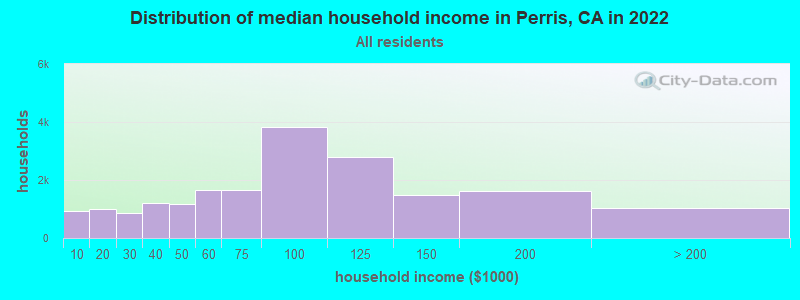
Perris, CA household income distribution 921 Less than $10,0001,012 $10,000 to $19,999852 $20,000 to $29,9991,209 $30,000 to $39,9991,161 $40,000 to $49,9991,663 $50,000 to $59,9991,653 $60,000 to $74,9993,819 $75,000 to $99,9992,796 $100,000 to $124,9991,496 $125,000 to $149,9991,629 $150,000 to $199,9991,032 $200,000 or more
Home value of owner - occupied houses in 2022 in Perris, CA 107 Less than $10,0007 $10,000 to $14,99931 $20,000 to $24,9996 $25,000 to $29,99951 $30,000 to $34,99944 $35,000 to $39,999215 $40,000 to $49,99928 $50,000 to $59,99914 $60,000 to $69,99947 $70,000 to $79,99977 $80,000 to $89,99924 $90,000 to $99,99968 $100,000 to $124,99960 $125,000 to $149,99971 $150,000 to $174,99951 $175,000 to $199,999496 $200,000 to $249,999324 $250,000 to $299,9992,788 $300,000 to $399,9992,815 $400,000 to $499,9992,526 $500,000 to $749,999195 $750,000 to $999,999153 $1,000,000 to $1,499,99914 $2,000,000 or moreRent paid by renters in 2022 in Perris, CA 21 Less than $10023 $150 to $199113 $200 to $2494 $250 to $29931 $400 to $44958 $450 to $499276 $500 to $5498 $550 to $59980 $600 to $64969 $650 to $699284 $700 to $749153 $750 to $799160 $800 to $899273 $900 to $999819 $1,000 to $1,249831 $1,250 to $1,4991,858 $1,500 to $1,999628 $2,000 to $2,49955 $2,500 to $2,99952 $3,000 to $3,499238 No cash rent
Percentage of workers working in this county: 78.8%Number of people working at home: 1,837 (5.1% of all workers )
Travel time to work (commute)
Less than 5 minutes: 2315 to 9 minutes: 1,55110 to 14 minutes: 1,72315 to 19 minutes: 4,35520 to 24 minutes: 4,01325 to 29 minutes: 1,65130 to 34 minutes: 6,59935 to 39 minutes: 53540 to 44 minutes: 1,88445 to 59 minutes: 2,44060 to 89 minutes: 4,15090 or more minutes: 2,520
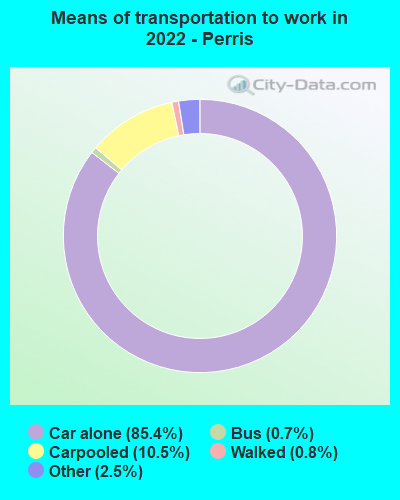
Means of transportation to work:
Drove a car alone: 25,411 (78.2%)Carpooled: 3,397 (10.5%)Bus : 185 (0.6%)Long-distance train or commuter rail : 1 (0.0%)Taxi: 759 (2.3%)Bicycle: 36 (0.1%)Walked: 243 (0.7%)Worked at home: 1,837 (5.7%)
Unemployment by race in 2022
Unemployment rate for White non-Hispanic residents 8.8% Males9.7% FemalesUnemployment rate for Black residents 12.5% Males5.3% FemalesUnemployment rate for American Indian and Alaska Native residents 7.0% Males23.6% FemalesUnemployment rate for Asian residents 5.0% Males2.9% FemalesUnemployment rate for other race residents 11.5% Males11.3% FemalesUnemployment rate for two or more race residents 12.2% Males7.5% FemalesUnemployment rate for Hispanic or Latino residents 10.6% Males10.2% Females
Year of entry for the foreign-born population in Perris, California
2,405 2010 or later 5,490 2000 to 2009 4,537 1990 to 1999 3,830 1980 to 1989 2,166 1970 to 1979 959 Before 1970
First ancestries reported:
American: 651 (1.2%)
English: 282 (0.5%)
Italian: 266 (0.5%)
African: 243 (0.4%)
Irish: 194 (0.3%)
German: 187 (0.3%)
Jamaican: 164 (0.3%)
French: 139 (0.2%)
Belizean: 93 (0.2%)
European: 91 (0.2%)
Norwegian: 45 (0.08%)
Romanian: 25 (0.04%)
Portuguese: 22 (0.04%)
Canadian: 20 (0.04%)
Scandinavian: 19 (0.03%)
Arab: 17 (0.03%)
Austrian: 16 (0.03%)
Brazilian: 15 (0.03%)
Scottish: 14 (0.03%)
French Canadian: 12 (0.02%)
Iranian: 12 (0.02%)
Scotch-Irish: 11 (0.02%)
Polish: 6 (0.01%)
Basque: 4 (0.01%) Most common places of birth for foreign-born residents (%): Mexico Perris:
75.0% (18,300)California:
37.2% (3,881,193)
El Salvador Perris:
4.4% (1,067)California:
4.2% (440,287)
Guatemala Perris:
3.7% (899)California:
2.8% (290,436)
Philippines Perris:
3.0% (738)California:
7.8% (818,297)
Nicaragua Perris:
1.6% (402)California:
0.6% (58,161)
Place of birth for U.S.-born residents:
This state: 50,677Other state: 3,833Northeast: 211Midwest: 1,091South: 1,988West: 543 94.2% of Perris residents lived in the same house 1 years ago.
Out of people who lived in different houses, 29.0% lived in this county.
Out of people who lived in different counties, 95.5% lived in California.
Perris:
94.2%State average:
88.9%
Education attainment for males 25 years and older:
No schooling: 1,905Nursery to 4th grade: 4675th and 6th grade: 1,2047th and 8th grade: 559th grade: 99210th grade: 21611th grade: 45512th grade, no diploma: 1,164High school graduate (or equivalency): 8,533Less than 1 year of college: 2,307Some college more than 1 year, no degree: 3,279Associate degree: 1,012Bachelor's degree: 1,018Master's degree: 333Professional school degree: 49Doctorate degree: 68
Education attainment for females 25 years and older:
No schooling: 1,262Nursery to 4th grade: 7995th and 6th grade: 2,0867th and 8th grade: 5229th grade: 52010th grade: 39411th grade: 30212th grade, no diploma: 800High school graduate (or equivalency): 7,045Less than 1 year of college: 2,383Some college more than 1 year, no degree: 3,738Associate degree: 1,708Bachelor's degree: 1,734Master's degree: 304Professional school degree: 0Doctorate degree: 168
Housing units in structures:
One, detached: 15,846One, attached: 5773 or 4: 9265 to 9: 59110 to 19: 14420 to 49: 8250 or more: 378Mobile homes: 1,668Boats, RVs, vans, etc.: 155Median worth of mobile homes: $95,100
Housing units lacking complete plumbing facilities in 2022: 0.7%Housing units lacking complete kitchen facilities in 2022: 1.4%House/condo owner moved in on average 8 years ago
Renter moved in on average 4 years ago
Private vs. public school enrollment:
Students in private schools in grades 1 to 8 (elementary and middle school): 335 Here:
3.1%California:
10.5%
Students in private schools in grades 9 to 12 (high school): 339 Students in private undergraduate colleges: 754 Here:
16.5%California:
15.9%