Peru, NE (Nebraska) Houses and Residents
| Peru: | $98,227 |
| Nebraska: | $232,400 |
Total population: 837 (Urban population: 0, Rural population: 571 (all nonfarm))
Houses: 317 (251 occupied: 157 owner occupied, 98 renter occupied)
| % of renters here: | 38% |
| State: | 34% |
Housing density: 591 houses/condos per square mile
Median price asked for vacant for-sale houses and condos in 2022 in this county: $70,643.
Median contract rent in 2022: $539 (lower quartile is $439, upper quartile is $883)
Median rent asked for vacant for-rent units in 2022: $2,798
Median gross rent in Peru, NE in 2022: $539
Housing units in Peru with a mortgage: 47 (1 second mortgage, 0 home equity loan, 1 both second mortgage and home equity loan)
Houses without a mortgage: 3
Median household income for houses/condos with a mortgage: $59,947
Median household income for apartments without a mortgage: $56,201
Median monthly housing costs: $601
Compare current foreclosures near Peru, NE:
| Photo | Address | Area | Beds / Baths | Price | Details |
|---|---|---|---|---|---|

|
#1
2nd St
Peru, NE 68421
|
- sq. feet
|
- baths - beds |
show details | |

|
#2
5th Corso
Nebraska City, NE 68410
|
691 sq. feet
|
1 baths 1 beds |
show details | |

|
#3
10th Ave
Nebraska City, NE 68410
|
1,852 sq. feet
|
1 baths 3 beds |
show details | |

|
#4
1st Corso
Nebraska City, NE 68410
|
706 sq. feet
|
1 baths 2 beds |
show details | |

|
#5
2nd Corso
Nebraska City, NE 68410
|
770 sq. feet
|
1 baths 2 beds |
show details | |

|
#6
2nd Ave
Nebraska City, NE 68410
|
1,098 sq. feet
|
1 baths 2 beds |
show details | |

|
#7
5th Ter
Nebraska City, NE 68410
|
1,536 sq. feet
|
1 baths 4 beds |
show details | |

|
#8
E 12th Corso
Nebraska City, NE 68410
|
1,196 sq. feet
|
2 baths 3 beds |
show details | |

|
#9
O St
Auburn, NE 68305
|
- sq. feet
|
1 baths 2 beds |
show details | |

|
#10
N 11th St
Nebraska City, NE 68410
|
1,521 sq. feet
|
2 baths 2 beds |
show details |
| Photo | Address | Area | Beds / Baths | Price | Details |
|---|---|---|---|---|---|

|
#11
1st Ave
Nebraska City, NE 68410
|
- sq. feet
|
- baths - beds |
show details | |

|
#12
S 2nd St Apt 105
Nebraska City, NE 68410
|
- sq. feet
|
- baths - beds |
show details | |

|
#13
725 Rd
Auburn, NE 68305
|
- sq. feet
|
- baths - beds |
show details | |

|
#14
Elm St
Nebraska City, NE 68410
|
- sq. feet
|
- baths - beds |
show details | |

|
#15
200th St
Rock Port, MO 64482
|
- sq. feet
|
- baths - beds |
show details | |

|
#16
3rd Ave
Nebraska City, NE 68410
|
- sq. feet
|
- baths - beds |
show details | |

|
#17
Market St
Talmage, NE 68448
|
- sq. feet
|
- baths - beds |
show details | |

|
#18
Central Ave
Auburn, NE 68305
|
- sq. feet
|
- baths - beds |
show details | |

|
#19
11th St
Auburn, NE 68305
|
- sq. feet
|
- baths - beds |
show details | |

|
#20
O St
Auburn, NE 68305
|
- sq. feet
|
- baths - beds |
show details |
| Photo | Address | Area | Beds / Baths | Price | Details |
|---|---|---|---|---|---|

|
Check over 1 million property listings on Foreclosure.com!
|
browse all offers | |||
| Photo | Address | Area | Beds / Baths | Price | Details |
|---|

Latest news about housing in Peru, NE collected exclusively by city-data.com from local newspapers, TV, and radio stations

 | Affordable housing around Peru, Nebraska? (0 replies) |
| How to Get to Peru, Nebraska? (12 replies) |
| Officially moving to Omaha.. help please (11 replies) |
| Out of these, which school district is the best? (45 replies) |
| Not everything that was needed, but this Health Care law will be good for rural America (116 replies) |
| Moving to Nebraska from Chicago, I don't know what to expect. (16 replies) |

Median year apartment built: 1938
Household type by relationship:
Households: 730- Male householders: 154 (78 living alone), Female householders: 93 (41 living alone)
50 spouses (48 opposite-sex spouses), 10 unmarried partners, (10 opposite-sex unmarried partners), 83 children (83 natural, 0 adopted, 0 stepchildren), 19 grandchildren, 3 brothers or sisters, 0 parents, 0 foster children, 0 other relatives, 85 non-relatives
- In group quarters: 231
Size of family households: 44 2-persons, 8 3-persons, 19 4-persons, 5 5-persons, 11 6-persons.
Size of nonfamily households: 126 1-person, 11 2-persons, 7 3-persons, 10 4-persons.
55 married couples with children.
5 single-parent households (3 men, 2 women).
92.5% of residents of Peru speak English at home.
6.4% of residents speak Spanish at home (91% speak English very well, 9% speak English well).
0.7% of residents speak Asian or Pacific Island language at home (100% speak English very well).
Foreign born population: 24 (3.3%)
(58.3% of them are naturalized citizens)
| Here: | 6.5 |
| State: | 7.1 |
| Here: | 4.5 |
| State: | 4.2 |

- Bedrooms in owner-occupied houses and condos in Peru, Nebraska
- 0no bedroom
- 111 bedroom
- 332 bedrooms
- 573 bedrooms
- 204 bedrooms
- 365+ bedrooms

- Bedrooms in renter-occupied apartments in Peru, Nebraska
- 0no bedroom
- 431 bedroom
- 62 bedrooms
- 333 bedrooms
- 74 bedrooms
- 85+ bedrooms

- Cars and other vehicles available in Peru in owner-occupied houses/condos
- 2no vehicle
- 301 vehicle
- 942 vehicles
- 73 vehicles
- 174 vehicles
- 75+ vehicles

- Cars and other vehicles available in Peru in renter-occupied apartments
- 17no vehicle
- 401 vehicle
- 112 vehicles
- 203 vehicles
- 104 vehicles
- 05+ vehicles

- Rooms in owner-occupied houses in Peru, Nebraska
- 01 room
- 02 rooms
- 03 rooms
- 224 rooms
- 205 rooms
- 376 rooms
- 217 rooms
- 398 rooms
- 199+ rooms

- Rooms in renter-occupied apartments in Peru, Nebraska
- 01 room
- 142 rooms
- 293 rooms
- 44 rooms
- 145 rooms
- 216 rooms
- 167 rooms
- 08 rooms
- 09+ rooms


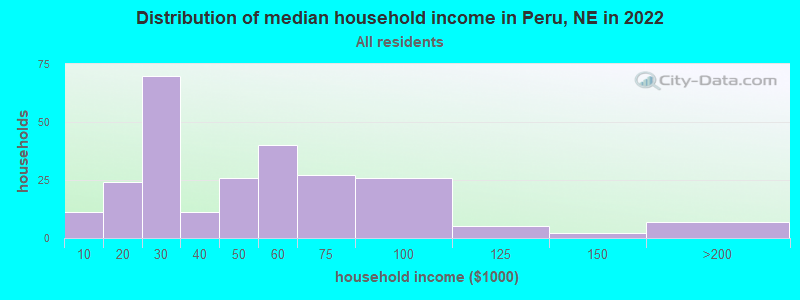
Peru, NE household income distribution

- 11Less than $10,000
- 24$10,000 to $19,999
- 70$20,000 to $29,999
- 11$30,000 to $39,999
- 26$40,000 to $49,999
- 40$50,000 to $59,999
- 27$60,000 to $74,999
- 26$75,000 to $99,999
- 5$100,000 to $124,999
- 2$125,000 to $149,999
- 7$150,000 to $199,999
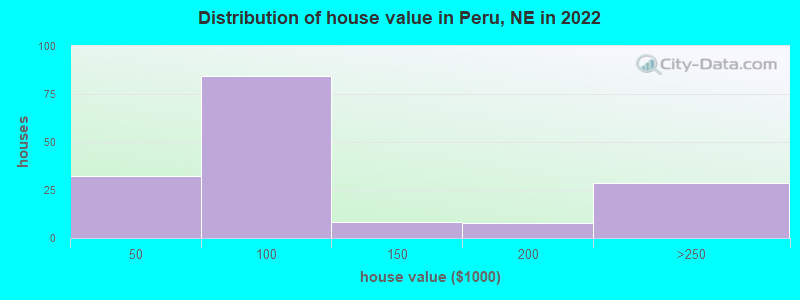
Home value of owner - occupied houses in 2022 in Peru, NE
-
- 5Less than $10,000
- 3$15,000 to $19,999
- 24$40,000 to $49,999
- 1$50,000 to $59,999
- 4$60,000 to $69,999
- 11$70,000 to $79,999
- 28$80,000 to $89,999
- 14$90,000 to $99,999
- 8$100,000 to $124,999
- 5$150,000 to $174,999
- 2$175,000 to $199,999
- 28$200,000 to $249,999
Rent paid by renters in 2022 in Peru, NE
-
- 7$250 to $299
- 5$300 to $349
- 9$400 to $449
- 11$450 to $499
- 14$500 to $549
- 9$650 to $699
- 14$800 to $899
- 10$900 to $999
- 10$1,000 to $1,249
- 1$1,500 to $1,999
- 3No cash rent


Percentage of workers working in this county: 77.1%
Number of people working at home: 23 (6.3% of all workers)
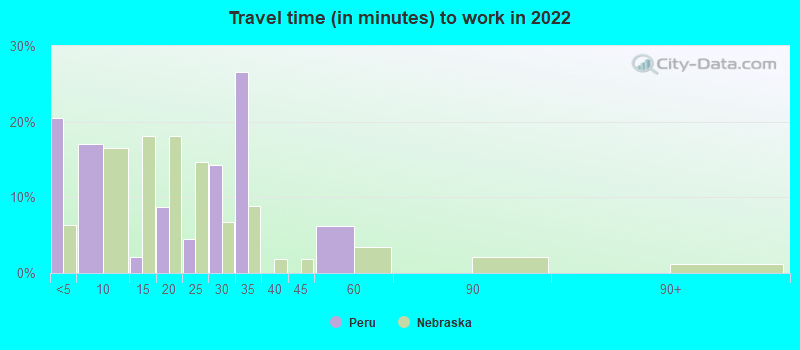
Travel time to work (commute)
- Less than 5 minutes: 83
- 5 to 9 minutes: 50
- 10 to 14 minutes: 36
- 15 to 19 minutes: 66
- 20 to 24 minutes: 30
- 25 to 29 minutes: 7
- 30 to 34 minutes: 35
- 35 to 39 minutes: 0
- 40 to 44 minutes: 14
- 45 to 59 minutes: 11
- 60 to 89 minutes: 0
- 90 or more minutes: 1
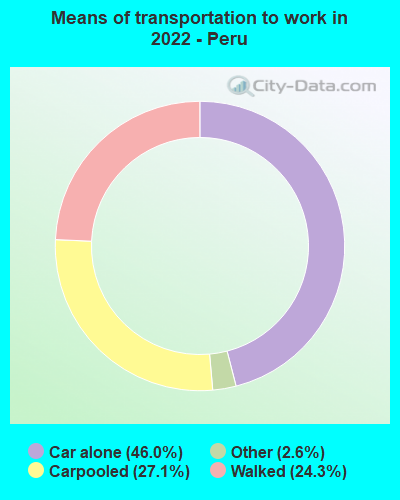
Means of transportation to work:
- Drove a car alone: 191 (43.0%)
- Carpooled: 117 (26.4%)
- Taxi: 11 (2.5%)
- Walked: 96 (21.6%)
- Worked at home: 23 (5.2%)

- Unemployment by race in 2022
- Unemployment rate for White non-Hispanic residents
- 6.5%Males
- 3.7%Females
- Unemployment rate for American Indian and Alaska Native residents
- 100.0%Males
- Unemployment rate for other race residents
- 41.4%Females
- Unemployment rate for Hispanic or Latino residents
- 16.6%Males
- 46.4%Females

- Year of entry for the foreign-born population in Peru, Nebraska
- 152010 or later
- 102000 to 2009
- 01990 to 1999
- 01980 to 1989
- 01970 to 1979
- 4Before 1970
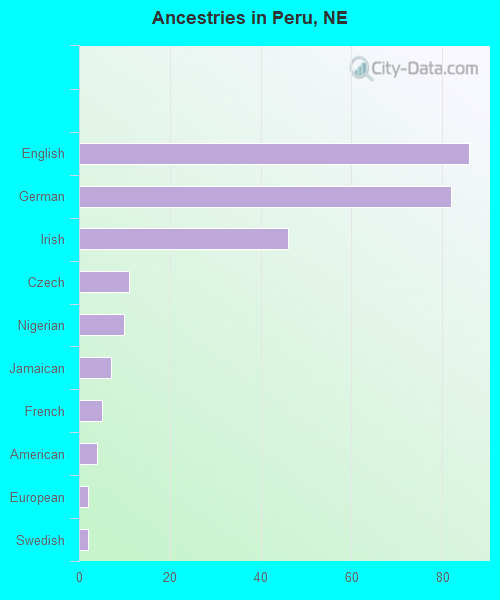
First ancestries reported:
- English: 86 (28.4%)
- German: 82 (27.1%)
- Irish: 46 (15.2%)
- Czech: 11 (3.6%)
- Nigerian: 10 (3.3%)
- Jamaican: 7 (2.3%)
- French: 5 (1.7%)
- American: 4 (1.3%)
- European: 2 (0.7%)
- Swedish: 2 (0.7%)
Most common places of birth for foreign-born residents (%):
| Peru: | 40.0% (10) |
| Nebraska: | 0.2% (273) |
| Peru: | 24.0% (6) |
| Nebraska: | 0.5% (671) |
| Peru: | 24.0% (6) |
| Nebraska: | 0.7% (1,086) |
| Peru: | 16.0% (4) |
| Nebraska: | 2.2% (3,167) |
Place of birth for U.S.-born residents:
- This state: 400
- Other state: 302
- Northeast: 3
- Midwest: 168
- South: 87
- West: 43
56.9% of Peru residents lived in the same house 1 years ago.
Out of people who lived in different houses, 29.9% lived in this county.
Out of people who lived in different counties, 73.2% lived in Nebraska.
| Peru: | 56.9% |
| State average: | 87.4% |
Education attainment for males 25 years and older:
- No schooling: 2
- Nursery to 4th grade: 7
- 5th and 6th grade: 0
- 7th and 8th grade: 0
- 9th grade: 0
- 10th grade: 0
- 11th grade: 0
- 12th grade, no diploma: 2
- High school graduate (or equivalency): 40
- Less than 1 year of college: 10
- Some college more than 1 year, no degree: 43
- Associate degree: 6
- Bachelor's degree: 74
- Master's degree: 10
- Professional school degree: 0
- Doctorate degree: 0

Education attainment for females 25 years and older:
- No schooling: 0
- Nursery to 4th grade: 0
- 5th and 6th grade: 0
- 7th and 8th grade: 0
- 9th grade: 3
- 10th grade: 0
- 11th grade: 3
- 12th grade, no diploma: 0
- High school graduate (or equivalency): 35
- Less than 1 year of college: 14
- Some college more than 1 year, no degree: 20
- Associate degree: 3
- Bachelor's degree: 14
- Master's degree: 12
- Professional school degree: 0
- Doctorate degree: 0


Housing units in structures:
- One, detached: 236
- Two: 19
- 3 or 4: 52
- 5 to 9: 7
- Mobile homes: 2
Housing units lacking complete kitchen facilities in 2022: 5.8%
House/condo owner moved in on average 14 years ago
Renter moved in on average 1 years ago

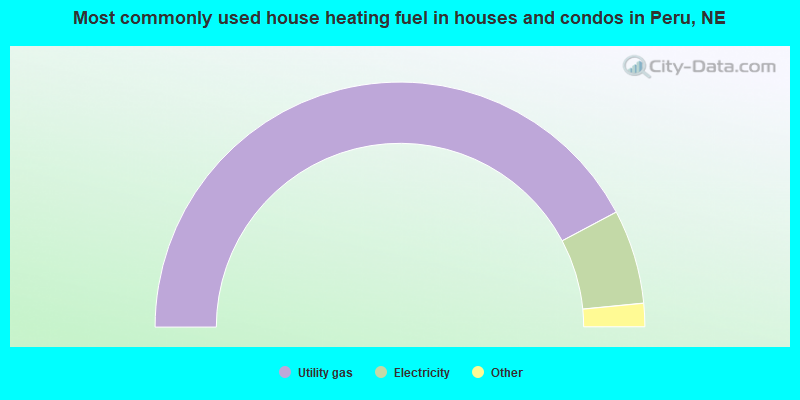
- 84.9%Utility gas
- 12.5%Electricity
- 1.3%Bottled, tank, or LP gas
- 1.3%No fuel used
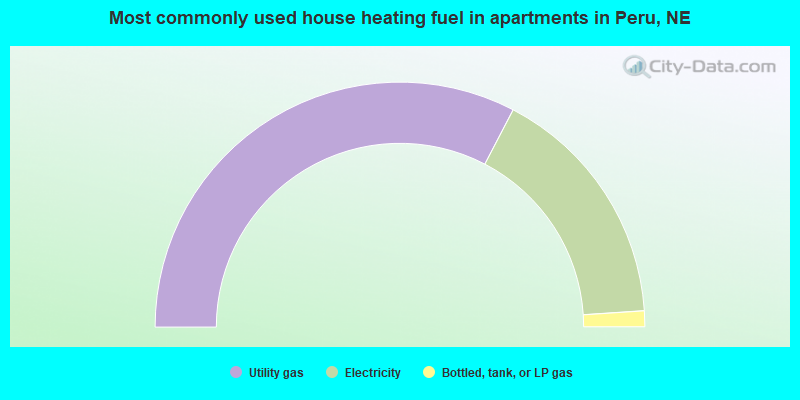
- 65.3%Utility gas
- 32.6%Electricity
- 2.1%Bottled, tank, or LP gas
Private vs. public school enrollment:
| Here: | 0.0% |
| Nebraska: | 14.1% |
| Here: | 0.0% |
| Nebraska: | 12.5% |
| Here: | 6.4% |
| Nebraska: | 18.0% |


