Peru, VT (Vermont) Houses and Residents
| Peru: | $479,813 |
| Vermont: | $304,700 |
Total population: 375 (Urban population: 0, Rural population: 456 (all nonfarm))
Houses: 430 (165 occupied: 130 owner occupied, 35 renter occupied)
| % of renters here: | 21% |
| State: | 26% |
Housing density: 12 houses/condos per square mile
Median price asked for vacant for-sale houses and condos in 2022 in this county: $289,991.
Median contract rent in 2022: $854 (lower quartile is $755, upper quartile is $961)
Median rent asked for vacant for-rent units in 2022: $1,124
Median gross rent in Peru, VT in 2022: $1,199
Housing units in Peru with a mortgage: 43 (0 second mortgage, 3 home equity loan, 0 both second mortgage and home equity loan)
Houses without a mortgage: 37


Latest news about housing in Peru, VT collected exclusively by city-data.com from local newspapers, TV, and radio stations

 | International Presence in Vermont (50 replies) |
| Is there a vacation home out there??? (11 replies) |
| What parts of VT are considered "Upscale"? (18 replies) |
| Burlington to Rouses Point commute--feasible? (6 replies) |
| looking in to Burlington (13 replies) |
| Question for Vermont Republicans (6 replies) |

Household type by relationship:
Households: 35,650- In family households: 28,677 (6,529 male householders, 3,238 female householders)
7,447 spouses, 9,144 children (8,466 natural, 264 adopted, 414 stepchildren), 477 grandchildren, 195 brothers or sisters, 226 parents, foster children, 230 other relatives, 1,038 non-relatives
- In nonfamily households: 6,973 (2,514 male householders (1,948 living alone)), 3,189 female householders (2,676 living alone)), 1,270 nonrelatives
- In group quarters: 1,475 (488 institutionalized population)
6,065 married couples with children.
2,117 single-parent households (506 men, 1,611 women).
95.9% of residents of Peru speak English at home.
0.5% of residents speak Spanish at home (100% speak English very well).
2.5% of residents speak other Indo-European language at home (100% speak English very well).
1.1% of residents speak Asian or Pacific Island language at home (100% speak English very well).
Foreign born population: 10 (2.0%)
(30.0% of them are naturalized citizens)
| Here: | 6.4 |
| State: | 6.4 |
| Here: | 4.3 |
| State: | 3.9 |

- Bedrooms in owner-occupied houses and condos in Peru, Vermont
- 2no bedroom
- 91 bedroom
- 182 bedrooms
- 383 bedrooms
- 324 bedrooms
- 315+ bedrooms

- Bedrooms in renter-occupied apartments in Peru, Vermont
- 0no bedroom
- 61 bedroom
- 192 bedrooms
- 63 bedrooms
- 44 bedrooms
- 05+ bedrooms

- Cars and other vehicles available in Peru in owner-occupied houses/condos
- 0no vehicle
- 221 vehicle
- 722 vehicles
- 363 vehicles
- 04 vehicles
- 05+ vehicles

- Cars and other vehicles available in Peru in renter-occupied apartments
- 3no vehicle
- 161 vehicle
- 92 vehicles
- 43 vehicles
- 34 vehicles
- 05+ vehicles

- Rooms in owner-occupied houses in Peru, Vermont
- 21 room
- 02 rooms
- 73 rooms
- 124 rooms
- 215 rooms
- 286 rooms
- 157 rooms
- 178 rooms
- 289+ rooms

- Rooms in renter-occupied apartments in Peru, Vermont
- 01 room
- 32 rooms
- 43 rooms
- 124 rooms
- 85 rooms
- 26 rooms
- 67 rooms
- 08 rooms
- 09+ rooms


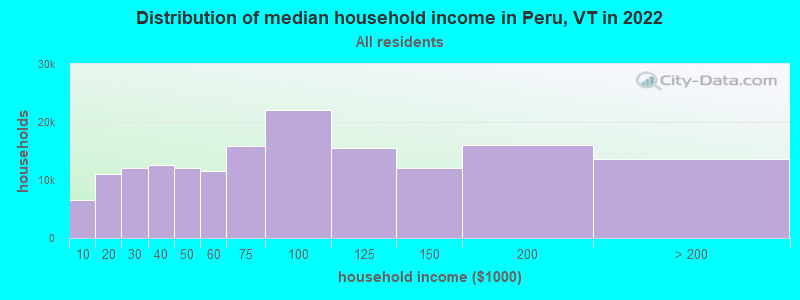
Peru, VT household income distribution

- 5,815Less than $10,000
- 11,872$10,000 to $19,999
- 13,631$20,000 to $29,999
- 15,864$30,000 to $39,999
- 14,714$40,000 to $49,999
- 14,338$50,000 to $59,999
- 19,083$60,000 to $74,999
- 28,885$75,000 to $99,999
- 19,127$100,000 to $124,999
- 15,271$125,000 to $149,999
- 19,391$150,000 to $199,999
- 17,516$200,000 or more
Percentage of workers working in this county: 66.5%
Number of people working at home: 41 (17.2% of all workers)
Travel time to work (commute)
- Less than 5 minutes: 11
- 5 to 9 minutes: 28
- 10 to 14 minutes: 23
- 15 to 19 minutes: 30
- 20 to 24 minutes: 45
- 25 to 29 minutes: 9
- 30 to 34 minutes: 37
- 35 to 39 minutes: 1
- 40 to 44 minutes: 3
- 45 to 59 minutes: 7
- 60 to 89 minutes: 4
- 90 or more minutes: 5
Means of transportation to work:
- Drove a car alone: 146 (66.4%)
- Carpooled: 35 (15.9%)
- Bus or trolley bus: 2 (0.9%)
- Walked: 20 (9.1%)
- Worked at home: 17 (7.7%)


- Year of entry for the foreign-born population in Peru, Vermont
- 31995 to March 2000
- 01990 to 1994
- 21985 to 1989
- 01980 to 1984
- 31975 to 1979
- 01970 to 1974
- 01965 to 1969
- 2Before 1965

First ancestries reported:
- English: 109 (19.0%)
- Other: 86 (15.0%)
- Irish: 84 (14.7%)
- French: 81 (14.1%)
- German: 62 (10.8%)
- Polish: 30 (5.2%)
- Italian: 29 (5.1%)
- Scottish: 26 (4.5%)
- United States: 14 (2.4%)
- Russian: 11 (1.9%)
- Slovak: 10 (1.7%)
- Hungarian: 7 (1.2%)
- French Canadian: 6 (1.0%)
- Greek: 5 (0.9%)
- Swedish: 5 (0.9%)
- Danish: 2 (0.3%)
- Scotch-Irish: 2 (0.3%)
- Swiss: 2 (0.3%)
- Welsh: 2 (0.3%)
Most common places of birth for foreign-born residents (%):
| Peru: | 50.0% (5) |
| Vermont: | 3.4% (796) |
| Peru: | 20.0% (2) |
| Vermont: | 0.8% (191) |
| Peru: | 20.0% (2) |
| Vermont: | 34.0% (7,912) |
Place of birth for U.S.-born residents:
- This state: 157
- Other state: 287
- Northeast: 219
- Midwest: 29
- South: 23
- West: 16
67% of Peru residents lived in the same house 5 years ago.
Out of people who lived in different houses, 42% lived in this county.
Out of people who lived in different counties, 23% lived in Vermont.
Education attainment for males 25 years and older:
- No schooling: 2
- Nursery to 4th grade: 0
- 5th and 6th grade: 0
- 7th and 8th grade: 4
- 9th grade: 5
- 10th grade: 2
- 11th grade: 0
- 12th grade, no diploma: 4
- High school graduate (or equivalency): 38
- Less than 1 year of college: 6
- Some college more than 1 year, no degree: 17
- Associate degree: 2
- Bachelor's degree: 40
- Master's degree: 11
- Professional school degree: 17
- Doctorate degree: 0

Education attainment for females 25 years and older:
- No schooling: 3
- Nursery to 4th grade: 0
- 5th and 6th grade: 0
- 7th and 8th grade: 6
- 9th grade: 6
- 10th grade: 5
- 11th grade: 3
- 12th grade, no diploma: 3
- High school graduate (or equivalency): 48
- Less than 1 year of college: 5
- Some college more than 1 year, no degree: 11
- Associate degree: 18
- Bachelor's degree: 45
- Master's degree: 8
- Professional school degree: 5
- Doctorate degree: 0


Housing units in structures:
- One, detached: 304
- One, attached: 39
- Two: 49
- 3 or 4: 22
- Mobile homes: 14
- Boats, RVs, vans, etc.: 2
Median worth of mobile homes: $65,717
Housing units lacking complete kitchen facilities: 0.5%


- 67.7%Fuel oil, kerosene, etc.
- 16.2%Wood
- 14.6%Bottled, tank, or LP gas
- 1.5%Electricity
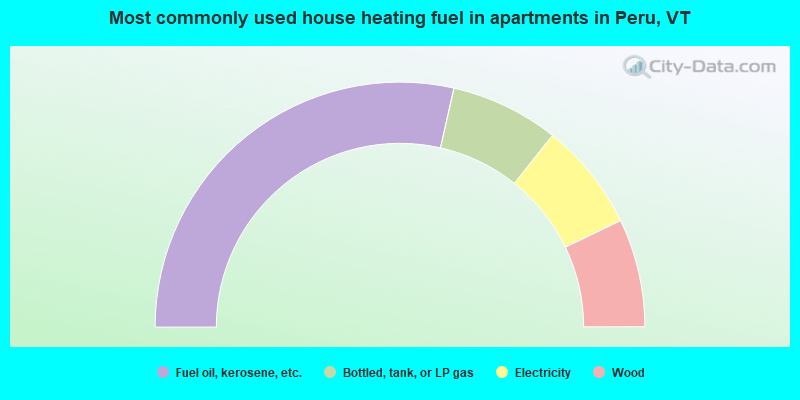
- 57.1%Fuel oil, kerosene, etc.
- 14.3%Bottled, tank, or LP gas
- 14.3%Electricity
- 14.3%Wood
Private vs. public school enrollment:
| Here: | 0.0% |
| Vermont: | 7.2% |
| Here: | 25.8% |
| Vermont: | 10.4% |
| Here: | 0.0% |
| Vermont: | 37.7% |


