Petersburg, MI (Michigan) Houses and Residents
| Petersburg: | $177,439 |
| Michigan: | $224,400 |
Mean price in 2022:
Detached houses: $175,221
Here: $175,221 State: $280,038 Townhouses or other attached units: $84,197
Here: $84,197 State: $239,520
Total population: 1,129 (Urban population: 0, Rural population: 1,147 (2 farm, 1,145 nonfarm))
Houses: 457 (438 occupied: 368 owner occupied, 70 renter occupied)
| % of renters here: | 16% |
| State: | 27% |
Housing density: 987 houses/condos per square mile
Median price asked for vacant for-sale houses and condos in 2022 in this county: $19,257.
Median contract rent in 2022: $798 (lower quartile is $759, upper quartile is $920)
Median rent asked for vacant for-rent units in 2022: $882
Median gross rent in Petersburg, MI in 2022: $1,064
Housing units in Petersburg with a mortgage: 197 (9 second mortgage, 0 home equity loan, 8 both second mortgage and home equity loan)
Houses without a mortgage: 7
Median household income for houses/condos with a mortgage: $79,068
Median household income for apartments without a mortgage: $78,490
Median monthly housing costs: $925
Compare current foreclosures near Petersburg, MI:
| Photo | Address | Area | Beds / Baths | Price | Details |
|---|---|---|---|---|---|

|
#1
Sylvania Petersburg Rd
Petersburg, MI 49270
|
2,328 sq. feet
|
3 baths 3 beds |
show details | |

|
#2
Wood St
Petersburg, MI 49270
|
1,668 sq. feet
|
1 baths 3 beds |
show details | |

|
#3
Todd Rd
Petersburg, MI 49270
|
- sq. feet
|
- baths - beds |
show details | |

|
#4
Saline St
Petersburg, MI 49270
|
- sq. feet
|
- baths - beds |
show details | |

|
#5
W Elm St
Petersburg, MI 49270
|
- sq. feet
|
- baths - beds |
show details | |

|
#6
Lulu Rd
Petersburg, MI 49270
|
- sq. feet
|
- baths - beds |
show details | |

|
#7
Morrow Rd
Toledo, OH 43615
|
1,040 sq. feet
|
1 baths 3 beds |
$164,500
|
show details |

|
#8
W Dean Rd
Temperance, MI 48182
|
1,380 sq. feet
|
2 baths 2 beds |
$135,001
|
show details |

|
#9
Artwell Dr
Sylvania, OH 43560
|
1,144 sq. feet
|
1 baths 3 beds |
$42,500
|
show details |

|
#10
Leybourn Ave
Toledo, OH 43612
|
1,126 sq. feet
|
1 baths 3 beds |
$39,900
|
show details |
| Photo | Address | Area | Beds / Baths | Price | Details |
|---|---|---|---|---|---|

|
#11
Duncan Rd
Toledo, OH 43613
|
820 sq. feet
|
1 baths 2 beds |
$34,900
|
show details |

|
#12
Hazeldell Dr
Temperance, MI 48182
|
1,199 sq. feet
|
1 baths 3 beds |
$220,000
|
show details |

|
#13
Todd Rd
Petersburg, MI 49270
|
- sq. feet
|
- baths - beds |
show details | |

|
#14
Wells Rd
Petersburg, MI 49270
|
- sq. feet
|
- baths - beds |
show details | |

|
#15
Madison St
Petersburg, MI 49270
|
- sq. feet
|
- baths - beds |
show details | |

|
#16
Wittman Dr
Petersburg, MI 49270
|
- sq. feet
|
- baths - beds |
show details | |

|
#17
W Albain Rd
Petersburg, MI 49270
|
- sq. feet
|
- baths - beds |
show details | |

|
#18
Robinson Rd
Petersburg, MI 49270
|
- sq. feet
|
- baths - beds |
show details | |

|
#19
Pope Run Ln
Sylvania, OH 43560
|
3,121 sq. feet
|
2 baths 5 beds |
show details | |

|
#20
Letchworth Pkwy
Toledo, OH 43606
|
1,526 sq. feet
|
1 baths 3 beds |
show details |
| Photo | Address | Area | Beds / Baths | Price | Details |
|---|---|---|---|---|---|

|
#21
N Roessler St
Monroe, MI 48162
|
- sq. feet
|
1 baths 4 beds |
show details | |

|
#22
Naomi Ave
Adrian, MI 49221
|
- sq. feet
|
1 baths 1 beds |
show details | |

|
#23
Claxton St
Toledo, OH 43615
|
1,234 sq. feet
|
1 baths 3 beds |
show details | |

|
#24
N Custer Rd
Monroe, MI 48162
|
2,263 sq. feet
|
2 baths 4 beds |
show details | |

|
#25
Gould Rd
Toledo, OH 43612
|
748 sq. feet
|
1 baths 2 beds |
show details | |

|
#26
Orville Dr
Toledo, OH 43612
|
2,239 sq. feet
|
2 baths 3 beds |
show details | |

|
#27
Custer Dr
Toledo, OH 43612
|
832 sq. feet
|
1 baths 2 beds |
show details | |

|
#28
Newport Ave
Toledo, OH 43613
|
1,038 sq. feet
|
1 baths 3 beds |
show details | |

|
#29
Gilhouse Rd
Toledo, OH 43623
|
1,654 sq. feet
|
1 baths 4 beds |
show details | |

|
#30
Berdan Ave
Toledo, OH 43613
|
1,416 sq. feet
|
1 baths 3 beds |
show details |
| Photo | Address | Area | Beds / Baths | Price | Details |
|---|---|---|---|---|---|

|
#31
Deerfield Rd
Adrian, MI 49221
|
1,191 sq. feet
|
1 baths 3 beds |
show details | |

|
#32
Douglas Rd
Toledo, OH 43613
|
991 sq. feet
|
1 baths 2 beds |
show details | |

|
#33
E Monroe St
Dundee, MI 48131
|
1,236 sq. feet
|
1 baths 3 beds |
show details | |

|
#34
Rivard Rd
Toledo, OH 43615
|
1,272 sq. feet
|
2 baths 3 beds |
show details | |

|
#35
Dorset Dr
Adrian, MI 49221
|
1,041 sq. feet
|
1 baths 3 beds |
show details | |

|
#36
W 5th St
Monroe, MI 48161
|
2,218 sq. feet
|
2 baths 5 beds |
show details | |

|
#37
Spafford St
Tecumseh, MI 49286
|
1,104 sq. feet
|
1 baths 3 beds |
show details | |

|
#38
Wallingford Dr
Toledo, OH 43612
|
1,224 sq. feet
|
1 baths 3 beds |
show details | |

|
#39
Commonwealth Ave
Toledo, OH 43612
|
1,118 sq. feet
|
1 baths 3 beds |
show details | |

|
#40
Eleanor Ave
Toledo, OH 43612
|
1,518 sq. feet
|
1 baths 3 beds |
show details |
| Photo | Address | Area | Beds / Baths | Price | Details |
|---|---|---|---|---|---|

|
#41
Slater St
Toledo, OH 43612
|
672 sq. feet
|
1 baths 2 beds |
show details | |

|
#42
Southover Rd
Toledo, OH 43612
|
822 sq. feet
|
1 baths 2 beds |
show details | |

|
#43
Templar Rd
Toledo, OH 43613
|
1,086 sq. feet
|
1 baths 3 beds |
show details | |

|
#44
Romaker Rd
Toledo, OH 43615
|
1,145 sq. feet
|
1 baths 2 beds |
show details | |

|
#45
Garden Park Dr
Toledo, OH 43613
|
941 sq. feet
|
1 baths 2 beds |
show details | |

|
#46
E Northgate Pkwy
Toledo, OH 43612
|
891 sq. feet
|
1 baths 3 beds |
show details | |

|
#47
Craigwood Rd
Toledo, OH 43612
|
1,494 sq. feet
|
2 baths 3 beds |
show details | |

|
#48
Charlestown Ave
Toledo, OH 43613
|
1,008 sq. feet
|
1 baths 2 beds |
show details | |

|
#49
Pence Hwy
Blissfield, MI 49228
|
1,722 sq. feet
|
1 baths 3 beds |
show details | |

|
Check over 1 million property listings on Foreclosure.com!
|
browse all offers | |||

Latest news about housing in Petersburg, MI collected exclusively by city-data.com from local newspapers, TV, and radio stations

 | Forbes just named GR #1 place to invest in house (50 replies) |
| Go East... and become homeless (154 replies) |
| Needing a current list of homeless shelters in mi (7 replies) |
| Brief Visit to Detroit-Advice (23 replies) |
| Thinking of moving to Petersburg, MI area (1 reply) |
| What are your thoughts on St. Claire Shores? Is it a safe place to live? (29 replies) |

Median year apartment built: 1958
Household type by relationship:
Households: 1,153- Male householders: 217 (39 living alone), Female householders: 219 (65 living alone)
223 spouses (223 opposite-sex spouses), 42 unmarried partners, (39 opposite-sex unmarried partners), 376 children (320 natural, 33 adopted, 23 stepchildren), 20 grandchildren, 13 brothers or sisters, 4 parents, 0 foster children, 27 other relatives, 11 non-relatives
Size of family households: 130 2-persons, 94 3-persons, 47 4-persons, 25 5-persons, 4 6-persons.
Size of nonfamily households: 105 1-person, 22 2-persons, 2 3-persons.
141 married couples with children.
104 single-parent households (69 men, 35 women).
98.4% of residents of Petersburg speak English at home.
0.3% of residents speak Spanish at home (100% speak English very well).
0.6% of residents speak other Indo-European language at home (100% speak English very well).
Foreign born population: 8 (0.7%)
(87.5% of them are naturalized citizens)
| Here: | 6.3 |
| State: | 6.5 |
| Here: | 5.0 |
| State: | 4.3 |

- Bedrooms in owner-occupied houses and condos in Petersburg, Michigan
- 0no bedroom
- 01 bedroom
- 552 bedrooms
- 2163 bedrooms
- 694 bedrooms
- 285+ bedrooms

- Bedrooms in renter-occupied apartments in Petersburg, Michigan
- 0no bedroom
- 131 bedroom
- 252 bedrooms
- 283 bedrooms
- 44 bedrooms
- 05+ bedrooms

- Cars and other vehicles available in Petersburg in owner-occupied houses/condos
- 3no vehicle
- 1001 vehicle
- 1592 vehicles
- 493 vehicles
- 274 vehicles
- 305+ vehicles

- Cars and other vehicles available in Petersburg in renter-occupied apartments
- 12no vehicle
- 361 vehicle
- 222 vehicles
- 03 vehicles
- 04 vehicles
- 05+ vehicles

- Rooms in owner-occupied houses in Petersburg, Michigan
- 01 room
- 02 rooms
- 03 rooms
- 154 rooms
- 625 rooms
- 1226 rooms
- 867 rooms
- 348 rooms
- 499+ rooms

- Rooms in renter-occupied apartments in Petersburg, Michigan
- 01 room
- 02 rooms
- 03 rooms
- 264 rooms
- 165 rooms
- 206 rooms
- 47 rooms
- 08 rooms
- 49+ rooms


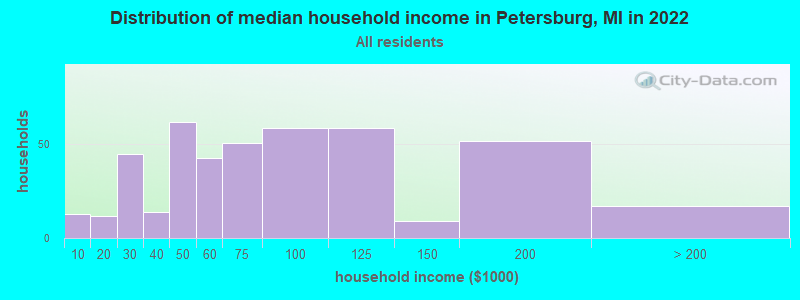
Petersburg, MI household income distribution

- 13Less than $10,000
- 12$10,000 to $19,999
- 45$20,000 to $29,999
- 14$30,000 to $39,999
- 62$40,000 to $49,999
- 43$50,000 to $59,999
- 51$60,000 to $74,999
- 59$75,000 to $99,999
- 59$100,000 to $124,999
- 9$125,000 to $149,999
- 52$150,000 to $199,999
- 17$200,000 or more
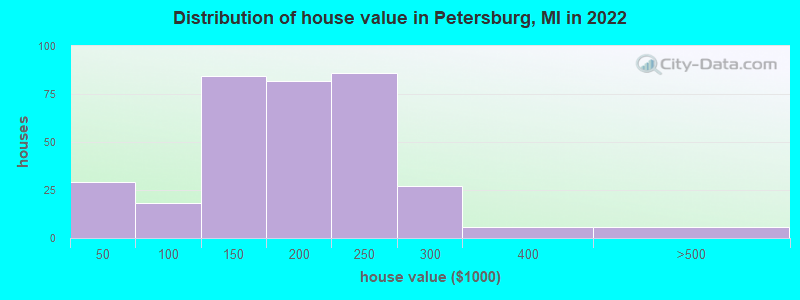
Home value of owner - occupied houses in 2022 in Petersburg, MI
-
- 5Less than $10,000
- 16$10,000 to $14,999
- 6$15,000 to $19,999
- 0$35,000 to $39,999
- 4$70,000 to $79,999
- 11$80,000 to $89,999
- 2$90,000 to $99,999
- 40$100,000 to $124,999
- 43$125,000 to $149,999
- 42$150,000 to $174,999
- 38$175,000 to $199,999
- 86$200,000 to $249,999
- 27$250,000 to $299,999
- 5$300,000 to $399,999
- 5$400,000 to $499,999
Rent paid by renters in 2022 in Petersburg, MI
-
- 13$200 to $249
- 5$350 to $399
- 1$500 to $549
- 9$650 to $699
- 4$700 to $749
- 2$750 to $799
- 36$800 to $899
- 4$900 to $999
- 18No cash rent


Percentage of workers working in this county: 52.1%
Number of people working at home: 85 (13.6% of all workers)
Travel time to work (commute)
- Less than 5 minutes: 64
- 5 to 9 minutes: 12
- 10 to 14 minutes: 95
- 15 to 19 minutes: 21
- 20 to 24 minutes: 39
- 25 to 29 minutes: 23
- 30 to 34 minutes: 117
- 35 to 39 minutes: 49
- 40 to 44 minutes: 13
- 45 to 59 minutes: 84
- 60 to 89 minutes: 13
- 90 or more minutes: 17
Means of transportation to work:
- Drove a car alone: 481 (88.7%)
- Carpooled: 24 (4.4%)
- Bus or trolley bus: 4 (0.7%)
- Walked: 13 (2.4%)
- Other means: 4 (0.7%)
- Worked at home: 16 (3.0%)

- Unemployment by race in 2022
- Unemployment rate for White non-Hispanic residents
- 7.2%Males
- 1.0%Females
- Unemployment rate for two or more race residents
- 22.8%Females

- Year of entry for the foreign-born population in Petersburg, Michigan
- 02010 or later
- 02000 to 2009
- 01990 to 1999
- 01980 to 1989
- 01970 to 1979
- 7Before 1970

First ancestries reported:
- German: 116 (27.5%)
- American: 64 (15.2%)
- Irish: 53 (12.6%)
- Italian: 28 (6.6%)
- French: 18 (4.3%)
- French Canadian: 18 (4.3%)
- English: 17 (4.0%)
- Dutch: 13 (3.1%)
- Polish: 12 (2.8%)
- Scottish: 10 (2.4%)
- Lithuanian: 8 (1.9%)
- British: 5 (1.2%)
- Finnish: 3 (0.7%)
- European: 2 (0.5%)
- Hungarian: 2 (0.5%)
- Swedish: 2 (0.5%)
- Norwegian: 1 (0.2%)
Most common places of birth for foreign-born residents (%):
| Petersburg: | 66.7% (6) |
| Michigan: | 5.0% (35,052) |
| Petersburg: | 22.2% (2) |
| Michigan: | 1.1% (7,792) |
Place of birth for U.S.-born residents:
- This state: 753
- Other state: 393
- Northeast: 42
- Midwest: 283
- South: 45
- West: 16
86.8% of Petersburg residents lived in the same house 1 years ago.
Out of people who lived in different houses, 45.8% lived in this county.
Out of people who lived in different counties, 73.1% lived in Michigan.
| Petersburg: | 86.8% |
| State average: | 88.4% |
Education attainment for males 25 years and older:
- No schooling: 0
- Nursery to 4th grade: 0
- 5th and 6th grade: 0
- 7th and 8th grade: 1
- 9th grade: 1
- 10th grade: 15
- 11th grade: 11
- 12th grade, no diploma: 9
- High school graduate (or equivalency): 152
- Less than 1 year of college: 32
- Some college more than 1 year, no degree: 40
- Associate degree: 29
- Bachelor's degree: 44
- Master's degree: 9
- Professional school degree: 0
- Doctorate degree: 0

Education attainment for females 25 years and older:
- No schooling: 0
- Nursery to 4th grade: 0
- 5th and 6th grade: 0
- 7th and 8th grade: 0
- 9th grade: 8
- 10th grade: 0
- 11th grade: 3
- 12th grade, no diploma: 4
- High school graduate (or equivalency): 126
- Less than 1 year of college: 65
- Some college more than 1 year, no degree: 75
- Associate degree: 45
- Bachelor's degree: 59
- Master's degree: 32
- Professional school degree: 2
- Doctorate degree: 0


Housing units in structures:
- One, detached: 418
- One, attached: 7
- Two: 14
- 3 or 4: 4
- 5 to 9: 10
- 20 to 49: 3
House/condo owner moved in on average 14 years ago
Renter moved in on average 5 years ago

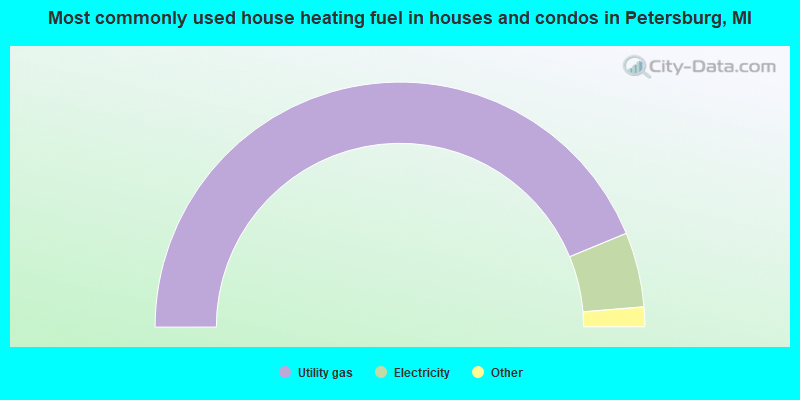
- 87.6%Utility gas
- 9.9%Electricity
- 0.8%Bottled, tank, or LP gas
- 0.8%Fuel oil, kerosene, etc.
- 0.8%Wood
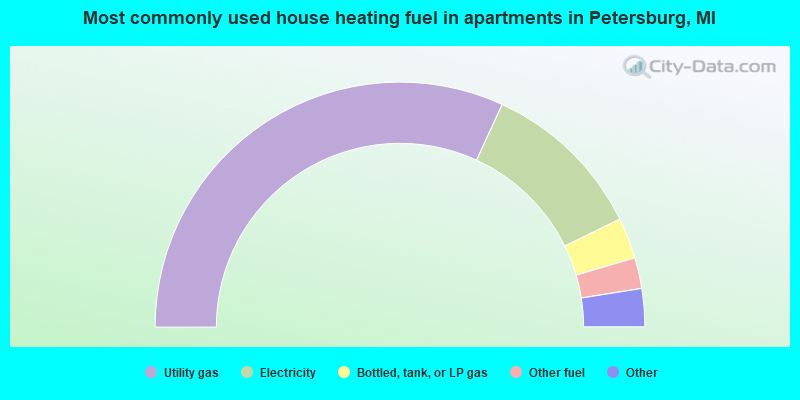
- 67.1%Utility gas
- 22.9%Electricity
- 5.7%Bottled, tank, or LP gas
- 4.3%Other fuel
Private vs. public school enrollment:
| Here: | 0.0% |
| Michigan: | 12.4% |
| Here: | 0.0% |
| Michigan: | 9.8% |
| Here: | 0.0% |
| Michigan: | 14.9% |


