Pico Rivera, CA (California) Houses and Residents
Estimated median house or condo value in 2022: $656,297 (it was $165,700 in 2000 )
Pico Rivera:
$656,297California:
$715,900
Lower value quartile - upper value quartile: $534,454 - $762,187Mean price in 2022: Detached houses: $656,802 Here:
$656,802State:
$988,808
Townhouses or other attached units: $570,562 Here:
$570,562State:
$838,546
In 2-unit structures: $572,386 Here:
$572,386State:
$1,138,100
In 3-to-4-unit structures: $939,819 Here:
$939,819State:
$824,253
In 5-or-more-unit structures: $362,160 Here:
$362,160State:
$730,996
Mobile homes: $206,240 Here:
$206,240State:
$184,506
Total population: 64,235 (Urban population: 63,151, Rural population: 0)
Houses: 17,308 (16,861 occupied: 11,656 owner occupied, 5,269 renter occupied )
% of renters here:
31%State:
44%
Housing density: 2,086 houses/condos per square mile
Median price asked for vacant for-sale houses and condos in 2022: $712,415.
Median contract rent in 2022: $1,554 (lower quartile is $1,155, upper quartile is $1,931)
Median rent asked for vacant for-rent units in 2022: $1,838
Median gross rent in Pico Rivera, CA in 2022: $1,702
Housing units in Pico Rivera with a mortgage: 7,184 (430 second mortgage, 14 home equity loan, 237 both second mortgage and home equity loan )Houses without a mortgage: 91
Median household income for houses/condos with a mortgage: $111,649
Median household income for apartments without a mortgage: $69,431
Median monthly housing costs: $1,747
Data:
Median house or condo value ($)
Median house or condo value ($ change since 2000)
Median house or condo value ($) - White
Median house or condo value ($) - Black or African American
Median house or condo value ($) - Asian
Median house or condo value ($) - Hispanic or Latino
Median house or condo value ($) - American Indian and Alaska Native
Median house or condo value ($) - Multirace
Median house or condo value ($) - Other Race
Median price asked for mobile homes ($)
Household density (households per square mile)
Mean house or condo value by units in structure - 1, detached ($)
Mean house or condo value by units in structure - 1, attached ($)
Mean house or condo value by units in structure - 2 ($)
Mean house or condo value by units in structure by units in structure - 3 or 4 ($)
Mean house or condo value by units in structure - 5 or more ($)
Mean house or condo value by units in structure - Boat, RV, van, etc. ($)
Mean house or condo value by units in structure - Mobile home ($)
Median contract rent ($)
Median contract rent - Lower quartile ($)
Median contract rent - Upper quartile ($)
Median gross rent ($)
Urban houses (%)
Rural houses (%)
Houses occupied (%)
Houses occupied (% change since 2000)
Houses owner occupied (%)
Houses owner occupied (% change since 2000)
Houses renter occupied (%)
Houses renter occupied (% change since 2000)
Vacant housing units - For rent (%)
Vacant housing units - For rent (% change since 2000)
Vacant housing units - For sale only (%)
Vacant housing units - For sale only (% change since 2000)
Vacant housing units - Rented or sold, not occupied (%)
Vacant housing units - Rented or sold, not occupied (% change since 2000)
Vacant housing units - For seasonal, recreational, or occasional use (%)
Vacant housing units - For seasonal, recreational, or occasional use (% change since 2000)
Vacant housing units - For migrant workers (%)
Vacant housing units - For migrant workers (% change since 2000)
Vacant housing units - Other vacant (%)
Vacant housing units - Other vacant (% change since 2000)
Median monthly housing costs ($)
Median household income for houses/condos with a mortgage ($)
Median household income for houses/condos without a mortgage ($)
Median household income ($)
Median household income ($) - White
Median household income ($) - Black or African American
Median household income ($) - Asian
Median household income ($) - Hispanic or Latino
Median household income ($) - American Indian and Alaska Native
Median household income ($) - Multirace
Median household income ($) - Other Race
Mortgage status - with mortgage (%)
Mortgage status - with second mortgage (%)
Mortgage status - with home equity loan (%)
Mortgage status - with both second mortgage and home equity loan (%)
Mortgage status - without a mortgage (%)
Median year house/condo built
Median year apartment built
Household type by relationship - Male householder living alone (%)
Household type by relationship - Male householder not living alone (%)
Household type by relationship - Female householder living alone (%)
Household type by relationship - Female householder not living alone (%)
Household type by relationship - Opposite-Sex spouse (%)
Household type by relationship - Same-Sex spouse (%)
Household type by relationship - Opposite-Sex unmarried partner (%)
Household type by relationship - Same-Sex unmarried partner (%)
Household type by relationship - In group quarters (%)
Size of family households - 2-person household (%)
Size of family households - 3-person household (%)
Size of family households - 4-person household (%)
Size of family households - 5-person household (%)
Size of family households - 6-person household (%)
Size of family households - 7-or-more-person household (%)
Size of nonfamily households - 1-person household (%)
Size of nonfamily households - 2-person household (%)
Size of nonfamily households - 3-person household (%)
Size of nonfamily households - 4-person household (%)
Size of nonfamily households - 5-person household (%)
Size of nonfamily households - 6-person household (%)
Size of nonfamily households - 7-or-moreperson household (%)
Year house built - Built 2010 or later (%)
Year house built - Built 2000 to 2009 (%)
Year house built - Built 1990 to 1999 (%)
Year house built - Built 1980 to 1989 (%)
Year house built - Built 1970 to 1979 (%)
Year house built - Built 1960 to 1969 (%)
Year house built - Built 1950 to 1959 (%)
Year house built - Built 1940 to 1949 (%)
Year house built - Built 1939 or earlier (%)
Median number of rooms in houses and condos
Median number of rooms in apartments
Median number of bedrooms in owner occupied houses
Mean number of bedrooms in owner occupied houses
Median number of bedrooms in renter occupied houses
Mean number of bedrooms in renter occupied houses
Median number of vehichles in owner occupied houses
Mean number of vehichles in owner occupied houses
Median number of vehichles in renter occupied houses
Mean number of vehichles in renter occupied houses
Rooms in owner-occupied houses - 1 room (%)
Rooms in owner-occupied houses - 2 rooms (%)
Rooms in owner-occupied houses - 3 rooms (%)
Rooms in owner-occupied houses - 4 rooms (%)
Rooms in owner-occupied houses - 5 rooms (%)
Rooms in owner-occupied houses - 6 rooms (%)
Rooms in owner-occupied houses - 7 rooms (%)
Rooms in owner-occupied houses - 8 rooms (%)
Rooms in owner-occupied houses - 9+ rooms (%)
Rooms in renter-occupied houses - 1 room (%)
Rooms in renter-occupied houses - 2 rooms (%)
Rooms in renter-occupied houses - 3 rooms (%)
Rooms in renter-occupied houses - 4 rooms (%)
Rooms in renter-occupied houses - 5 rooms (%)
Rooms in renter-occupied houses - 6 rooms (%)
Rooms in renter-occupied houses - 7 rooms (%)
Rooms in renter-occupied houses - 8 rooms (%)
Rooms in renter-occupied houses - 9+ rooms (%)
Bedrooms in owner-occupied houses - no bedrooms (%)
Bedrooms in owner-occupied houses - 1 bedroom (%)
Bedrooms in owner-occupied houses - 2 bedrooms (%)
Bedrooms in owner-occupied houses - 3 bedrooms (%)
Bedrooms in owner-occupied houses - 4 bedrooms (%)
Bedrooms in owner-occupied houses - 5+ bedrooms (%)
Bedrooms in renter-occupied houses - no bedrooms (%)
Bedrooms in renter-occupied houses - 1 bedroom (%)
Bedrooms in renter-occupied houses - 2 bedrooms (%)
Bedrooms in renter-occupied houses - 3 bedrooms (%)
Bedrooms in renter-occupied houses - 4 bedrooms (%)
Bedrooms in renter-occupied houses - 5+ bedrooms (%)
Vehicles available in owner-occupied houses - no vehicle available (%)
Vehicles available in owner-occupied houses - 1 vehicle available(%)
Vehicles available in owner-occupied houses - 2 Vehicles available (%)
Vehicles available in owner-occupied houses - 3 Vehicles available (%)
Vehicles available in owner-occupied houses - 4 Vehicles available (%)
Vehicles available in owner-occupied houses - 5+ Vehicles available (%)
Vehicles available in renter-occupied houses - no vehicle available (%)
Vehicles available in renter-occupied houses - 1 vehicle available (%)
Vehicles available in renter-occupied houses - 2 Vehicles available (%)
Vehicles available in renter-occupied houses - 3 Vehicles available (%)
Vehicles available in renter-occupied houses - 4 Vehicles available (%)
Vehicles available in renter-occupied houses - 5+ Vehicles available (%)
Housing units in structures - 1, detached (%)
Housing units in structures - 1, attached (%)
Housing units in structures - 2 (%)
Housing units in structures - 3 or 4 (%)
Housing units in structures - 5 to 9 (%)
Housing units in structures - 10 to 19 (%)
Housing units in structures - 20 to 49 (%)
Housing units in structures - 50 or more (%)
Housing units in structures - Mobile home (%)
Housing units in structures - Boat, RV, van, etc. (%)
Housing units in structures - Owners - 1, detached (%)
Housing units in structures - Owners - 1, attached (%)
Housing units in structures - Owners - 2 (%)
Housing units in structures - Owners - 3 or 4 (%)
Housing units in structures - Owners - 5 to 9 (%)
Housing units in structures - Owners - 10 to 19 (%)
Housing units in structures - Owners - 20 to 49 (%)
Housing units in structures - Owners - 50 or more (%)
Housing units in structures - Owners - Mobile home (%)
Housing units in structures - Owners - Boat, RV, van, etc. (%)
Housing units in structures - Renters - 1, detached (%)
Housing units in structures - Renters - 1, attached (%)
Housing units in structures - Renters - 2 (%)
Housing units in structures - Renters - 3 or 4 (%)
Housing units in structures - Renters - 5 to 9 (%)
Housing units in structures - Renters - 10 to 19 (%)
Housing units in structures - Renters - 20 to 49 (%)
Housing units in structures - Renters - 50 or more (%)
Housing units in structures - Renters - Mobile home (%)
Housing units in structures - Renters - Boat, RV, van, etc. (%)
House/condo owner moved in on average (years ago)
Renter moved in on average (years ago)
Year householder moved into unit - Moved in 1999 to March 2000 (%)
Year householder moved into unit - Moved in 1999 to March 2000 (%) - White
Year householder moved into unit - Moved in 1999 to March 2000 (%) - Black or African American
Year householder moved into unit - Moved in 1999 to March 2000 (%) - Asian
Year householder moved into unit - Moved in 1999 to March 2000 (%) - Hispanic or Latino
Year householder moved into unit - Moved in 1999 to March 2000 (%) - American Indian and Alaska Native
Year householder moved into unit - Moved in 1999 to March 2000 (%) - Multirace
Year householder moved into unit - Moved in 1999 to March 2000 (%) - Other Race
Year householder moved into unit - Moved in 1995 to 1998 (%)
Year householder moved into unit - Moved in 1995 to 1998 (%) - White
Year householder moved into unit - Moved in 1995 to 1998 (%) - Black or African American
Year householder moved into unit - Moved in 1995 to 1998 (%) - Asian
Year householder moved into unit - Moved in 1995 to 1998 (%) - Hispanic or Latino
Year householder moved into unit - Moved in 1995 to 1998 (%) - American Indian and Alaska Native
Year householder moved into unit - Moved in 1995 to 1998 (%) - Multirace
Year householder moved into unit - Moved in 1995 to 1998 (%) - Other Race
Year householder moved into unit - Moved in 1990 to 1994 (%)
Year householder moved into unit - Moved in 1990 to 1994 (%) - White
Year householder moved into unit - Moved in 1990 to 1994 (%) - Black or African American
Year householder moved into unit - Moved in 1990 to 1994 (%) - Asian
Year householder moved into unit - Moved in 1990 to 1994 (%) - Hispanic or Latino
Year householder moved into unit - Moved in 1990 to 1994 (%) - American Indian and Alaska Native
Year householder moved into unit - Moved in 1990 to 1994 (%) - Multirace
Year householder moved into unit - Moved in 1990 to 1994 (%) - Other Race
Year householder moved into unit - Moved in 1980 to 1989 (%)
Year householder moved into unit - Moved in 1980 to 1989 (%) - White
Year householder moved into unit - Moved in 1980 to 1989 (%) - Black or African American
Year householder moved into unit - Moved in 1980 to 1989 (%) - Asian
Year householder moved into unit - Moved in 1980 to 1989 (%) - Hispanic or Latino
Year householder moved into unit - Moved in 1980 to 1989 (%) - American Indian and Alaska Native
Year householder moved into unit - Moved in 1980 to 1989 (%) - Multirace
Year householder moved into unit - Moved in 1980 to 1989 (%) - Other Race
Year householder moved into unit - Moved in 1970 to 1979 (%)
Year householder moved into unit - Moved in 1970 to 1979 (%) - White
Year householder moved into unit - Moved in 1970 to 1979 (%) - Black or African American
Year householder moved into unit - Moved in 1970 to 1979 (%) - Asian
Year householder moved into unit - Moved in 1970 to 1979 (%) - Hispanic or Latino
Year householder moved into unit - Moved in 1970 to 1979 (%) - American Indian and Alaska Native
Year householder moved into unit - Moved in 1970 to 1979 (%) - Multirace
Year householder moved into unit - Moved in 1970 to 1979 (%) - Other Race
Year householder moved into unit - Moved in 1969 or earlier (%)
Year householder moved into unit - Moved in 1969 or earlier (%) - White
Year householder moved into unit - Moved in 1969 or earlier (%) - Black or African American
Year householder moved into unit - Moved in 1969 or earlier (%) - Asian
Year householder moved into unit - Moved in 1969 or earlier (%) - Hispanic or Latino
Year householder moved into unit - Moved in 1969 or earlier (%) - American Indian and Alaska Native
Year householder moved into unit - Moved in 1969 or earlier (%) - Multirace
Year householder moved into unit - Moved in 1969 or earlier (%) - Other Race
Housing units lacking complete plumbing facilities (%)
Housing units lacking complete kitchen facilities (%)
House heating fuel used in houses and condos - Utility gas (%)
House heating fuel used in houses and condos - Bottled, tank, or LP gas (%)
House heating fuel used in houses and condos - Electricity (%)
House heating fuel used in houses and condos - Fuel oil, kerosene, etc. (%)
House heating fuel used in houses and condos - Coal or coke (%)
House heating fuel used in houses and condos - Wood (%)
House heating fuel used in houses and condos - Solar energy (%)
House heating fuel used in houses and condos - Other fuel (%)
House heating fuel used in houses and condos - No fuel used (%)
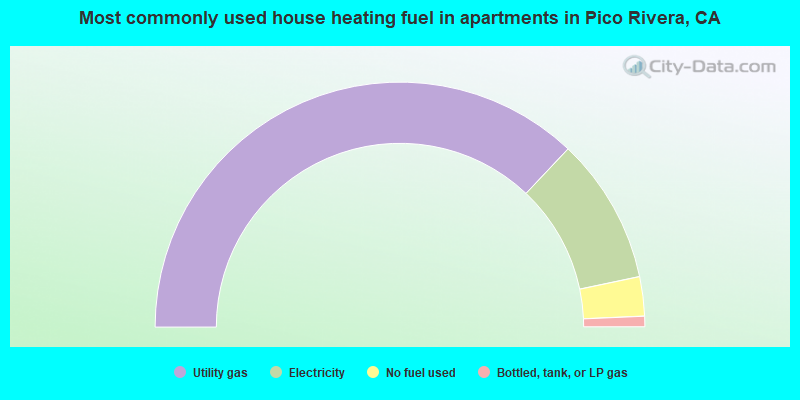
House heating fuel used in apartments - Utility gas (%)
House heating fuel used in apartments - Bottled, tank, or LP gas (%)
House heating fuel used in apartments - Electricity (%)
House heating fuel used in apartments - Fuel oil, kerosene, etc. (%)
House heating fuel used in apartments - Coal or coke (%)
House heating fuel used in apartments - Wood (%)
House heating fuel used in apartments - Solar energy (%)
House heating fuel used in apartments - Other fuel (%)
House heating fuel used in apartments - No fuel used (%)
Median year house/condo built: 1955Median year apartment built: 1964Household type by relationship:
Households: 60,225
Male householders: 8,657 (988 living alone ), Female householders: 7,646 (1,602 living alone )8,701 spouses (8,638 opposite-sex spouses ), 1,162 unmarried partners , (1,141 opposite-sex unmarried partners ), 18,893 children (17,938 natural , 305 adopted , 649 stepchildren ), 3,495 grandchildren , 1,716 brothers or sisters , 2,258 parents , 142 foster children , 4,616 other relatives , 2,435 non-relatives In group quarters: 498
Size of family households: 3,372 2-persons , 2,952 3-persons , 2,884 4-persons , 1,852 5-persons , 793 6-persons , 1,336 7-or-more-persons .
Size of nonfamily households: 2,778 1-person , 599 2-persons , 126 3-persons , 22 4-persons , 11 7-or-more-persons .
5,461 married couples with children. single-parent households (697 men , 1,602 women ).
35.1% of residents of Pico Rivera speak English at home. of residents speak Spanish at home (65% speak English very well , 15% speak English well , 14% speak English not well , 6% don't speak English at all ).of residents speak other Indo-European language at home (79% speak English very well , 18% speak English well , 4% speak English not well ).of residents speak Asian or Pacific Island language at home (46% speak English very well , 29% speak English well , 17% speak English not well , 7% don't speak English at all ).of residents speak other language at home (100% speak English very well ).
Foreign born population: 18,156 (30.1%)of them are naturalized citizens )
Median number of rooms in houses and condos:
Median number of rooms in apartments
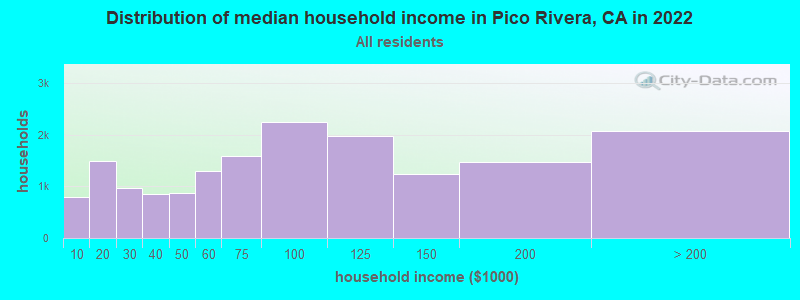
Pico Rivera, CA household income distribution 793 Less than $10,0001,498 $10,000 to $19,999959 $20,000 to $29,999844 $30,000 to $39,999862 $40,000 to $49,9991,294 $50,000 to $59,9991,594 $60,000 to $74,9992,247 $75,000 to $99,9991,980 $100,000 to $124,9991,245 $125,000 to $149,9991,481 $150,000 to $199,9992,068 $200,000 or more
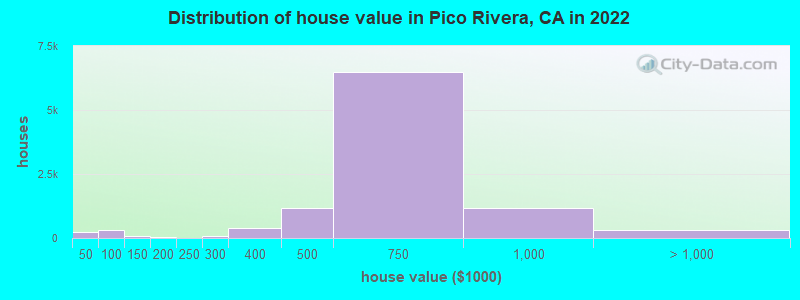
Home value of owner - occupied houses in 2022 in Pico Rivera, CA 140 Less than $10,00017 $15,000 to $19,99924 $30,000 to $34,99938 $40,000 to $49,99976 $50,000 to $59,99984 $60,000 to $69,99954 $70,000 to $79,99921 $80,000 to $89,99933 $90,000 to $99,99985 $100,000 to $124,9995 $125,000 to $149,99925 $150,000 to $174,99916 $200,000 to $249,99990 $250,000 to $299,999380 $300,000 to $399,9991,184 $400,000 to $499,9996,493 $500,000 to $749,9991,174 $750,000 to $999,99986 $1,000,000 to $1,499,99921 $1,500,000 to $1,999,999223 $2,000,000 or moreRent paid by renters in 2022 in Pico Rivera, CA 13 $100 to $149172 $200 to $249184 $250 to $29911 $300 to $34928 $350 to $39910 $400 to $44947 $450 to $49939 $500 to $54923 $550 to $5998 $650 to $69918 $700 to $74934 $750 to $799177 $800 to $899193 $900 to $999521 $1,000 to $1,249856 $1,250 to $1,4991,740 $1,500 to $1,999660 $2,000 to $2,499292 $2,500 to $2,99948 $3,000 to $3,49910 $3,500 or more258 No cash rent
Percentage of workers working in this county: 87.8%Number of people working at home: 2,591 (8.9% of all workers )
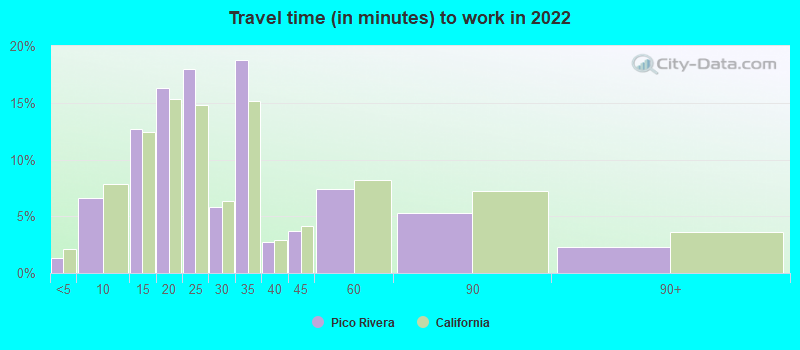
Travel time to work (commute)
Less than 5 minutes: 2055 to 9 minutes: 1,45310 to 14 minutes: 2,71315 to 19 minutes: 3,34320 to 24 minutes: 3,85725 to 29 minutes: 1,45130 to 34 minutes: 4,91235 to 39 minutes: 80540 to 44 minutes: 1,26345 to 59 minutes: 2,73860 to 89 minutes: 2,33790 or more minutes: 664
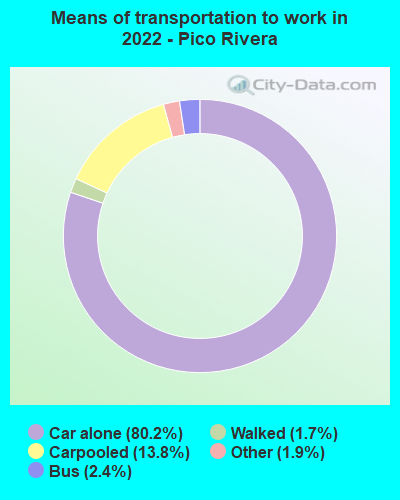
Means of transportation to work:
Drove a car alone: 12,334 (67.7%)Carpooled: 2,344 (12.9%)Bus : 338 (1.9%)Taxi: 313 (1.7%)Bicycle: 6 (0.0%)Walked: 278 (1.5%)Worked at home: 2,591 (14.2%)
Unemployment by race in 2022
Unemployment rate for White non-Hispanic residents 5.8% Males3.9% FemalesUnemployment rate for Black residents 1.4% MalesUnemployment rate for American Indian and Alaska Native residents 5.4% Males15.6% FemalesUnemployment rate for Asian residents 6.2% FemalesUnemployment rate for other race residents 1.9% Males4.1% FemalesUnemployment rate for two or more race residents 6.1% Males3.6% FemalesUnemployment rate for Hispanic or Latino residents 3.5% Males4.3% Females
Year of entry for the foreign-born population in Pico Rivera, California
1,424 2010 or later 2,245 2000 to 2009 3,536 1990 to 1999 6,417 1980 to 1989 5,352 1970 to 1979 4,385 Before 1970
First ancestries reported:
American: 1,439 (3.4%)
English: 221 (0.5%)
German: 140 (0.3%)
Irish: 114 (0.3%)
European: 90 (0.2%)
Italian: 76 (0.2%)
Afghan: 44 (0.1%)
British: 35 (0.08%)
Egyptian: 31 (0.07%)
Greek: 28 (0.07%)
Brazilian: 23 (0.05%)
African: 21 (0.05%)
Scottish: 17 (0.04%)
Portuguese: 16 (0.04%)
Russian: 16 (0.04%)
Nigerian: 12 (0.03%)
Latvian: 11 (0.03%)
Welsh: 10 (0.02%)
Austrian: 8 (0.02%)
Lebanese: 7 (0.02%)
Polish: 7 (0.02%)
Dutch: 6 (0.01%)
Ukrainian: 6 (0.01%)
Armenian: 5 (0.01%)
French: 5 (0.01%)
Scandinavian: 5 (0.01%)
Canadian: 4 (0.01%)
Pennsylvania German: 4 (0.01%)
Swedish: 4 (0.01%) Most common places of birth for foreign-born residents (%): Mexico Pico Rivera:
74.5% (13,533)California:
37.2% (3,881,193)
El Salvador Pico Rivera:
8.2% (1,486)California:
4.2% (440,287)
Philippines Pico Rivera:
3.0% (548)California:
7.8% (818,297)
Guatemala Pico Rivera:
2.4% (436)California:
2.8% (290,436)
Vietnam Pico Rivera:
2.1% (385)California:
4.9% (512,335)
Place of birth for U.S.-born residents:
This state: 39,119Other state: 2,492Northeast: 261Midwest: 328South: 1,081West: 787 96.0% of Pico Rivera residents lived in the same house 1 years ago.
Out of people who lived in different houses, 41.9% lived in this county.
Out of people who lived in different counties, 83.3% lived in California.
Pico Rivera:
96.0%State average:
88.9%
Education attainment for males 25 years and older:
No schooling: 1,546Nursery to 4th grade: 4155th and 6th grade: 9357th and 8th grade: 5439th grade: 37710th grade: 34711th grade: 52612th grade, no diploma: 1,303High school graduate (or equivalency): 6,630Less than 1 year of college: 927Some college more than 1 year, no degree: 2,785Associate degree: 1,394Bachelor's degree: 2,377Master's degree: 438Professional school degree: 194Doctorate degree: 83
Education attainment for females 25 years and older:
No schooling: 1,605Nursery to 4th grade: 6255th and 6th grade: 1,1897th and 8th grade: 4689th grade: 28310th grade: 28211th grade: 51812th grade, no diploma: 800High school graduate (or equivalency): 6,580Less than 1 year of college: 1,014Some college more than 1 year, no degree: 2,850Associate degree: 1,530Bachelor's degree: 2,187Master's degree: 765Professional school degree: 118Doctorate degree: 82
Housing units in structures:
One, detached: 12,927One, attached: 738Two: 1233 or 4: 4375 to 9: 18010 to 19: 33020 to 49: 84350 or more: 1,273Mobile homes: 453Median worth of mobile homes: $119,040
Housing units lacking complete plumbing facilities in 2022: 0.2%Housing units lacking complete kitchen facilities in 2022: 1.8%House/condo owner moved in on average 21 years ago
Renter moved in on average 7 years ago
Private vs. public school enrollment:
Students in private schools in grades 1 to 8 (elementary and middle school): 478 Here:
9.1%California:
10.5%
Students in private schools in grades 9 to 12 (high school): 252 Students in private undergraduate colleges: 391 Here:
10.0%California:
15.9%