Pikesville, MD (Maryland) Houses and Residents
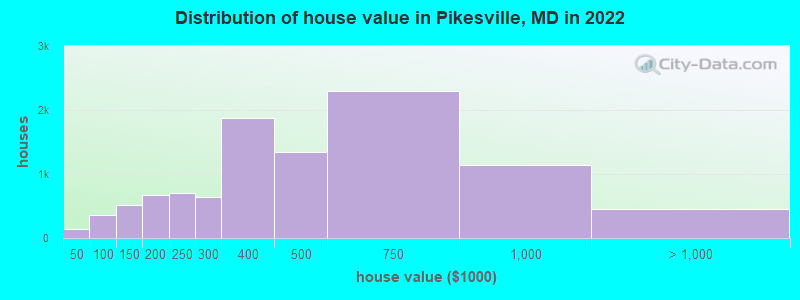
Estimated median house or condo value in 2022: $421,438 (it was $152,200 in 2000 )
Pikesville:
$421,438Maryland:
$398,100
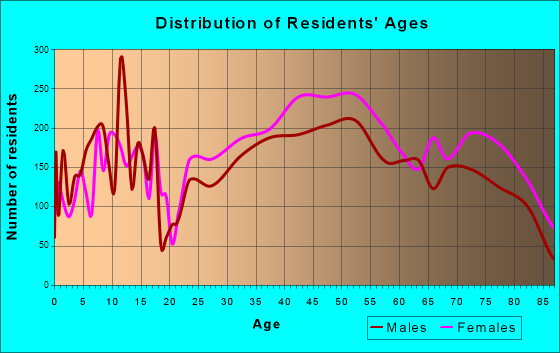
Lower value quartile - upper value quartile: $252,966 - $645,939Total population: 30,764 (Urban population: 28,936, Rural population: 0)
Houses: 14,577 (13,745 occupied: 9,579 owner occupied, 4,473 renter occupied )
% of renters here:
32%State:
32%
Housing density: 1,175 houses/condos per square mile
Median price asked for vacant for-sale houses and condos in 2022: $238,415.
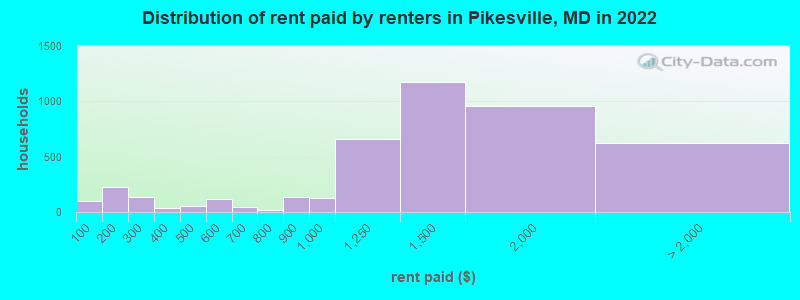
Median contract rent in 2022: $1,363 (lower quartile is $1,048, upper quartile is $1,709)
Median rent asked for vacant for-rent units in 2022: $1,194
Median gross rent in Pikesville, MD in 2022: $1,545
Housing units in Pikesville with a mortgage: 5,644 (791 second mortgage, 19 home equity loan, 504 both second mortgage and home equity loan )Houses without a mortgage: 181
Median household income for houses/condos with a mortgage: $132,043
Median household income for apartments without a mortgage: $102,597
Median monthly housing costs: $1,516
Data:
Median house or condo value ($)
Median house or condo value ($ change since 2000)
Median house or condo value ($) - White
Median house or condo value ($) - Black or African American
Median house or condo value ($) - Asian
Median house or condo value ($) - Hispanic or Latino
Median house or condo value ($) - American Indian and Alaska Native
Median house or condo value ($) - Multirace
Median house or condo value ($) - Other Race
Median price asked for mobile homes ($)
Household density (households per square mile)
Mean house or condo value by units in structure - 1, detached ($)
Mean house or condo value by units in structure - 1, attached ($)
Mean house or condo value by units in structure - 2 ($)
Mean house or condo value by units in structure by units in structure - 3 or 4 ($)
Mean house or condo value by units in structure - 5 or more ($)
Mean house or condo value by units in structure - Boat, RV, van, etc. ($)
Mean house or condo value by units in structure - Mobile home ($)
Median contract rent ($)
Median contract rent - Lower quartile ($)
Median contract rent - Upper quartile ($)
Median gross rent ($)
Urban houses (%)
Rural houses (%)
Houses occupied (%)
Houses occupied (% change since 2000)
Houses owner occupied (%)
Houses owner occupied (% change since 2000)
Houses renter occupied (%)
Houses renter occupied (% change since 2000)
Vacant housing units - For rent (%)
Vacant housing units - For rent (% change since 2000)
Vacant housing units - For sale only (%)
Vacant housing units - For sale only (% change since 2000)
Vacant housing units - Rented or sold, not occupied (%)
Vacant housing units - Rented or sold, not occupied (% change since 2000)
Vacant housing units - For seasonal, recreational, or occasional use (%)
Vacant housing units - For seasonal, recreational, or occasional use (% change since 2000)
Vacant housing units - For migrant workers (%)
Vacant housing units - For migrant workers (% change since 2000)
Vacant housing units - Other vacant (%)
Vacant housing units - Other vacant (% change since 2000)
Median monthly housing costs ($)
Median household income for houses/condos with a mortgage ($)
Median household income for houses/condos without a mortgage ($)
Median household income ($)
Median household income ($) - White
Median household income ($) - Black or African American
Median household income ($) - Asian
Median household income ($) - Hispanic or Latino
Median household income ($) - American Indian and Alaska Native
Median household income ($) - Multirace
Median household income ($) - Other Race
Mortgage status - with mortgage (%)
Mortgage status - with second mortgage (%)
Mortgage status - with home equity loan (%)
Mortgage status - with both second mortgage and home equity loan (%)
Mortgage status - without a mortgage (%)
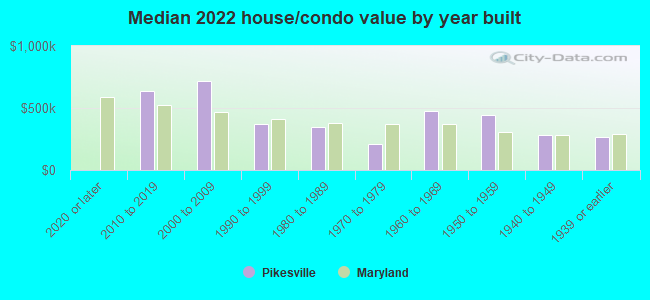
Median year house/condo built
Median year apartment built
Household type by relationship - Male householder living alone (%)
Household type by relationship - Male householder not living alone (%)
Household type by relationship - Female householder living alone (%)
Household type by relationship - Female householder not living alone (%)
Household type by relationship - Opposite-Sex spouse (%)
Household type by relationship - Same-Sex spouse (%)
Household type by relationship - Opposite-Sex unmarried partner (%)
Household type by relationship - Same-Sex unmarried partner (%)
Household type by relationship - In group quarters (%)
Size of family households - 2-person household (%)
Size of family households - 3-person household (%)
Size of family households - 4-person household (%)
Size of family households - 5-person household (%)
Size of family households - 6-person household (%)
Size of family households - 7-or-more-person household (%)
Size of nonfamily households - 1-person household (%)
Size of nonfamily households - 2-person household (%)
Size of nonfamily households - 3-person household (%)
Size of nonfamily households - 4-person household (%)
Size of nonfamily households - 5-person household (%)
Size of nonfamily households - 6-person household (%)
Size of nonfamily households - 7-or-moreperson household (%)
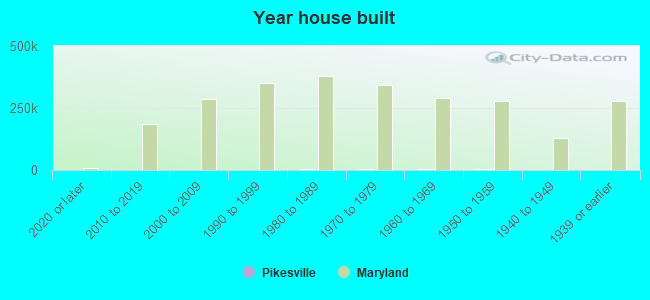
Year house built - Built 2010 or later (%)
Year house built - Built 2000 to 2009 (%)
Year house built - Built 1990 to 1999 (%)
Year house built - Built 1980 to 1989 (%)
Year house built - Built 1970 to 1979 (%)
Year house built - Built 1960 to 1969 (%)
Year house built - Built 1950 to 1959 (%)
Year house built - Built 1940 to 1949 (%)
Year house built - Built 1939 or earlier (%)
Median number of rooms in houses and condos
Median number of rooms in apartments
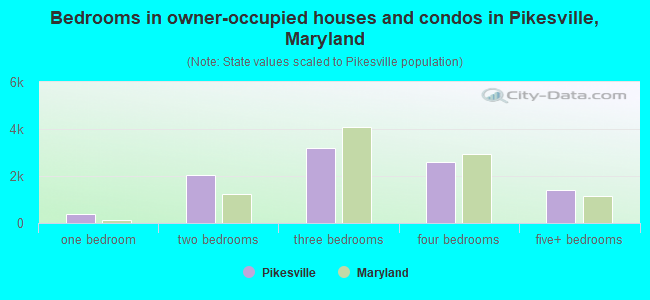
Median number of bedrooms in owner occupied houses
Mean number of bedrooms in owner occupied houses
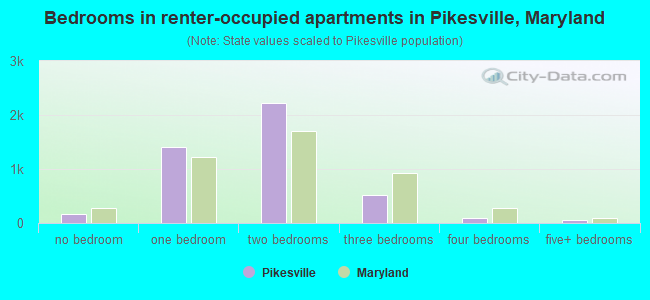
Median number of bedrooms in renter occupied houses
Mean number of bedrooms in renter occupied houses
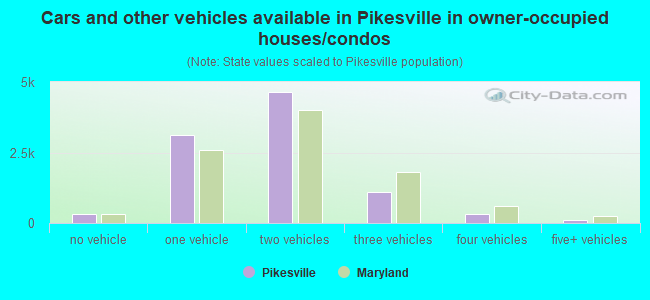
Median number of vehichles in owner occupied houses
Mean number of vehichles in owner occupied houses
Median number of vehichles in renter occupied houses
Mean number of vehichles in renter occupied houses
Rooms in owner-occupied houses - 1 room (%)
Rooms in owner-occupied houses - 2 rooms (%)
Rooms in owner-occupied houses - 3 rooms (%)
Rooms in owner-occupied houses - 4 rooms (%)
Rooms in owner-occupied houses - 5 rooms (%)
Rooms in owner-occupied houses - 6 rooms (%)
Rooms in owner-occupied houses - 7 rooms (%)
Rooms in owner-occupied houses - 8 rooms (%)
Rooms in owner-occupied houses - 9+ rooms (%)
Rooms in renter-occupied houses - 1 room (%)
Rooms in renter-occupied houses - 2 rooms (%)
Rooms in renter-occupied houses - 3 rooms (%)
Rooms in renter-occupied houses - 4 rooms (%)
Rooms in renter-occupied houses - 5 rooms (%)
Rooms in renter-occupied houses - 6 rooms (%)
Rooms in renter-occupied houses - 7 rooms (%)
Rooms in renter-occupied houses - 8 rooms (%)
Rooms in renter-occupied houses - 9+ rooms (%)
Bedrooms in owner-occupied houses - no bedrooms (%)
Bedrooms in owner-occupied houses - 1 bedroom (%)
Bedrooms in owner-occupied houses - 2 bedrooms (%)
Bedrooms in owner-occupied houses - 3 bedrooms (%)
Bedrooms in owner-occupied houses - 4 bedrooms (%)
Bedrooms in owner-occupied houses - 5+ bedrooms (%)
Bedrooms in renter-occupied houses - no bedrooms (%)
Bedrooms in renter-occupied houses - 1 bedroom (%)
Bedrooms in renter-occupied houses - 2 bedrooms (%)
Bedrooms in renter-occupied houses - 3 bedrooms (%)
Bedrooms in renter-occupied houses - 4 bedrooms (%)
Bedrooms in renter-occupied houses - 5+ bedrooms (%)
Vehicles available in owner-occupied houses - no vehicle available (%)
Vehicles available in owner-occupied houses - 1 vehicle available(%)
Vehicles available in owner-occupied houses - 2 Vehicles available (%)
Vehicles available in owner-occupied houses - 3 Vehicles available (%)
Vehicles available in owner-occupied houses - 4 Vehicles available (%)
Vehicles available in owner-occupied houses - 5+ Vehicles available (%)
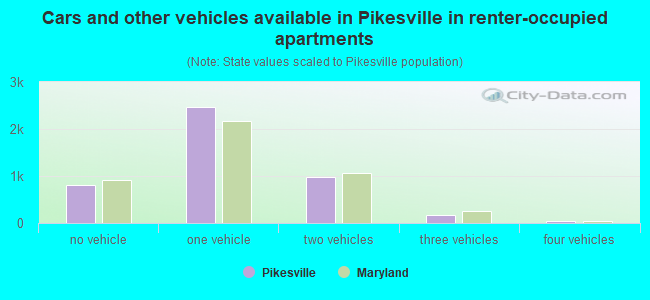
Vehicles available in renter-occupied houses - no vehicle available (%)
Vehicles available in renter-occupied houses - 1 vehicle available (%)
Vehicles available in renter-occupied houses - 2 Vehicles available (%)
Vehicles available in renter-occupied houses - 3 Vehicles available (%)
Vehicles available in renter-occupied houses - 4 Vehicles available (%)
Vehicles available in renter-occupied houses - 5+ Vehicles available (%)
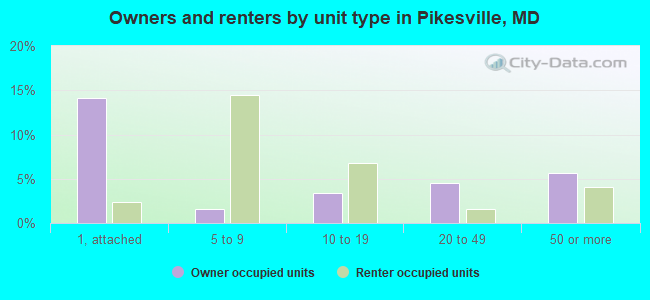
Housing units in structures - 1, detached (%)
Housing units in structures - 1, attached (%)
Housing units in structures - 2 (%)
Housing units in structures - 3 or 4 (%)
Housing units in structures - 5 to 9 (%)
Housing units in structures - 10 to 19 (%)
Housing units in structures - 20 to 49 (%)
Housing units in structures - 50 or more (%)
Housing units in structures - Mobile home (%)
Housing units in structures - Boat, RV, van, etc. (%)
Housing units in structures - Owners - 1, detached (%)
Housing units in structures - Owners - 1, attached (%)
Housing units in structures - Owners - 2 (%)
Housing units in structures - Owners - 3 or 4 (%)
Housing units in structures - Owners - 5 to 9 (%)
Housing units in structures - Owners - 10 to 19 (%)
Housing units in structures - Owners - 20 to 49 (%)
Housing units in structures - Owners - 50 or more (%)
Housing units in structures - Owners - Mobile home (%)
Housing units in structures - Owners - Boat, RV, van, etc. (%)
Housing units in structures - Renters - 1, detached (%)
Housing units in structures - Renters - 1, attached (%)
Housing units in structures - Renters - 2 (%)
Housing units in structures - Renters - 3 or 4 (%)
Housing units in structures - Renters - 5 to 9 (%)
Housing units in structures - Renters - 10 to 19 (%)
Housing units in structures - Renters - 20 to 49 (%)
Housing units in structures - Renters - 50 or more (%)
Housing units in structures - Renters - Mobile home (%)
Housing units in structures - Renters - Boat, RV, van, etc. (%)
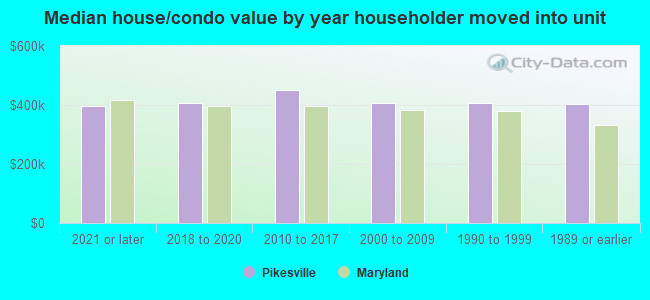
House/condo owner moved in on average (years ago)
Renter moved in on average (years ago)
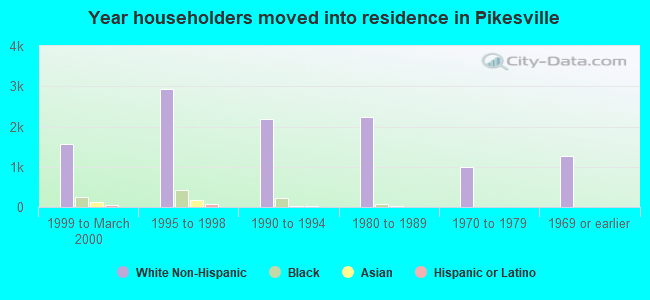
Year householder moved into unit - Moved in 1999 to March 2000 (%)
Year householder moved into unit - Moved in 1999 to March 2000 (%) - White
Year householder moved into unit - Moved in 1999 to March 2000 (%) - Black or African American
Year householder moved into unit - Moved in 1999 to March 2000 (%) - Asian
Year householder moved into unit - Moved in 1999 to March 2000 (%) - Hispanic or Latino
Year householder moved into unit - Moved in 1999 to March 2000 (%) - American Indian and Alaska Native
Year householder moved into unit - Moved in 1999 to March 2000 (%) - Multirace
Year householder moved into unit - Moved in 1999 to March 2000 (%) - Other Race
Year householder moved into unit - Moved in 1995 to 1998 (%)
Year householder moved into unit - Moved in 1995 to 1998 (%) - White
Year householder moved into unit - Moved in 1995 to 1998 (%) - Black or African American
Year householder moved into unit - Moved in 1995 to 1998 (%) - Asian
Year householder moved into unit - Moved in 1995 to 1998 (%) - Hispanic or Latino
Year householder moved into unit - Moved in 1995 to 1998 (%) - American Indian and Alaska Native
Year householder moved into unit - Moved in 1995 to 1998 (%) - Multirace
Year householder moved into unit - Moved in 1995 to 1998 (%) - Other Race
Year householder moved into unit - Moved in 1990 to 1994 (%)
Year householder moved into unit - Moved in 1990 to 1994 (%) - White
Year householder moved into unit - Moved in 1990 to 1994 (%) - Black or African American
Year householder moved into unit - Moved in 1990 to 1994 (%) - Asian
Year householder moved into unit - Moved in 1990 to 1994 (%) - Hispanic or Latino
Year householder moved into unit - Moved in 1990 to 1994 (%) - American Indian and Alaska Native
Year householder moved into unit - Moved in 1990 to 1994 (%) - Multirace
Year householder moved into unit - Moved in 1990 to 1994 (%) - Other Race
Year householder moved into unit - Moved in 1980 to 1989 (%)
Year householder moved into unit - Moved in 1980 to 1989 (%) - White
Year householder moved into unit - Moved in 1980 to 1989 (%) - Black or African American
Year householder moved into unit - Moved in 1980 to 1989 (%) - Asian
Year householder moved into unit - Moved in 1980 to 1989 (%) - Hispanic or Latino
Year householder moved into unit - Moved in 1980 to 1989 (%) - American Indian and Alaska Native
Year householder moved into unit - Moved in 1980 to 1989 (%) - Multirace
Year householder moved into unit - Moved in 1980 to 1989 (%) - Other Race
Year householder moved into unit - Moved in 1970 to 1979 (%)
Year householder moved into unit - Moved in 1970 to 1979 (%) - White
Year householder moved into unit - Moved in 1970 to 1979 (%) - Black or African American
Year householder moved into unit - Moved in 1970 to 1979 (%) - Asian
Year householder moved into unit - Moved in 1970 to 1979 (%) - Hispanic or Latino
Year householder moved into unit - Moved in 1970 to 1979 (%) - American Indian and Alaska Native
Year householder moved into unit - Moved in 1970 to 1979 (%) - Multirace
Year householder moved into unit - Moved in 1970 to 1979 (%) - Other Race
Year householder moved into unit - Moved in 1969 or earlier (%)
Year householder moved into unit - Moved in 1969 or earlier (%) - White
Year householder moved into unit - Moved in 1969 or earlier (%) - Black or African American
Year householder moved into unit - Moved in 1969 or earlier (%) - Asian
Year householder moved into unit - Moved in 1969 or earlier (%) - Hispanic or Latino
Year householder moved into unit - Moved in 1969 or earlier (%) - American Indian and Alaska Native
Year householder moved into unit - Moved in 1969 or earlier (%) - Multirace
Year householder moved into unit - Moved in 1969 or earlier (%) - Other Race
Housing units lacking complete plumbing facilities (%)
Housing units lacking complete kitchen facilities (%)
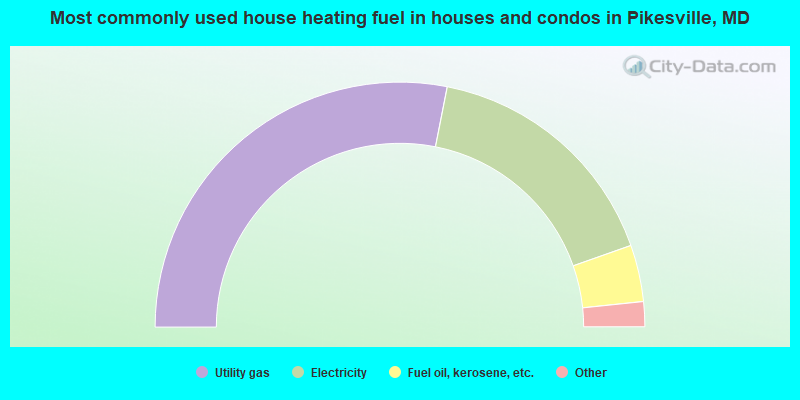
House heating fuel used in houses and condos - Utility gas (%)
House heating fuel used in houses and condos - Bottled, tank, or LP gas (%)
House heating fuel used in houses and condos - Electricity (%)
House heating fuel used in houses and condos - Fuel oil, kerosene, etc. (%)
House heating fuel used in houses and condos - Coal or coke (%)
House heating fuel used in houses and condos - Wood (%)
House heating fuel used in houses and condos - Solar energy (%)
House heating fuel used in houses and condos - Other fuel (%)
House heating fuel used in houses and condos - No fuel used (%)
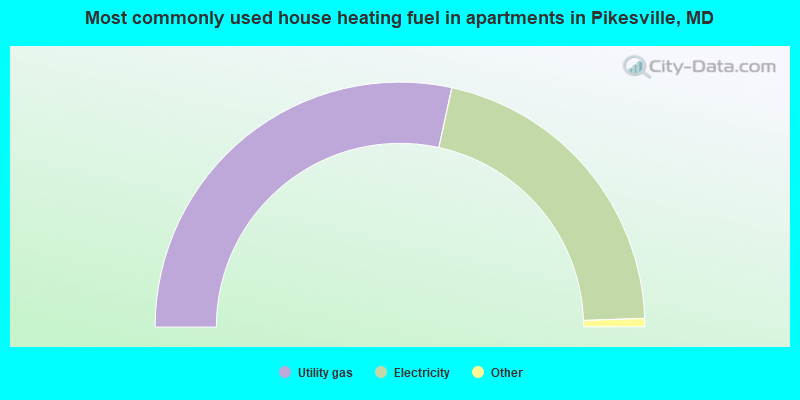
House heating fuel used in apartments - Utility gas (%)
House heating fuel used in apartments - Bottled, tank, or LP gas (%)
House heating fuel used in apartments - Electricity (%)
House heating fuel used in apartments - Fuel oil, kerosene, etc. (%)
House heating fuel used in apartments - Coal or coke (%)
House heating fuel used in apartments - Wood (%)
House heating fuel used in apartments - Solar energy (%)
House heating fuel used in apartments - Other fuel (%)
House heating fuel used in apartments - No fuel used (%)
Latest news about housing in Pikesville, MD collected exclusively by city-data.com from local newspapers, TV, and radio stations
Median year house/condo built: 1972Median year apartment built: 1977Household type by relationship:
Households: 33,917
Male householders: 6,536 (1,714 living alone ), Female householders: 7,070 (2,886 living alone )6,334 spouses (6,182 opposite-sex spouses ), 493 unmarried partners , (457 opposite-sex unmarried partners ), 11,090 children (10,837 natural , 104 adopted , 148 stepchildren ), 342 grandchildren , 108 brothers or sisters , 294 parents , 51 foster children , 186 other relatives , 989 non-relatives In group quarters: 418
Size of family households: 4,185 2-persons , 1,572 3-persons , 1,394 4-persons , 556 5-persons , 508 6-persons , 209 7-or-more-persons .
Size of nonfamily households: 4,792 1-person , 687 2-persons , 78 3-persons , 34 4-persons .
6,458 married couples with children. single-parent households (132 men , 1,405 women ).
81.9% of residents of Pikesville speak English at home. of residents speak Spanish at home (62% speak English very well , 14% speak English well , 19% speak English not well , 6% don't speak English at all ).of residents speak other Indo-European language at home (56% speak English very well , 29% speak English well , 14% speak English not well , 1% don't speak English at all ).of residents speak Asian or Pacific Island language at home (59% speak English very well , 35% speak English well , 6% speak English not well ).of residents speak other language at home (81% speak English very well , 18% speak English well , 1% speak English not well ).
Foreign born population: 4,938 (14.6%)of them are naturalized citizens )
Median number of rooms in houses and condos:
Median number of rooms in apartments
Owner-occupied Renter-occupied
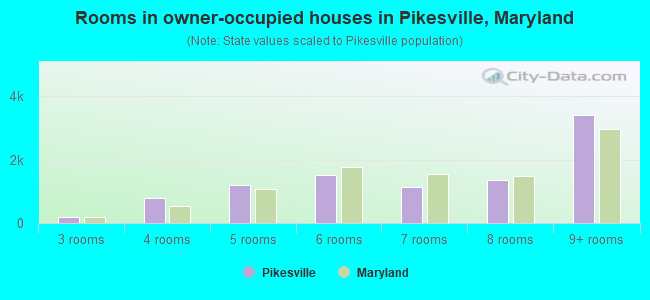
Rooms in owner-occupied houses in Pikesville, Maryland
0 1 room 3 2 rooms 201 3 rooms 791 4 rooms 1,185 5 rooms 1,518 6 rooms 1,120 7 rooms 1,356 8 rooms 3,405 9+ rooms
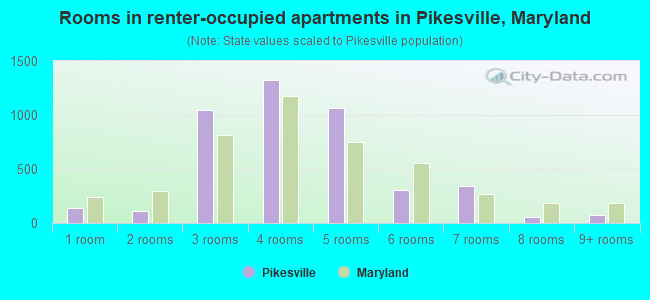
Rooms in renter-occupied apartments in Pikesville, Maryland
143 1 room 112 2 rooms 1,047 3 rooms 1,327 4 rooms 1,063 5 rooms 305 6 rooms 343 7 rooms 58 8 rooms 76 9+ rooms
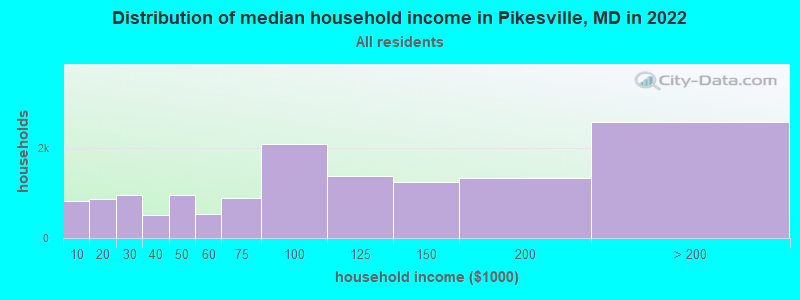
Pikesville, MD household income distribution 818 Less than $10,000866 $10,000 to $19,999947 $20,000 to $29,999503 $30,000 to $39,999944 $40,000 to $49,999541 $50,000 to $59,999878 $60,000 to $74,9992,088 $75,000 to $99,9991,384 $100,000 to $124,9991,240 $125,000 to $149,9991,335 $150,000 to $199,9992,574 $200,000 or more
Home value of owner - occupied houses in 2022 in Pikesville, MD 48 Less than $10,0008 $20,000 to $24,99943 $25,000 to $29,99932 $40,000 to $49,99941 $50,000 to $59,99926 $60,000 to $69,999121 $70,000 to $79,999101 $80,000 to $89,99935 $90,000 to $99,999398 $100,000 to $124,999110 $125,000 to $149,999465 $150,000 to $174,999201 $175,000 to $199,999709 $200,000 to $249,999646 $250,000 to $299,9991,868 $300,000 to $399,9991,337 $400,000 to $499,9992,297 $500,000 to $749,9991,144 $750,000 to $999,999223 $1,000,000 to $1,499,999166 $1,500,000 to $1,999,99960 $2,000,000 or moreRent paid by renters in 2022 in Pikesville, MD 96 Less than $10053 $100 to $149174 $150 to $19963 $200 to $24969 $250 to $29919 $300 to $34917 $350 to $3997 $400 to $44942 $450 to $499102 $500 to $54910 $550 to $59924 $600 to $64916 $650 to $6994 $700 to $74913 $750 to $799132 $800 to $899122 $900 to $999659 $1,000 to $1,2491,175 $1,250 to $1,499958 $1,500 to $1,999395 $2,000 to $2,49935 $2,500 to $2,99963 $3,500 or more124 No cash rent
Percentage of workers working in this county: 61.7%Number of people working at home: 4,191 (26.3% of all workers )
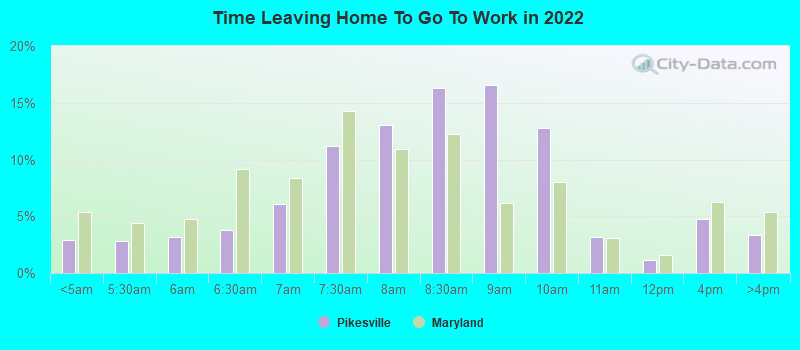
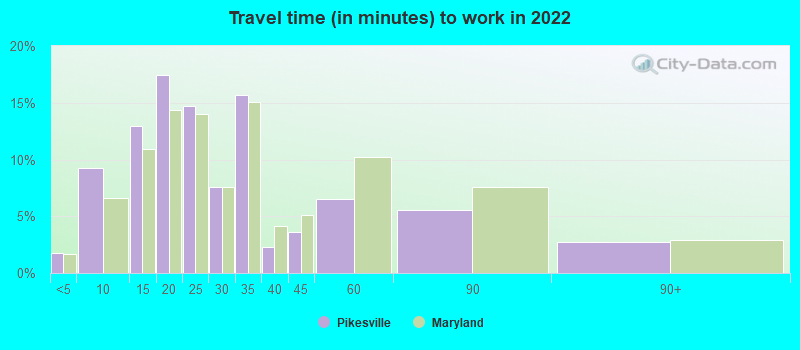
Travel time to work (commute)
Less than 5 minutes: 1855 to 9 minutes: 1,11410 to 14 minutes: 1,49515 to 19 minutes: 2,48620 to 24 minutes: 2,01125 to 29 minutes: 1,54330 to 34 minutes: 1,74435 to 39 minutes: 23440 to 44 minutes: 36045 to 59 minutes: 67360 to 89 minutes: 47190 or more minutes: 150
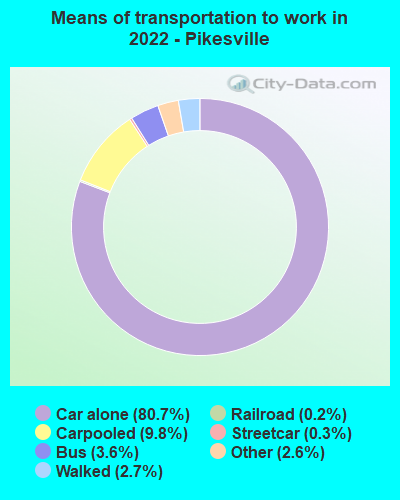
Means of transportation to work:
Drove a car alone: 9,135 (60.1%)Carpooled: 1,273 (8.4%)Bus : 251 (1.7%)Subway or elevated rail : 36 (0.2%)Light rail, streetcar or trolley : 21 (0.1%)Taxi: 352 (2.3%)Walked: 346 (2.3%)Worked at home: 4,191 (27.6%)
Unemployment by race in 2022
Unemployment rate for White non-Hispanic residents 2.8% Males1.8% FemalesUnemployment rate for Black residents 20.2% Males1.9% FemalesUnemployment rate for Asian residents 2.0% FemalesUnemployment rate for other race residents 21.4% FemalesUnemployment rate for Hispanic or Latino residents 37.1% Females
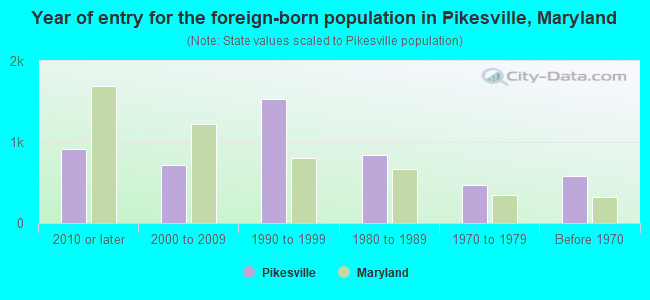
Year of entry for the foreign-born population in Pikesville, Maryland
915 2010 or later 711 2000 to 2009 1,528 1990 to 1999 838 1980 to 1989 472 1970 to 1979 586 Before 1970
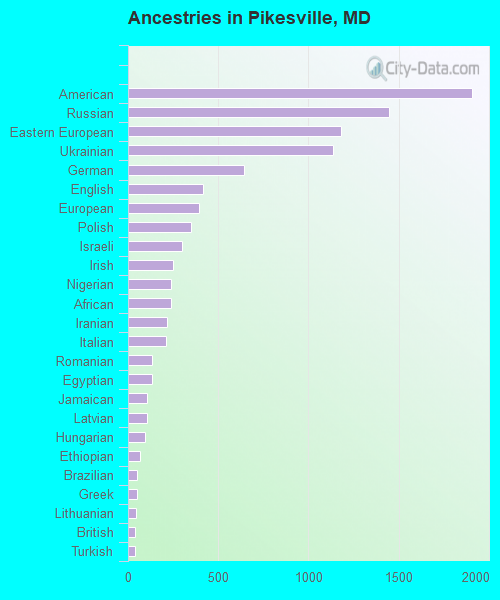
First ancestries reported:
American: 1,905 (9.6%)
Russian: 1,444 (7.3%)
Eastern European: 1,179 (5.9%)
Ukrainian: 1,135 (5.7%)
German: 641 (3.2%)
English: 416 (2.1%)
European: 392 (2.0%)
Polish: 349 (1.8%)
Israeli: 300 (1.5%)
Irish: 247 (1.2%)
Nigerian: 239 (1.2%)
African: 238 (1.2%)
Iranian: 217 (1.1%)
Italian: 210 (1.1%)
Romanian: 132 (0.7%)
Egyptian: 131 (0.7%)
Jamaican: 106 (0.5%)
Latvian: 105 (0.5%)
Hungarian: 94 (0.5%)
Ethiopian: 68 (0.3%)
Brazilian: 51 (0.3%)
Greek: 49 (0.2%)
Lithuanian: 43 (0.2%)
British: 38 (0.2%)
Turkish: 37 (0.2%)
Danish: 30 (0.2%)
Soviet Union: 30 (0.2%)
Austrian: 22 (0.1%)
Northern European: 19 (0.10%)
Lebanese: 18 (0.09%)
Armenian: 18 (0.09%)
Canadian: 17 (0.09%)
Norwegian: 14 (0.07%)
Scotch-Irish: 14 (0.07%)
French: 12 (0.06%)
Scottish: 9 (0.05%)
Croatian: 7 (0.04%)
Dutch: 7 (0.04%)
Scandinavian: 7 (0.04%)
Czechoslovakian: 4 (0.02%) Most common places of birth for foreign-born residents (%): Ukraine Pikesville:
14.5% (719)Maryland:
0.7% (6,326)
Russia Pikesville:
10.1% (500)Maryland:
1.0% (9,481)
Israel Pikesville:
8.6% (427)Maryland:
0.4% (3,756)
El Salvador Pikesville:
6.7% (332)Maryland:
12.0% (115,412)
China, excluding Hong Kong and Taiwan Pikesville:
5.5% (272)Maryland:
4.6% (44,742)
Uzbekistan Pikesville:
5.2% (261)Maryland:
0.1% (1,262)
Philippines Pikesville:
3.7% (183)Maryland:
3.8% (36,698)
Belarus Pikesville:
3.6% (181)Maryland:
0.1% (1,273)
Nigeria Pikesville:
3.6% (177)Maryland:
4.6% (44,825)
Dominican Republic Pikesville:
2.9% (145)Maryland:
1.4% (13,947)
Canada Pikesville:
2.9% (143)Maryland:
0.9% (8,603)
Egypt Pikesville:
2.6% (131)Maryland:
0.5% (4,414)
Azerbaijan Pikesville:
2.2% (108)Maryland:
0.1% (1,071)
India Pikesville:
2.0% (101)Maryland:
6.4% (61,725)
Iran Pikesville:
2.0% (100)Maryland:
1.3% (12,074)
Jamaica Pikesville:
1.9% (94)Maryland:
2.8% (27,444)
Other Eastern Europe Pikesville:
1.7% (85)Maryland:
0.3% (3,199)
Korea Pikesville:
1.7% (83)Maryland:
3.4% (32,635)
Thailand Pikesville:
1.6% (79)Maryland:
0.4% (3,874)
Taiwan Pikesville:
1.6% (79)Maryland:
0.9% (8,520)
United Kingdom, excluding England and Scotland Pikesville:
1.5% (76)Maryland:
0.7% (6,724)
Place of birth for U.S.-born residents:
This state: 18,675Other state: 9,448Northeast: 4,822Midwest: 1,449South: 2,457West: 694 89.9% of Pikesville residents lived in the same house 1 years ago.
Out of people who lived in different houses, 30.9% lived in this county.
Out of people who lived in different counties, 80.1% lived in Maryland.
Pikesville:
89.9%State average:
88.5%
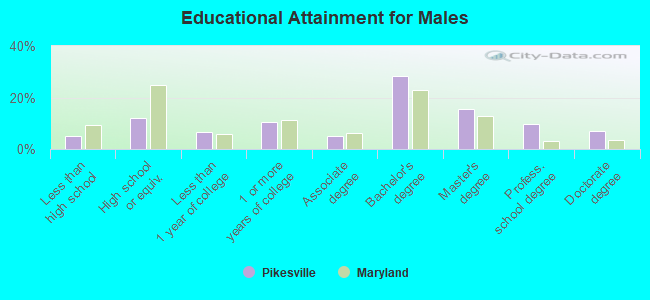
Education attainment for males 25 years and older:
No schooling: 196Nursery to 4th grade: 525th and 6th grade: 477th and 8th grade: 889th grade: 510th grade: 1011th grade: 812th grade, no diploma: 158High school graduate (or equivalency): 1,321Less than 1 year of college: 716Some college more than 1 year, no degree: 1,129Associate degree: 535Bachelor's degree: 3,049Master's degree: 1,678Professional school degree: 1,058Doctorate degree: 762
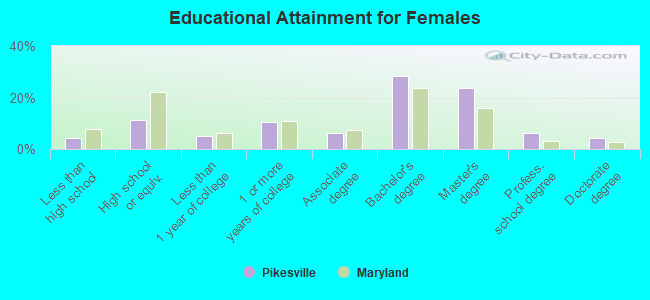
Education attainment for females 25 years and older:
No schooling: 208Nursery to 4th grade: 825th and 6th grade: 157th and 8th grade: 279th grade: 2210th grade: 5711th grade: 7912th grade, no diploma: 102High school graduate (or equivalency): 1,497Less than 1 year of college: 684Some college more than 1 year, no degree: 1,406Associate degree: 834Bachelor's degree: 3,801Master's degree: 3,170Professional school degree: 840Doctorate degree: 550
Housing units in structures:
One, detached: 5,440One, attached: 2,333Two: 703 or 4: 2085 to 9: 2,42410 to 19: 1,54220 to 49: 96650 or more: 1,511Mobile homes: 71Boats, RVs, vans, etc.: 8Housing units lacking complete plumbing facilities in 2022: 1.2%Housing units lacking complete kitchen facilities in 2022: 1.5%House/condo owner moved in on average 12 years ago
Renter moved in on average 6 years ago
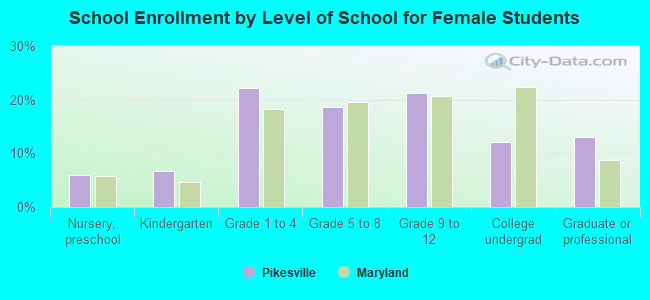
Private vs. public school enrollment:
Students in private schools in grades 1 to 8 (elementary and middle school): 2,224 Students in private schools in grades 9 to 12 (high school): 671 Students in private undergraduate colleges: 230