Pineland, FL (Florida) Houses and Residents
| Pineland: | $499,177 |
| Florida: | $354,100 |
Mean price in 2022:
Detached houses: $504,455
Here: $504,455 State: $500,941
Total population: 407 (Urban population: 0, Rural population: 474 (all nonfarm))
Houses: 255 (186 occupied: 192 owner occupied, 0 renter occupied)
| % of renters here: | 0% |
| State: | 33% |
Housing density: 277 houses/condos per square mile
Median price asked for vacant for-sale houses and condos in 2022 in this county: $370,015.
Median gross rent in Pineland, FL in 2022: $-736,698,498
Housing units in Pineland with a mortgage: 82 (3 second mortgage, 0 home equity loan, 3 both second mortgage and home equity loan)
Houses without a mortgage: 6
Median household income for houses/condos with a mortgage: $81,704
Median household income for apartments without a mortgage: $97,800
Median monthly housing costs: $1,087
Compare current foreclosures near Pineland, FL:
| Photo | Address | Area | Beds / Baths | Price | Details |
|---|---|---|---|---|---|

|
#1
NE 28th St
Cape Coral, FL 33909
|
1,263 sq. feet
|
2 baths 3 beds |
$249,850
|
show details |

|
#2
SW 40th Ter
Cape Coral, FL 33914
|
1,975 sq. feet
|
2 baths 3 beds |
$449,900
|
show details |

|
#3
Greendale Pl
Cape Coral, FL 33991
|
1,509 sq. feet
|
2 baths 3 beds |
$380,000
|
show details |

|
#4
SE 15th Ter
Cape Coral, FL 33990
|
1,710 sq. feet
|
2 baths 3 beds |
show details | |

|
#5
NE 9th Ct
Cape Coral, FL 33909
|
2,196 sq. feet
|
2 baths 4 beds |
show details | |

|
#6
SW 20th Ave
Cape Coral, FL 33991
|
2,029 sq. feet
|
2 baths 3 beds |
show details | |

|
#7
SW 17th Pl
Cape Coral, FL 33914
|
1,712 sq. feet
|
2 baths 4 beds |
show details | |

|
#8
SE 26th Ter
Cape Coral, FL 33904
|
1,625 sq. feet
|
2 baths 3 beds |
show details | |

|
#9
Academy Blvd
Cape Coral, FL 33904
|
1,152 sq. feet
|
2 baths 3 beds |
show details | |

|
#10
SW 21st Ave
Cape Coral, FL 33991
|
3,013 sq. feet
|
3 baths 4 beds |
show details |
| Photo | Address | Area | Beds / Baths | Price | Details |
|---|---|---|---|---|---|

|
#11
SW 17th Pl
Cape Coral, FL 33914
|
1,676 sq. feet
|
2 baths 3 beds |
show details | |

|
#12
SW 18th Ave
Cape Coral, FL 33914
|
2,092 sq. feet
|
2 baths 3 beds |
show details | |

|
#13
SW 50th St Apt 304
Cape Coral, FL 33914
|
1,096 sq. feet
|
2 baths 2 beds |
show details | |

|
#14
Frenchmans Ct
North Fort Myers, FL 33903
|
1,416 sq. feet
|
2 baths 2 beds |
show details | |

|
#15
Java Plum Ave
North Fort Myers, FL 33903
|
1,368 sq. feet
|
2 baths 3 beds |
show details | |

|
#16
Skyline Blvd
Cape Coral, FL 33914
|
2,334 sq. feet
|
4 baths 5 beds |
show details | |

|
#17
SE 23rd St
Cape Coral, FL 33990
|
1,212 sq. feet
|
2 baths 3 beds |
show details | |

|
#18
SE 25th Ter
Cape Coral, FL 33904
|
1,363 sq. feet
|
2 baths 3 beds |
show details | |

|
#19
Dandolo Cir
Cape Coral, FL 33909
|
1,976 sq. feet
|
2 baths 3 beds |
show details | |

|
#20
SW 45th Ter
Cape Coral, FL 33914
|
1,288 sq. feet
|
2 baths 3 beds |
show details |
| Photo | Address | Area | Beds / Baths | Price | Details |
|---|---|---|---|---|---|

|
#21
SW 7th Ave
Cape Coral, FL 33914
|
2,069 sq. feet
|
2 baths 4 beds |
show details | |

|
#22
SE 17th St
Cape Coral, FL 33990
|
1,472 sq. feet
|
2 baths 3 beds |
show details | |

|
#23
SE 16th St
Cape Coral, FL 33990
|
1,462 sq. feet
|
2 baths 3 beds |
show details | |

|
#24
SE 19th Ln
Cape Coral, FL 33990
|
1,506 sq. feet
|
2 baths 3 beds |
show details | |

|
#25
SE 5th Ave
Cape Coral, FL 33990
|
1,852 sq. feet
|
2 baths 3 beds |
show details | |

|
#26
Poetry Ln
North Fort Myers, FL 33903
|
1,714 sq. feet
|
2 baths 2 beds |
show details | |

|
#27
Golf Club Ct Apt 5
North Fort Myers, FL 33903
|
1,492 sq. feet
|
2 baths 2 beds |
show details | |

|
#28
Castle Pines Ct
North Fort Myers, FL 33917
|
1,812 sq. feet
|
2 baths 3 beds |
show details | |

|
#29
SW 8th Pl
Cape Coral, FL 33914
|
1,184 sq. feet
|
2 baths 3 beds |
show details | |

|
#30
NW Juanita Pl
Cape Coral, FL 33993
|
1,874 sq. feet
|
2 baths 4 beds |
show details |
| Photo | Address | Area | Beds / Baths | Price | Details |
|---|---|---|---|---|---|

|
#31
State St
North Fort Myers, FL 33903
|
1,808 sq. feet
|
1 baths 3 beds |
show details | |

|
#32
NW 21st St
Cape Coral, FL 33993
|
1,666 sq. feet
|
2 baths 3 beds |
show details | |

|
#33
NW 1st Pl
Cape Coral, FL 33993
|
1,873 sq. feet
|
2 baths 3 beds |
show details | |

|
#34
SW 11th Ct
Cape Coral, FL 33914
|
1,236 sq. feet
|
2 baths 3 beds |
show details | |

|
#35
NW 1st Pl
Cape Coral, FL 33993
|
1,469 sq. feet
|
2 baths 3 beds |
show details | |

|
#36
Omai Ct
Fort Myers, FL 33908
|
4,097 sq. feet
|
3 baths 3 beds |
show details | |

|
#37
SE 6th Ter
Cape Coral, FL 33990
|
1,527 sq. feet
|
2 baths 3 beds |
show details | |

|
#38
NW 4th Ave
Cape Coral, FL 33993
|
1,422 sq. feet
|
2 baths 3 beds |
show details | |

|
#39
SW Santa Barbara Pl
Cape Coral, FL 33991
|
2,277 sq. feet
|
2 baths 3 beds |
show details | |

|
#40
SE Santa Barbara Pl
Cape Coral, FL 33990
|
1,205 sq. feet
|
2 baths 3 beds |
show details |
| Photo | Address | Area | Beds / Baths | Price | Details |
|---|---|---|---|---|---|

|
#41
SW 38th Ter
Cape Coral, FL 33914
|
2,297 sq. feet
|
2 baths 4 beds |
show details | |

|
#42
NW 25th St
Cape Coral, FL 33993
|
2,050 sq. feet
|
2 baths 3 beds |
show details | |

|
#43
SE 3rd Ter
Cape Coral, FL 33990
|
1,534 sq. feet
|
2 baths 3 beds |
show details | |

|
#44
NE 1st Pl
Cape Coral, FL 33909
|
1,714 sq. feet
|
2 baths 4 beds |
show details | |

|
#45
NE 1st Pl
Cape Coral, FL 33909
|
2,238 sq. feet
|
2 baths 3 beds |
show details | |

|
#46
NE 23rd St
Cape Coral, FL 33909
|
1,408 sq. feet
|
2 baths 3 beds |
show details | |

|
#47
NE 3rd Ave
Cape Coral, FL 33909
|
1,609 sq. feet
|
2 baths 3 beds |
show details | |

|
#48
SW 4th Pl
Cape Coral, FL 33914
|
1,455 sq. feet
|
2 baths 3 beds |
show details | |

|
#49
Cape Coral Pkwy W, Apt 8
Cape Coral, FL 33914
|
1,061 sq. feet
|
2 baths 2 beds |
show details | |

|
Check over 1 million property listings on Foreclosure.com!
|
browse all offers | |||

Latest news about housing in Pineland, FL collected exclusively by city-data.com from local newspapers, TV, and radio stations

 | NW gulf access fishing options, Lift or trailer??? (14 replies) |
| Pine Island is the very last Florida Island that is not over developed. (27 replies) |
| Cayo Costa/Cabbage Key Ferry (7 replies) |
| Thoughts on Pine Island? (19 replies) |
| Finally visiting Pine Island (21 replies) |
| Where should I not look in Cape Coral? (27 replies) |

Household type by relationship:
Households: 403- Male householders: 109 (34 living alone), Female householders: 78 (0 living alone)
140 spouses (140 opposite-sex spouses), 10 unmarried partners, (10 opposite-sex unmarried partners), 63 children (63 natural, 0 adopted, 0 stepchildren), 0 grandchildren, 0 brothers or sisters, 0 parents, 0 foster children, 0 other relatives, 0 non-relatives
Size of family households: 128 2-persons, 4 4-persons, 15 5-persons.
Size of nonfamily households: 33 1-person, 14 2-persons.
40 married couples with children.
0 single-parent households (0 men, 0 women).
86.9% of residents of Pineland speak English at home.
7.4% of residents speak Spanish at home (100% speak English very well).
3.3% of residents speak other Indo-European language at home (100% speak English very well).
Foreign born population: 42 (10.4%)
(57.1% of them are naturalized citizens)
| Here: | 6.1 |
| State: | 5.9 |
| Here: | -651851851.2 |
| State: | 4.2 |

- Bedrooms in owner-occupied houses and condos in Pineland, Florida
- 0no bedroom
- 01 bedroom
- 752 bedrooms
- 993 bedrooms
- 194 bedrooms
- 05+ bedrooms

- Cars and other vehicles available in Pineland in owner-occupied houses/condos
- 0no vehicle
- 711 vehicle
- 882 vehicles
- 343 vehicles
- 04 vehicles
- 05+ vehicles

- Rooms in owner-occupied houses in Pineland, Florida
- 01 room
- 02 rooms
- 163 rooms
- 124 rooms
- 265 rooms
- 536 rooms
- 337 rooms
- 338 rooms
- 209+ rooms


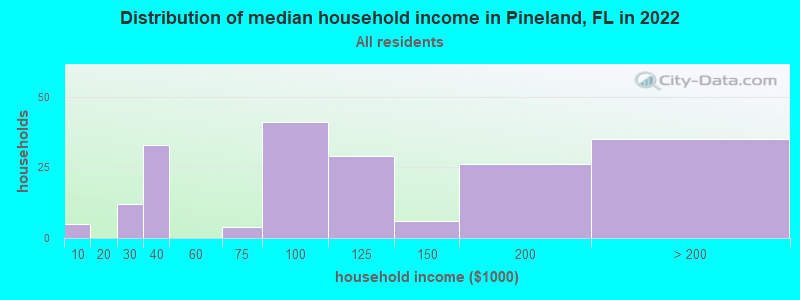
Pineland, FL household income distribution

- 5Less than $10,000
- 12$20,000 to $29,999
- 33$30,000 to $39,999
- 4$60,000 to $74,999
- 41$75,000 to $99,999
- 29$100,000 to $124,999
- 6$125,000 to $149,999
- 26$150,000 to $199,999
- 35$200,000 or more
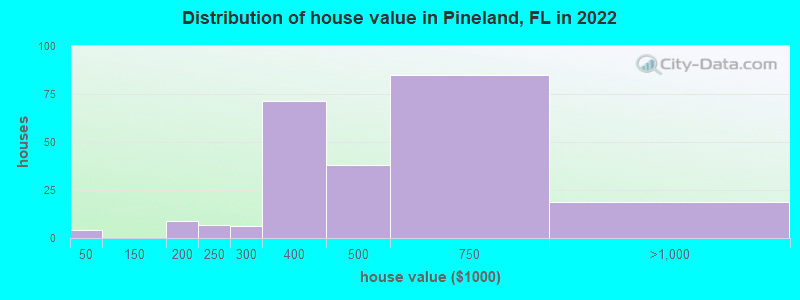
Home value of owner - occupied houses in 2022 in Pineland, FL
-
- 4$20,000 to $24,999
- 5$150,000 to $174,999
- 3$175,000 to $199,999
- 6$200,000 to $249,999
- 6$250,000 to $299,999
- 71$300,000 to $399,999
- 38$400,000 to $499,999
- 84$500,000 to $749,999
- 18$750,000 to $999,999

Percentage of workers working in this county: 97.9%
Number of people working at home: 71 (37.8% of all workers)
Travel time to work (commute)
- Less than 5 minutes: 0
- 5 to 9 minutes: 16
- 10 to 14 minutes: 7
- 15 to 19 minutes: 7
- 20 to 24 minutes: 15
- 25 to 29 minutes: 3
- 30 to 34 minutes: 16
- 35 to 39 minutes: 19
- 40 to 44 minutes: 7
- 45 to 59 minutes: 29
- 60 to 89 minutes: 7
- 90 or more minutes: 0
Means of transportation to work:
- Drove a car alone: 127 (81.4%)
- Carpooled: 9 (5.8%)
- Walked: 13 (8.3%)
- Worked at home: 7 (4.5%)


- Year of entry for the foreign-born population in Pineland, Florida
- 312010 or later
- 02000 to 2009
- 91990 to 1999
- 01980 to 1989
- 01970 to 1979
- 23Before 1970

First ancestries reported:
- English: 53 (24.0%)
- American: 45 (20.3%)
- Irish: 25 (11.3%)
- German: 19 (8.6%)
- French Canadian: 14 (6.3%)
- Russian: 8 (3.6%)
- Italian: 7 (3.2%)
- Czechoslovakian: 5 (2.3%)
- Polish: 5 (2.3%)
- Scottish: 4 (1.8%)
- Slovak: 4 (1.8%)
- Norwegian: 3 (1.4%)
Most common places of birth for foreign-born residents (%):
| Pineland: | 36.8% (14) |
| Florida: | 2.4% (109,132) |
| Pineland: | 21.1% (8) |
| Florida: | 0.7% (31,076) |
| Pineland: | 18.4% (7) |
| Florida: | 0.8% (37,723) |
| Pineland: | 15.8% (6) |
| Florida: | 0.7% (34,227) |
Place of birth for U.S.-born residents:
- This state: 67
- Other state: 267
- Northeast: 92
- Midwest: 114
- South: 29
- West: 30
99.3% of Pineland residents lived in the same house 1 years ago.
Out of people who lived in different houses, 0.0% lived in this county.
Out of people who lived in different counties, 0.0% lived in Florida.
| Pineland: | 99.3% |
| State average: | 86.3% |
Education attainment for males 25 years and older:
- No schooling: 0
- Nursery to 4th grade: 0
- 5th and 6th grade: 0
- 7th and 8th grade: 0
- 9th grade: 0
- 10th grade: 0
- 11th grade: 5
- 12th grade, no diploma: 0
- High school graduate (or equivalency): 29
- Less than 1 year of college: 10
- Some college more than 1 year, no degree: 18
- Associate degree: 30
- Bachelor's degree: 67
- Master's degree: 13
- Professional school degree: 11
- Doctorate degree: 6

Education attainment for females 25 years and older:
- No schooling: 0
- Nursery to 4th grade: 0
- 5th and 6th grade: 0
- 7th and 8th grade: 0
- 9th grade: 0
- 10th grade: 0
- 11th grade: 0
- 12th grade, no diploma: 0
- High school graduate (or equivalency): 18
- Less than 1 year of college: 3
- Some college more than 1 year, no degree: 10
- Associate degree: 33
- Bachelor's degree: 48
- Master's degree: 27
- Professional school degree: 0
- Doctorate degree: 11


Housing units in structures:
- One, detached: 249
- One, attached: 6

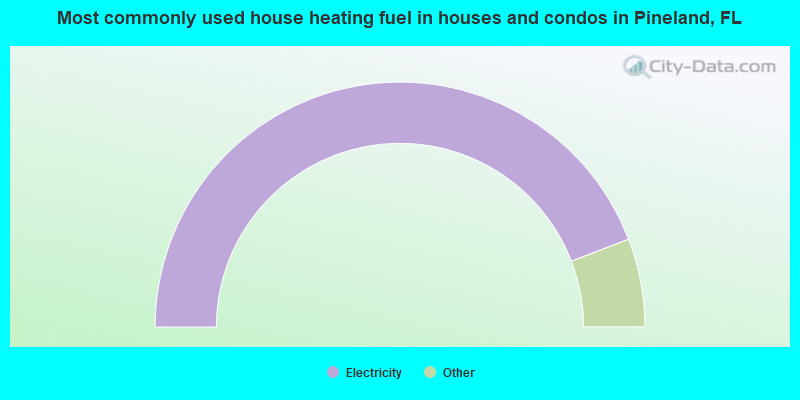
- 88.7%Electricity
- 4.0%Utility gas
- 4.0%No fuel used
- 3.4%Solar energy
Private vs. public school enrollment:
| Here: | 0.0% |
| Florida: | 15.8% |
| Here: | 0.0% |
| Florida: | 12.9% |
| Here: | 0.0% |
| Florida: | 23.6% |


