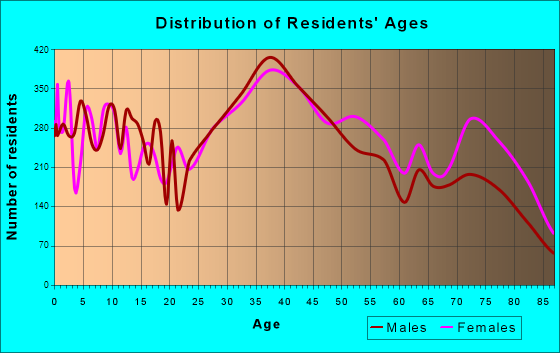
Pinellas Park, FL (Florida) Houses and Residents
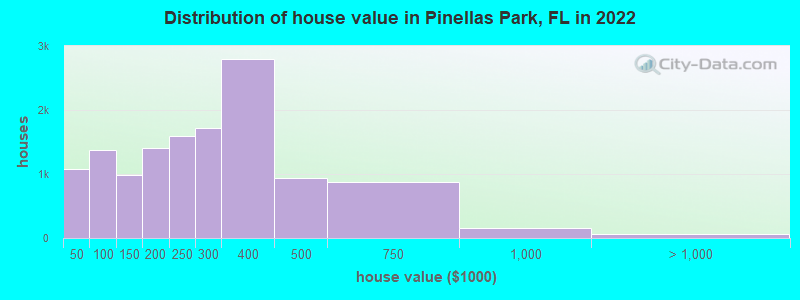
Estimated median house or condo value in 2022: $285,194 (it was $69,300 in 2000 )
Pinellas Park:
$285,194Florida:
$354,100
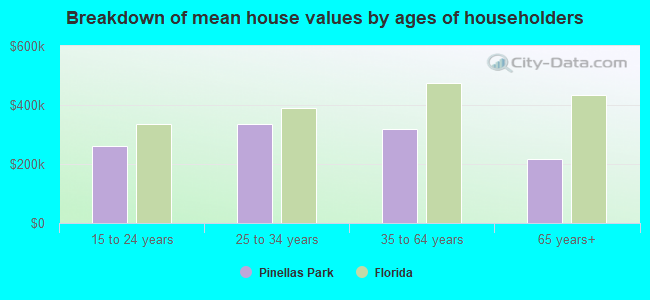
Lower value quartile - upper value quartile: $159,728 - $388,209Mean price in 2022: Detached houses: $235,501 Here:
$235,501State:
$500,941
Townhouses or other attached units: $174,334 Here:
$174,334State:
$370,869
In 2-unit structures: $217,751 Here:
$217,751State:
$423,188
In 3-to-4-unit structures: $177,304 Here:
$177,304State:
$309,944
In 5-or-more-unit structures: $210,565 Here:
$210,565State:
$447,145
Mobile homes: $35,309 Here:
$35,309State:
$113,202
Occupied boats, RVs, vans, etc.: $124,005 Here:
$124,005State:
$73,933
Total population: 50,946 (Urban population: 45,414, Rural population: 0)
Houses: 25,162 (21,439 occupied: 15,263 owner occupied, 6,359 renter occupied )
% of renters here:
29%State:
33%
Housing density: 1,706 houses/condos per square mile
Median price asked for vacant for-sale houses and condos in 2022: $192,440.
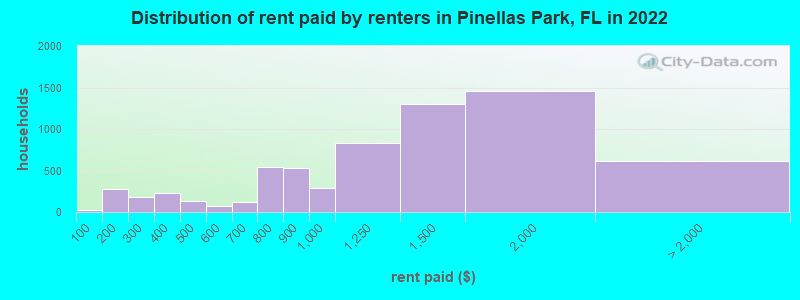
Median contract rent in 2022: $1,244 (lower quartile is $836, upper quartile is $1,596)
Median rent asked for vacant for-rent units in 2022: $1,434
Median gross rent in Pinellas Park, FL in 2022: $1,443
Housing units in Pinellas Park with a mortgage: 8,321 (613 second mortgage, 0 home equity loan, 456 both second mortgage and home equity loan )Houses without a mortgage: 48
Median household income for houses/condos with a mortgage: $94,701
Median household income for apartments without a mortgage: $47,203
Median monthly housing costs: $1,194
Data:
Median house or condo value ($)
Median house or condo value ($ change since 2000)
Median house or condo value ($) - White
Median house or condo value ($) - Black or African American
Median house or condo value ($) - Asian
Median house or condo value ($) - Hispanic or Latino
Median house or condo value ($) - American Indian and Alaska Native
Median house or condo value ($) - Multirace
Median house or condo value ($) - Other Race
Median price asked for mobile homes ($)
Household density (households per square mile)
Mean house or condo value by units in structure - 1, detached ($)
Mean house or condo value by units in structure - 1, attached ($)
Mean house or condo value by units in structure - 2 ($)
Mean house or condo value by units in structure by units in structure - 3 or 4 ($)
Mean house or condo value by units in structure - 5 or more ($)
Mean house or condo value by units in structure - Boat, RV, van, etc. ($)
Mean house or condo value by units in structure - Mobile home ($)
Median contract rent ($)
Median contract rent - Lower quartile ($)
Median contract rent - Upper quartile ($)
Median gross rent ($)
Urban houses (%)
Rural houses (%)
Houses occupied (%)
Houses occupied (% change since 2000)
Houses owner occupied (%)
Houses owner occupied (% change since 2000)
Houses renter occupied (%)
Houses renter occupied (% change since 2000)
Vacant housing units - For rent (%)
Vacant housing units - For rent (% change since 2000)
Vacant housing units - For sale only (%)
Vacant housing units - For sale only (% change since 2000)
Vacant housing units - Rented or sold, not occupied (%)
Vacant housing units - Rented or sold, not occupied (% change since 2000)
Vacant housing units - For seasonal, recreational, or occasional use (%)
Vacant housing units - For seasonal, recreational, or occasional use (% change since 2000)
Vacant housing units - For migrant workers (%)
Vacant housing units - For migrant workers (% change since 2000)
Vacant housing units - Other vacant (%)
Vacant housing units - Other vacant (% change since 2000)
Median monthly housing costs ($)
Median household income for houses/condos with a mortgage ($)
Median household income for houses/condos without a mortgage ($)
Median household income ($)
Median household income ($) - White
Median household income ($) - Black or African American
Median household income ($) - Asian
Median household income ($) - Hispanic or Latino
Median household income ($) - American Indian and Alaska Native
Median household income ($) - Multirace
Median household income ($) - Other Race
Mortgage status - with mortgage (%)
Mortgage status - with second mortgage (%)
Mortgage status - with home equity loan (%)
Mortgage status - with both second mortgage and home equity loan (%)
Mortgage status - without a mortgage (%)
Median year house/condo built
Median year apartment built
Household type by relationship - Male householder living alone (%)
Household type by relationship - Male householder not living alone (%)
Household type by relationship - Female householder living alone (%)
Household type by relationship - Female householder not living alone (%)
Household type by relationship - Opposite-Sex spouse (%)
Household type by relationship - Same-Sex spouse (%)
Household type by relationship - Opposite-Sex unmarried partner (%)
Household type by relationship - Same-Sex unmarried partner (%)
Household type by relationship - In group quarters (%)
Size of family households - 2-person household (%)
Size of family households - 3-person household (%)
Size of family households - 4-person household (%)
Size of family households - 5-person household (%)
Size of family households - 6-person household (%)
Size of family households - 7-or-more-person household (%)
Size of nonfamily households - 1-person household (%)
Size of nonfamily households - 2-person household (%)
Size of nonfamily households - 3-person household (%)
Size of nonfamily households - 4-person household (%)
Size of nonfamily households - 5-person household (%)
Size of nonfamily households - 6-person household (%)
Size of nonfamily households - 7-or-moreperson household (%)
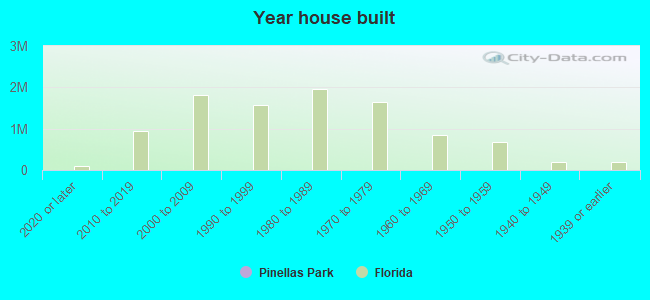
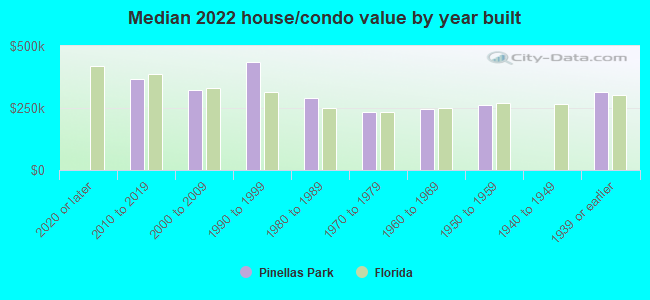
Year house built - Built 2010 or later (%)
Year house built - Built 2000 to 2009 (%)
Year house built - Built 1990 to 1999 (%)
Year house built - Built 1980 to 1989 (%)
Year house built - Built 1970 to 1979 (%)
Year house built - Built 1960 to 1969 (%)
Year house built - Built 1950 to 1959 (%)
Year house built - Built 1940 to 1949 (%)
Year house built - Built 1939 or earlier (%)
Median number of rooms in houses and condos
Median number of rooms in apartments
Median number of bedrooms in owner occupied houses
Mean number of bedrooms in owner occupied houses
Median number of bedrooms in renter occupied houses
Mean number of bedrooms in renter occupied houses
Median number of vehichles in owner occupied houses
Mean number of vehichles in owner occupied houses
Median number of vehichles in renter occupied houses
Mean number of vehichles in renter occupied houses
Rooms in owner-occupied houses - 1 room (%)
Rooms in owner-occupied houses - 2 rooms (%)
Rooms in owner-occupied houses - 3 rooms (%)
Rooms in owner-occupied houses - 4 rooms (%)
Rooms in owner-occupied houses - 5 rooms (%)
Rooms in owner-occupied houses - 6 rooms (%)
Rooms in owner-occupied houses - 7 rooms (%)
Rooms in owner-occupied houses - 8 rooms (%)
Rooms in owner-occupied houses - 9+ rooms (%)
Rooms in renter-occupied houses - 1 room (%)
Rooms in renter-occupied houses - 2 rooms (%)
Rooms in renter-occupied houses - 3 rooms (%)
Rooms in renter-occupied houses - 4 rooms (%)
Rooms in renter-occupied houses - 5 rooms (%)
Rooms in renter-occupied houses - 6 rooms (%)
Rooms in renter-occupied houses - 7 rooms (%)
Rooms in renter-occupied houses - 8 rooms (%)
Rooms in renter-occupied houses - 9+ rooms (%)
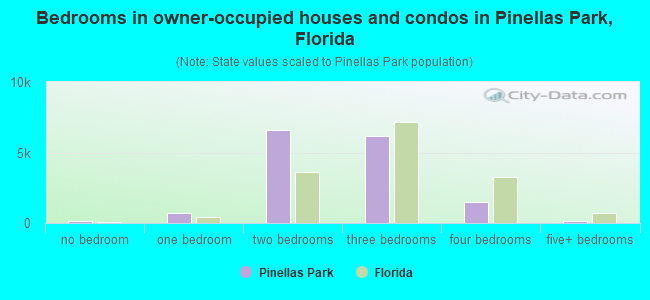
Bedrooms in owner-occupied houses - no bedrooms (%)
Bedrooms in owner-occupied houses - 1 bedroom (%)
Bedrooms in owner-occupied houses - 2 bedrooms (%)
Bedrooms in owner-occupied houses - 3 bedrooms (%)
Bedrooms in owner-occupied houses - 4 bedrooms (%)
Bedrooms in owner-occupied houses - 5+ bedrooms (%)
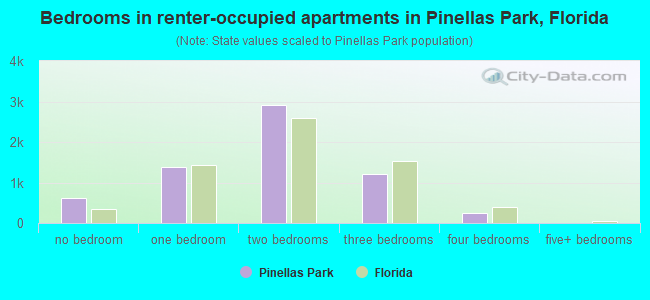
Bedrooms in renter-occupied houses - no bedrooms (%)
Bedrooms in renter-occupied houses - 1 bedroom (%)
Bedrooms in renter-occupied houses - 2 bedrooms (%)
Bedrooms in renter-occupied houses - 3 bedrooms (%)
Bedrooms in renter-occupied houses - 4 bedrooms (%)
Bedrooms in renter-occupied houses - 5+ bedrooms (%)
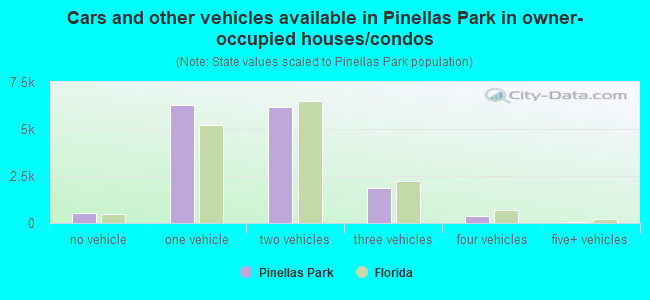
Vehicles available in owner-occupied houses - no vehicle available (%)
Vehicles available in owner-occupied houses - 1 vehicle available(%)
Vehicles available in owner-occupied houses - 2 Vehicles available (%)
Vehicles available in owner-occupied houses - 3 Vehicles available (%)
Vehicles available in owner-occupied houses - 4 Vehicles available (%)
Vehicles available in owner-occupied houses - 5+ Vehicles available (%)
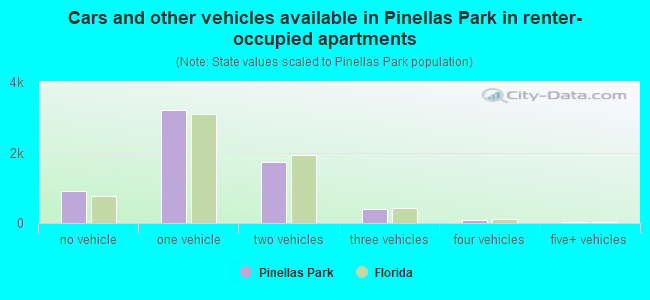
Vehicles available in renter-occupied houses - no vehicle available (%)
Vehicles available in renter-occupied houses - 1 vehicle available (%)
Vehicles available in renter-occupied houses - 2 Vehicles available (%)
Vehicles available in renter-occupied houses - 3 Vehicles available (%)
Vehicles available in renter-occupied houses - 4 Vehicles available (%)
Vehicles available in renter-occupied houses - 5+ Vehicles available (%)
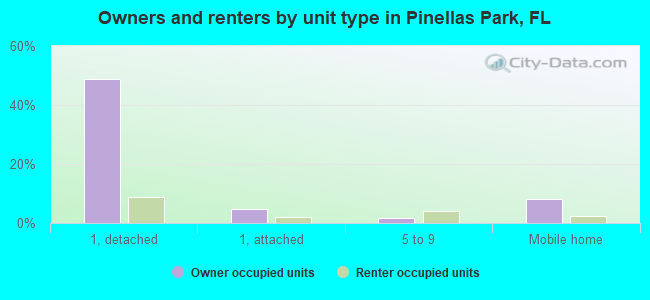
Housing units in structures - 1, detached (%)
Housing units in structures - 1, attached (%)
Housing units in structures - 2 (%)
Housing units in structures - 3 or 4 (%)
Housing units in structures - 5 to 9 (%)
Housing units in structures - 10 to 19 (%)
Housing units in structures - 20 to 49 (%)
Housing units in structures - 50 or more (%)
Housing units in structures - Mobile home (%)
Housing units in structures - Boat, RV, van, etc. (%)
Housing units in structures - Owners - 1, detached (%)
Housing units in structures - Owners - 1, attached (%)
Housing units in structures - Owners - 2 (%)
Housing units in structures - Owners - 3 or 4 (%)
Housing units in structures - Owners - 5 to 9 (%)
Housing units in structures - Owners - 10 to 19 (%)
Housing units in structures - Owners - 20 to 49 (%)
Housing units in structures - Owners - 50 or more (%)
Housing units in structures - Owners - Mobile home (%)
Housing units in structures - Owners - Boat, RV, van, etc. (%)
Housing units in structures - Renters - 1, detached (%)
Housing units in structures - Renters - 1, attached (%)
Housing units in structures - Renters - 2 (%)
Housing units in structures - Renters - 3 or 4 (%)
Housing units in structures - Renters - 5 to 9 (%)
Housing units in structures - Renters - 10 to 19 (%)
Housing units in structures - Renters - 20 to 49 (%)
Housing units in structures - Renters - 50 or more (%)
Housing units in structures - Renters - Mobile home (%)
Housing units in structures - Renters - Boat, RV, van, etc. (%)
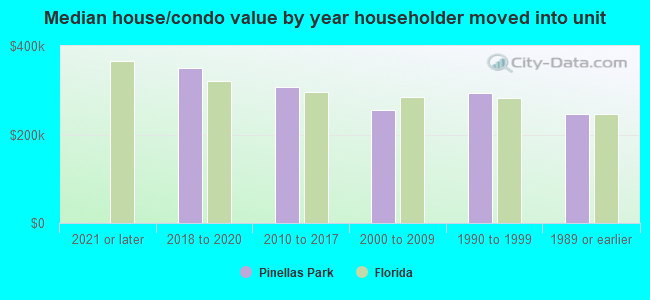
House/condo owner moved in on average (years ago)
Renter moved in on average (years ago)
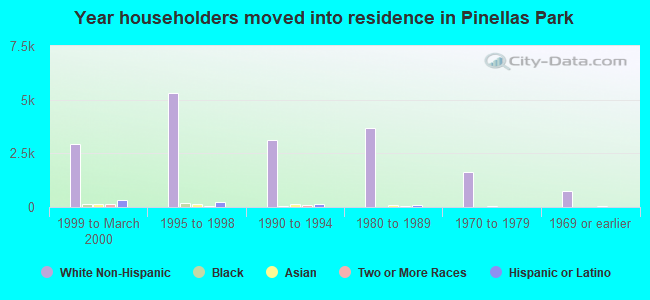
Year householder moved into unit - Moved in 1999 to March 2000 (%)
Year householder moved into unit - Moved in 1999 to March 2000 (%) - White
Year householder moved into unit - Moved in 1999 to March 2000 (%) - Black or African American
Year householder moved into unit - Moved in 1999 to March 2000 (%) - Asian
Year householder moved into unit - Moved in 1999 to March 2000 (%) - Hispanic or Latino
Year householder moved into unit - Moved in 1999 to March 2000 (%) - American Indian and Alaska Native
Year householder moved into unit - Moved in 1999 to March 2000 (%) - Multirace
Year householder moved into unit - Moved in 1999 to March 2000 (%) - Other Race
Year householder moved into unit - Moved in 1995 to 1998 (%)
Year householder moved into unit - Moved in 1995 to 1998 (%) - White
Year householder moved into unit - Moved in 1995 to 1998 (%) - Black or African American
Year householder moved into unit - Moved in 1995 to 1998 (%) - Asian
Year householder moved into unit - Moved in 1995 to 1998 (%) - Hispanic or Latino
Year householder moved into unit - Moved in 1995 to 1998 (%) - American Indian and Alaska Native
Year householder moved into unit - Moved in 1995 to 1998 (%) - Multirace
Year householder moved into unit - Moved in 1995 to 1998 (%) - Other Race
Year householder moved into unit - Moved in 1990 to 1994 (%)
Year householder moved into unit - Moved in 1990 to 1994 (%) - White
Year householder moved into unit - Moved in 1990 to 1994 (%) - Black or African American
Year householder moved into unit - Moved in 1990 to 1994 (%) - Asian
Year householder moved into unit - Moved in 1990 to 1994 (%) - Hispanic or Latino
Year householder moved into unit - Moved in 1990 to 1994 (%) - American Indian and Alaska Native
Year householder moved into unit - Moved in 1990 to 1994 (%) - Multirace
Year householder moved into unit - Moved in 1990 to 1994 (%) - Other Race
Year householder moved into unit - Moved in 1980 to 1989 (%)
Year householder moved into unit - Moved in 1980 to 1989 (%) - White
Year householder moved into unit - Moved in 1980 to 1989 (%) - Black or African American
Year householder moved into unit - Moved in 1980 to 1989 (%) - Asian
Year householder moved into unit - Moved in 1980 to 1989 (%) - Hispanic or Latino
Year householder moved into unit - Moved in 1980 to 1989 (%) - American Indian and Alaska Native
Year householder moved into unit - Moved in 1980 to 1989 (%) - Multirace
Year householder moved into unit - Moved in 1980 to 1989 (%) - Other Race
Year householder moved into unit - Moved in 1970 to 1979 (%)
Year householder moved into unit - Moved in 1970 to 1979 (%) - White
Year householder moved into unit - Moved in 1970 to 1979 (%) - Black or African American
Year householder moved into unit - Moved in 1970 to 1979 (%) - Asian
Year householder moved into unit - Moved in 1970 to 1979 (%) - Hispanic or Latino
Year householder moved into unit - Moved in 1970 to 1979 (%) - American Indian and Alaska Native
Year householder moved into unit - Moved in 1970 to 1979 (%) - Multirace
Year householder moved into unit - Moved in 1970 to 1979 (%) - Other Race
Year householder moved into unit - Moved in 1969 or earlier (%)
Year householder moved into unit - Moved in 1969 or earlier (%) - White
Year householder moved into unit - Moved in 1969 or earlier (%) - Black or African American
Year householder moved into unit - Moved in 1969 or earlier (%) - Asian
Year householder moved into unit - Moved in 1969 or earlier (%) - Hispanic or Latino
Year householder moved into unit - Moved in 1969 or earlier (%) - American Indian and Alaska Native
Year householder moved into unit - Moved in 1969 or earlier (%) - Multirace
Year householder moved into unit - Moved in 1969 or earlier (%) - Other Race
Housing units lacking complete plumbing facilities (%)
Housing units lacking complete kitchen facilities (%)
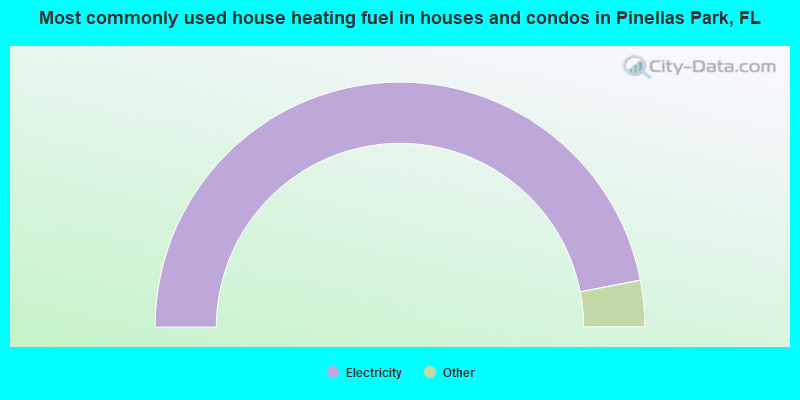
House heating fuel used in houses and condos - Utility gas (%)
House heating fuel used in houses and condos - Bottled, tank, or LP gas (%)
House heating fuel used in houses and condos - Electricity (%)
House heating fuel used in houses and condos - Fuel oil, kerosene, etc. (%)
House heating fuel used in houses and condos - Coal or coke (%)
House heating fuel used in houses and condos - Wood (%)
House heating fuel used in houses and condos - Solar energy (%)
House heating fuel used in houses and condos - Other fuel (%)
House heating fuel used in houses and condos - No fuel used (%)
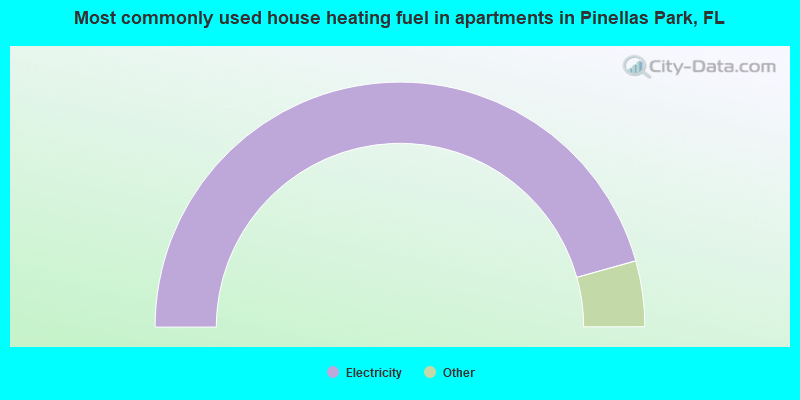
House heating fuel used in apartments - Utility gas (%)
House heating fuel used in apartments - Bottled, tank, or LP gas (%)
House heating fuel used in apartments - Electricity (%)
House heating fuel used in apartments - Fuel oil, kerosene, etc. (%)
House heating fuel used in apartments - Coal or coke (%)
House heating fuel used in apartments - Wood (%)
House heating fuel used in apartments - Solar energy (%)
House heating fuel used in apartments - Other fuel (%)
House heating fuel used in apartments - No fuel used (%)
Median year house/condo built: 1979Median year apartment built: 1980Household type by relationship:
Households: 53,453
Male householders: 10,377 (2,785 living alone ), Female householders: 10,953 (4,148 living alone )9,177 spouses (8,968 opposite-sex spouses ), 1,997 unmarried partners , (1,838 opposite-sex unmarried partners ), 13,325 children (12,053 natural , 409 adopted , 861 stepchildren ), 877 grandchildren , 831 brothers or sisters , 1,854 parents , 113 foster children , 648 other relatives , 2,276 non-relatives In group quarters: 1,019
Size of family households: 6,313 2-persons , 2,557 3-persons , 1,787 4-persons , 745 5-persons , 445 6-persons , 79 7-or-more-persons .
Size of nonfamily households: 7,510 1-person , 1,729 2-persons , 182 3-persons , 19 4-persons , 36 5-persons , 20 6-persons .
5,751 married couples with children. single-parent households (716 men , 1,457 women ).
75.2% of residents of Pinellas Park speak English at home. of residents speak Spanish at home (54% speak English very well , 27% speak English well , 18% speak English not well , 2% don't speak English at all ).of residents speak other Indo-European language at home (65% speak English very well , 24% speak English well , 10% speak English not well , 2% don't speak English at all ).of residents speak Asian or Pacific Island language at home (35% speak English very well , 29% speak English well , 22% speak English not well , 14% don't speak English at all ).of residents speak other language at home (53% speak English very well , 13% speak English well , 34% speak English not well ).
Foreign born population: 9,048 (16.9%)of them are naturalized citizens )
Median number of rooms in houses and condos:
Median number of rooms in apartments
Owner-occupied Renter-occupied
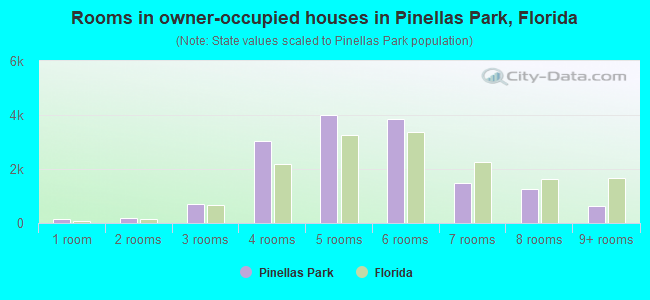
Rooms in owner-occupied houses in Pinellas Park, Florida
147 1 room 198 2 rooms 716 3 rooms 3,021 4 rooms 3,993 5 rooms 3,835 6 rooms 1,464 7 rooms 1,267 8 rooms 622 9+ rooms
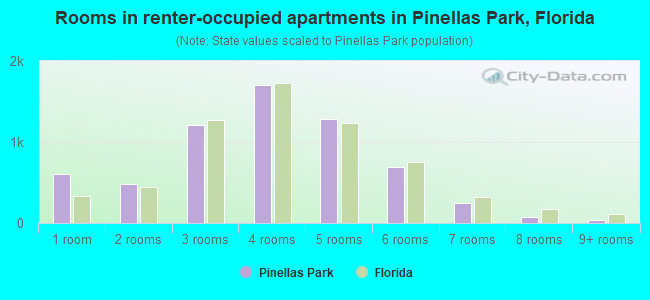
Rooms in renter-occupied apartments in Pinellas Park, Florida
599 1 room 486 2 rooms 1,216 3 rooms 1,708 4 rooms 1,286 5 rooms 696 6 rooms 251 7 rooms 77 8 rooms 41 9+ rooms
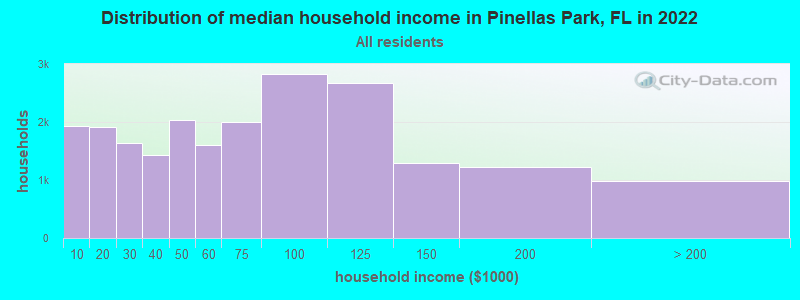
Pinellas Park, FL household income distribution 1,927 Less than $10,0001,910 $10,000 to $19,9991,639 $20,000 to $29,9991,427 $30,000 to $39,9992,043 $40,000 to $49,9991,607 $50,000 to $59,9992,008 $60,000 to $74,9992,819 $75,000 to $99,9992,669 $100,000 to $124,9991,301 $125,000 to $149,9991,216 $150,000 to $199,999984 $200,000 or more
Home value of owner - occupied houses in 2022 in Pinellas Park, FL 194 Less than $10,000132 $10,000 to $14,999119 $15,000 to $19,999249 $20,000 to $24,99999 $25,000 to $29,99977 $30,000 to $34,99946 $35,000 to $39,999160 $40,000 to $49,999407 $50,000 to $59,999169 $60,000 to $69,999184 $70,000 to $79,999281 $80,000 to $89,999168 $90,000 to $99,999647 $100,000 to $124,999344 $125,000 to $149,999719 $150,000 to $174,999693 $175,000 to $199,9991,589 $200,000 to $249,9991,726 $250,000 to $299,9992,792 $300,000 to $399,999944 $400,000 to $499,999871 $500,000 to $749,999154 $750,000 to $999,9998 $1,000,000 to $1,499,99947 $1,500,000 to $1,999,999Rent paid by renters in 2022 in Pinellas Park, FL 26 Less than $100277 $150 to $199106 $200 to $24976 $250 to $299118 $300 to $349105 $350 to $39991 $400 to $44935 $450 to $49960 $500 to $54910 $550 to $59929 $600 to $64988 $650 to $699306 $700 to $749236 $750 to $799528 $800 to $899284 $900 to $999828 $1,000 to $1,2491,297 $1,250 to $1,4991,456 $1,500 to $1,999298 $2,000 to $2,49941 $2,500 to $2,999269 No cash rent
Percentage of workers working in this county: 88.4%Number of people working at home: 3,272 (12.9% of all workers )
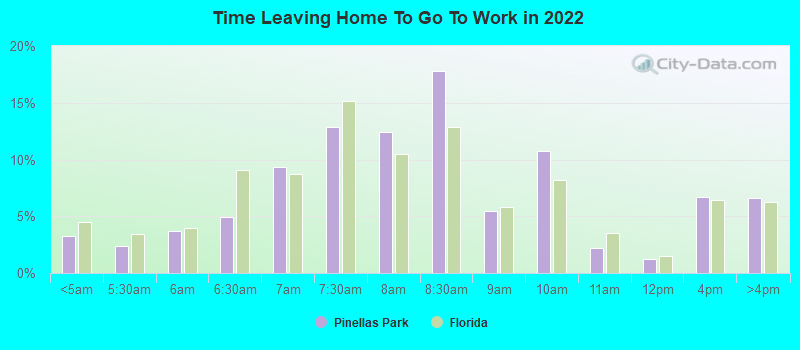
Travel time to work (commute)
Less than 5 minutes: 3115 to 9 minutes: 1,41010 to 14 minutes: 2,74615 to 19 minutes: 5,67720 to 24 minutes: 3,85725 to 29 minutes: 1,32530 to 34 minutes: 2,59935 to 39 minutes: 42640 to 44 minutes: 66345 to 59 minutes: 79860 to 89 minutes: 98790 or more minutes: 507
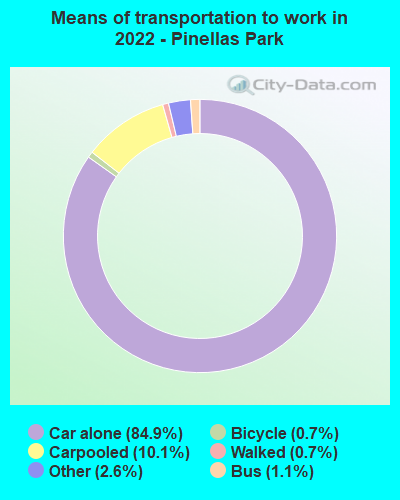
Means of transportation to work:
Drove a car alone: 27,777 (72.6%)Carpooled: 3,835 (10.0%)Bus : 388 (1.0%)Taxi: 1,029 (2.7%)Bicycle: 269 (0.7%)Walked: 244 (0.6%)Worked at home: 3,272 (8.6%)
Unemployment by race in 2022
Unemployment rate for White non-Hispanic residents 5.6% Males4.5% FemalesUnemployment rate for Black residents 2.4% MalesUnemployment rate for American Indian and Alaska Native residents 43.8% FemalesUnemployment rate for Asian residents 3.4% MalesUnemployment rate for other race residents 4.6% MalesUnemployment rate for two or more race residents 3.3% Males4.2% FemalesUnemployment rate for Hispanic or Latino residents 4.7% Males4.1% Females
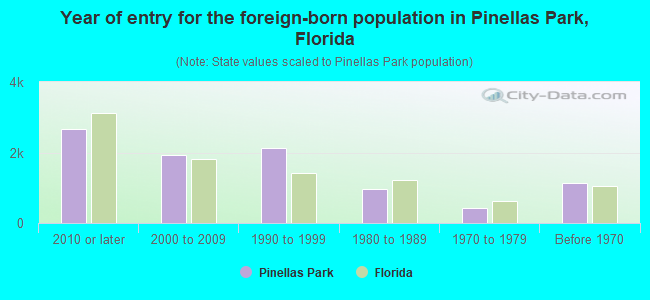
Year of entry for the foreign-born population in Pinellas Park, Florida
2,654 2010 or later 1,935 2000 to 2009 2,140 1990 to 1999 964 1980 to 1989 434 1970 to 1979 1,125 Before 1970
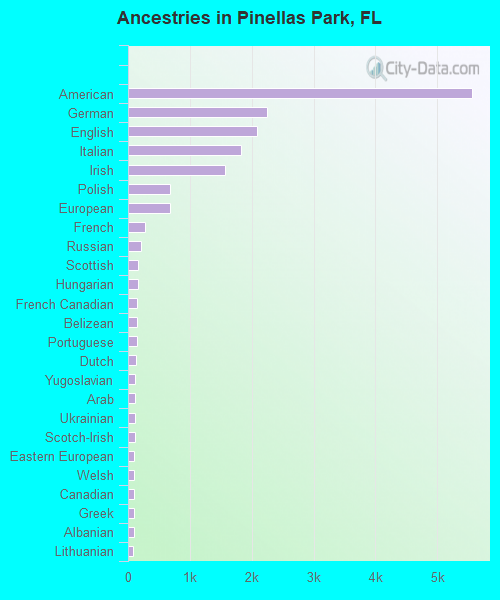
First ancestries reported:
American: 5,557 (19.1%)
German: 2,242 (7.7%)
English: 2,088 (7.2%)
Italian: 1,822 (6.3%)
Irish: 1,571 (5.4%)
Polish: 682 (2.3%)
European: 680 (2.3%)
French: 278 (1.0%)
Russian: 204 (0.7%)
Scottish: 162 (0.6%)
Hungarian: 159 (0.5%)
French Canadian: 146 (0.5%)
Belizean: 146 (0.5%)
Portuguese: 143 (0.5%)
Dutch: 129 (0.4%)
Yugoslavian: 118 (0.4%)
Arab: 109 (0.4%)
Ukrainian: 108 (0.4%)
Scotch-Irish: 107 (0.4%)
Eastern European: 104 (0.4%)
Welsh: 95 (0.3%)
Canadian: 93 (0.3%)
Greek: 93 (0.3%)
Albanian: 92 (0.3%)
Lithuanian: 80 (0.3%)
Swedish: 60 (0.2%)
Serbian: 56 (0.2%)
Finnish: 44 (0.2%)
Iranian: 39 (0.1%)
Brazilian: 38 (0.1%)
Slovak: 35 (0.1%)
Northern European: 34 (0.1%)
Czech: 33 (0.1%)
Norwegian: 32 (0.1%)
Palestinian: 31 (0.1%)
Romanian: 27 (0.09%)
Trinidadian and Tobagonian: 21 (0.07%)
Bulgarian: 19 (0.07%)
Jamaican: 18 (0.06%)
Croatian: 17 (0.06%)
British: 15 (0.05%)
Australian: 15 (0.05%)
Swiss: 11 (0.04%)
Syrian: 10 (0.03%)
Slovene: 10 (0.03%)
Danish: 10 (0.03%)
Austrian: 10 (0.03%)
Turkish: 5 (0.02%)
Most common places of birth for foreign-born residents (%): Vietnam Pinellas Park:
29.7% (2,712)Florida:
1.3% (60,604)
Cuba Pinellas Park:
9.3% (846)Florida:
22.0% (1,006,576)
Philippines Pinellas Park:
4.8% (443)Florida:
1.8% (84,403)
Mexico Pinellas Park:
4.3% (395)Florida:
5.6% (257,152)
India Pinellas Park:
4.0% (369)Florida:
2.1% (94,349)
Germany Pinellas Park:
3.4% (314)Florida:
1.2% (54,272)
Colombia Pinellas Park:
3.4% (307)Florida:
6.5% (298,669)
Canada Pinellas Park:
3.2% (292)Florida:
2.4% (109,132)
Bosnia and Herzegovina Pinellas Park:
2.8% (259)Florida:
0.2% (8,695)
Laos Pinellas Park:
2.4% (222)Florida:
0.1% (4,073)
Venezuela Pinellas Park:
2.1% (195)Florida:
5.7% (262,042)
China, excluding Hong Kong and Taiwan Pinellas Park:
2.1% (189)Florida:
1.2% (56,071)
Brazil Pinellas Park:
1.9% (173)Florida:
2.7% (122,906)
Thailand Pinellas Park:
1.8% (168)Florida:
0.3% (12,303)
Place of birth for U.S.-born residents:
This state: 19,242Other state: 23,736Northeast: 10,138Midwest: 7,887South: 4,329West: 1,406 87.3% of Pinellas Park residents lived in the same house 1 years ago.
Out of people who lived in different houses, 34.2% lived in this county.
Out of people who lived in different counties, 32.8% lived in Florida.
Pinellas Park:
87.3%State average:
86.3%
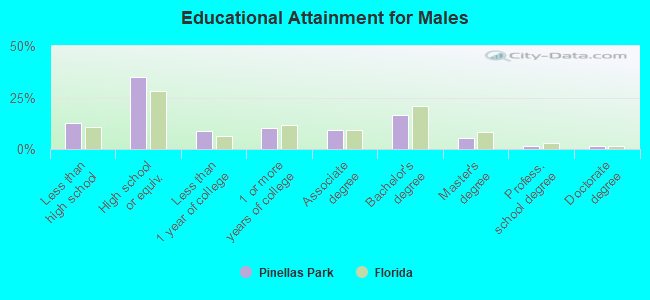
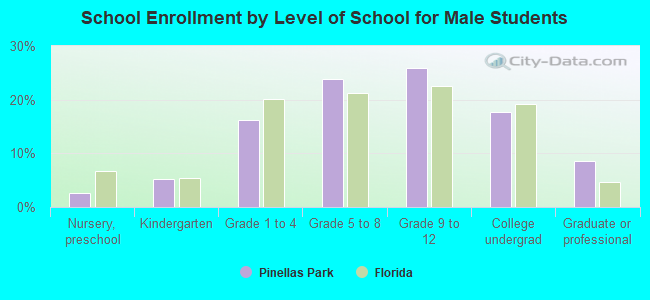
Education attainment for males 25 years and older:
No schooling: 858Nursery to 4th grade: 1595th and 6th grade: 2297th and 8th grade: 2569th grade: 9910th grade: 29611th grade: 20512th grade, no diploma: 356High school graduate (or equivalency): 6,854Less than 1 year of college: 1,724Some college more than 1 year, no degree: 1,977Associate degree: 1,831Bachelor's degree: 3,232Master's degree: 1,097Professional school degree: 241Doctorate degree: 255
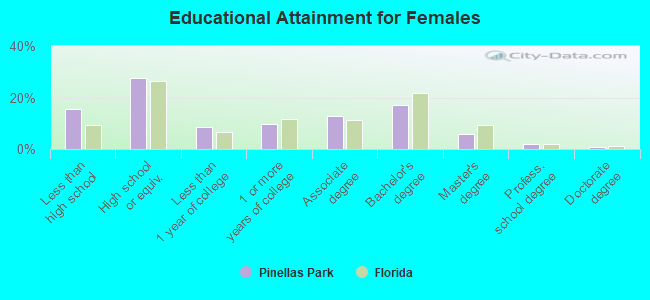
Education attainment for females 25 years and older:
No schooling: 958Nursery to 4th grade: 145th and 6th grade: 3167th and 8th grade: 4429th grade: 22310th grade: 32911th grade: 56712th grade, no diploma: 455High school graduate (or equivalency): 5,768Less than 1 year of college: 1,793Some college more than 1 year, no degree: 2,066Associate degree: 2,673Bachelor's degree: 3,566Master's degree: 1,262Professional school degree: 426Doctorate degree: 166
Housing units in structures:
One, detached: 13,667One, attached: 1,815Two: 6223 or 4: 9815 to 9: 1,20510 to 19: 1,15120 to 49: 71650 or more: 1,140Mobile homes: 3,795Boats, RVs, vans, etc.: 64Median worth of mobile homes: $67,531
Housing units lacking complete plumbing facilities in 2022: 0.5%Housing units lacking complete kitchen facilities in 2022: 1.6%House/condo owner moved in on average 8 years ago
Renter moved in on average 2 years ago
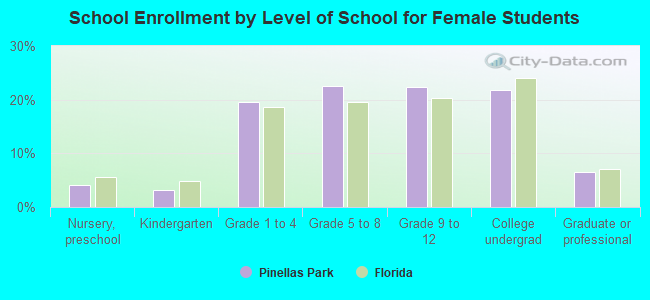
Private vs. public school enrollment:
Students in private schools in grades 1 to 8 (elementary and middle school): 705 Students in private schools in grades 9 to 12 (high school): 237 Students in private undergraduate colleges: 410