Pinetops, NC (North Carolina) Houses and Residents
| Pinetops: | $140,838 |
| North Carolina: | $280,600 |
Mean price in 2022:
Detached houses: $172,597
Here: $172,597 State: $375,326 Mobile homes: $215,865
Here: $215,865 State: $124,933
Total population: 1,338 (Urban population: 0, Rural population: 1,439 (2 farm, 1,437 nonfarm))
Houses: 714 (631 occupied: 333 owner occupied, 307 renter occupied)
| % of renters here: | 48% |
| State: | 33% |
Housing density: 712 houses/condos per square mile
Median price asked for vacant for-sale houses and condos in 2022 in this county: $70,880.
Median contract rent in 2022: $498 (lower quartile is $376, upper quartile is $585)
Median rent asked for vacant for-rent units in 2022: $474
Median gross rent in Pinetops, NC in 2022: $840
Housing units in Pinetops with a mortgage: 127 (0 second mortgage, 0 home equity loan, 0 both second mortgage and home equity loan)
Houses without a mortgage: 11
Median household income for houses/condos with a mortgage: $73,015
Median household income for apartments without a mortgage: $46,091
Median monthly housing costs: $798
Compare current foreclosures near Pinetops, NC:
| Photo | Address | Area | Beds / Baths | Price | Details |
|---|---|---|---|---|---|

|
#1
Faith Baptist Church Rd
Pinetops, NC 27864
|
1,836 sq. feet
|
2 baths 3 beds |
show details | |

|
#2
Us Highway 258 S
Pinetops, NC 27864
|
1,876 sq. feet
|
2 baths 3 beds |
show details | |

|
#3
Us Highway 258 S
Pinetops, NC 27864
|
- sq. feet
|
- baths - beds |
show details | |

|
#4
Faith Baptist Church Rd
Pinetops, NC 27864
|
- sq. feet
|
- baths - beds |
show details | |

|
#5
42-43 Hwy East
Pinetops, NC 27864
|
- sq. feet
|
- baths - beds |
show details | |

|
#6
Nc 1225
Pinetops, NC 27864
|
- sq. feet
|
- baths - beds |
show details | |

|
#7
Bruton Craft Ln
Pinetops, NC 27864
|
- sq. feet
|
- baths - beds |
show details | |

|
#8
Henna St
Rocky Mount, NC 27801
|
1,054 sq. feet
|
1 baths 3 beds |
$135,000
|
show details |

|
#9
Clark St
Rocky Mount, NC 27801
|
1,380 sq. feet
|
1 baths 2 beds |
$185,000
|
show details |

|
#10
Maccripine Rd
Pinetops, NC 27864
|
- sq. feet
|
- baths - beds |
show details |
| Photo | Address | Area | Beds / Baths | Price | Details |
|---|---|---|---|---|---|

|
#11
Nashville Rd
Rocky Mount, NC 27803
|
1,118 sq. feet
|
1 baths 2 beds |
$45,000
|
show details |

|
#12
S Pitt St
Farmville, NC 27828
|
1,240 sq. feet
|
1 baths 3 beds |
show details | |

|
#13
Saddlehorn Dr
Rocky Mount, NC 27803
|
3,109 sq. feet
|
2 baths 3 beds |
show details | |

|
#14
Nc Hwy 91 S
Walstonburg, NC 27888
|
1,412 sq. feet
|
2 baths 3 beds |
show details | |

|
#15
Briggs St S
Wilson, NC 27893
|
1,234 sq. feet
|
1 baths 3 beds |
show details | |

|
#16
Robin Dr
Tarboro, NC 27886
|
1,464 sq. feet
|
1 baths 3 beds |
show details | |

|
#17
Old Wilson Rd
Rocky Mount, NC 27801
|
2,409 sq. feet
|
2 baths 4 beds |
show details | |

|
#18
Ricks Ct E
Wilson, NC 27893
|
1,508 sq. feet
|
2 baths 3 beds |
show details | |

|
#19
Nc Highway 11 N
Bethel, NC 27812
|
1,971 sq. feet
|
2 baths 3 beds |
show details | |

|
#20
York St
Rocky Mount, NC 27803
|
2,106 sq. feet
|
2 baths 5 beds |
show details |
| Photo | Address | Area | Beds / Baths | Price | Details |
|---|---|---|---|---|---|

|
#21
W Thomas St
Rocky Mount, NC 27804
|
1,496 sq. feet
|
1 baths 4 beds |
show details | |

|
#22
Cobb Dail Rd
Farmville, NC 27828
|
1,620 sq. feet
|
2 baths 3 beds |
show details | |

|
#23
Roosevelt Spain Rd
Greenville, NC 27834
|
1,380 sq. feet
|
1 baths 3 beds |
show details | |

|
#24
Fitch Dr E
Wilson, NC 27893
|
1,500 sq. feet
|
2 baths 3 beds |
show details | |

|
#25
Dalton St
Tarboro, NC 27886
|
1,404 sq. feet
|
2 baths 3 beds |
show details | |

|
#26
Terrace Dr NE
Elm City, NC 27822
|
1,223 sq. feet
|
1 baths 3 beds |
show details | |

|
#27
Tracey Cir
Greenville, NC 27834
|
1,782 sq. feet
|
2 baths 3 beds |
show details | |

|
#28
Heard Rd N
Wilson, NC 27896
|
1,389 sq. feet
|
2 baths 3 beds |
show details | |

|
#29
Holly Trl
Wilson, NC 27893
|
1,436 sq. feet
|
1 baths 3 beds |
show details | |

|
#30
River Glenn Rd
Rocky Mount, NC 27803
|
2,041 sq. feet
|
3 baths 4 beds |
show details |
| Photo | Address | Area | Beds / Baths | Price | Details |
|---|---|---|---|---|---|

|
#31
Roosevelt Spain Rd
Greenville, NC 27834
|
1,328 sq. feet
|
1 baths 3 beds |
show details | |

|
#32
Carolina St E
Wilson, NC 27893
|
850 sq. feet
|
1 baths 2 beds |
show details | |

|
#33
Drexel Rd
Rocky Mount, NC 27803
|
1,320 sq. feet
|
2 baths 3 beds |
show details | |

|
#34
Stanton Dr
Greenville, NC 27834
|
1,160 sq. feet
|
1 baths 3 beds |
show details | |

|
#35
Lucas Cir
Rocky Mount, NC 27801
|
1,568 sq. feet
|
2 baths 3 beds |
show details | |

|
#36
Katherines Pl
Greenville, NC 27834
|
1,890 sq. feet
|
2 baths 4 beds |
show details | |

|
#37
Madison St
Rocky Mount, NC 27801
|
1,711 sq. feet
|
1 baths 3 beds |
show details | |

|
#38
Tarboro St
Rocky Mount, NC 27801
|
1,874 sq. feet
|
1 baths 3 beds |
show details | |

|
#39
Eastern Ave
Rocky Mount, NC 27801
|
1,496 sq. feet
|
2 baths 3 beds |
show details | |

|
#40
Gwen St
Rocky Mount, NC 27803
|
1,353 sq. feet
|
1 baths 3 beds |
show details |
| Photo | Address | Area | Beds / Baths | Price | Details |
|---|---|---|---|---|---|

|
#41
Stokes Rd
Greenville, NC 27834
|
2,079 sq. feet
|
2 baths 4 beds |
show details | |

|
#42
Tammy Ln
Wilson, NC 27893
|
1,890 sq. feet
|
2 baths 4 beds |
show details | |

|
#43
Lewis Store Rd
Farmville, NC 27828
|
1,302 sq. feet
|
1 baths 3 beds |
show details | |

|
#44
Matthews St
Rocky Mount, NC 27801
|
1,092 sq. feet
|
1 baths 2 beds |
show details | |

|
#45
Peggy Ct
Rocky Mount, NC 27803
|
1,776 sq. feet
|
2 baths 3 beds |
show details | |

|
#46
Eagles Crossroads Rd
Walstonburg, NC 27888
|
1,496 sq. feet
|
2 baths 4 beds |
show details | |

|
#47
William Ct
Rocky Mount, NC 27803
|
1,370 sq. feet
|
2 baths 3 beds |
show details | |

|
#48
Allen St
Farmville, NC 27828
|
1,520 sq. feet
|
2 baths 3 beds |
show details | |

|
#49
Leggett Rd
Rocky Mount, NC 27801
|
1,025 sq. feet
|
1 baths 3 beds |
show details | |

|
Check over 1 million property listings on Foreclosure.com!
|
browse all offers | |||

Latest news about housing in Pinetops, NC collected exclusively by city-data.com from local newspapers, TV, and radio stations

 | Place to buy a half a cow in NC? (38 replies) |
| Tarboro (22 replies) |
| Towns in North Carolina with unique names (30 replies) |
| where is the best place to raise a family in NC or Virginia? (6 replies) |
| What about Wilmington? Or Myrtle Beach? (14 replies) |

Median year apartment built: 1974
Household type by relationship:
Households: 1,404- Male householders: 166 (58 living alone), Female householders: 458 (111 living alone)
184 spouses (184 opposite-sex spouses), 0 unmarried partners, (0 opposite-sex unmarried partners), 409 children (394 natural, 15 adopted, 0 stepchildren), 88 grandchildren, 13 brothers or sisters, 18 parents, 0 foster children, 20 other relatives, 42 non-relatives
Size of family households: 266 2-persons, 63 3-persons, 77 4-persons, 17 5-persons, 12 6-persons.
Size of nonfamily households: 172 1-person, 19 2-persons, 11 3-persons.
80 married couples with children.
164 single-parent households (0 men, 164 women).
94.6% of residents of Pinetops speak English at home.
4.9% of residents speak Spanish at home (74% speak English very well, 8% speak English not well, 18% don't speak English at all).
Foreign born population: 26 (1.9%)
(57.7% of them are naturalized citizens)
| Here: | 5.9 |
| State: | 6.4 |
| Here: | 5.6 |
| State: | 4.4 |

- Bedrooms in owner-occupied houses and condos in Pinetops, North Carolina
- 0no bedroom
- 01 bedroom
- 442 bedrooms
- 2003 bedrooms
- 844 bedrooms
- 55+ bedrooms

- Bedrooms in renter-occupied apartments in Pinetops, North Carolina
- 7no bedroom
- 171 bedroom
- 622 bedrooms
- 2113 bedrooms
- 124 bedrooms
- 05+ bedrooms

- Cars and other vehicles available in Pinetops in owner-occupied houses/condos
- 12no vehicle
- 1341 vehicle
- 1182 vehicles
- 363 vehicles
- 294 vehicles
- 45+ vehicles

- Cars and other vehicles available in Pinetops in renter-occupied apartments
- 30no vehicle
- 1171 vehicle
- 1512 vehicles
- 43 vehicles
- 54 vehicles
- 05+ vehicles

- Rooms in owner-occupied houses in Pinetops, North Carolina
- 01 room
- 02 rooms
- 163 rooms
- 104 rooms
- 1065 rooms
- 866 rooms
- 447 rooms
- 618 rooms
- 109+ rooms

- Rooms in renter-occupied apartments in Pinetops, North Carolina
- 71 room
- 02 rooms
- 233 rooms
- 584 rooms
- 545 rooms
- 1186 rooms
- 357 rooms
- 08 rooms
- 139+ rooms


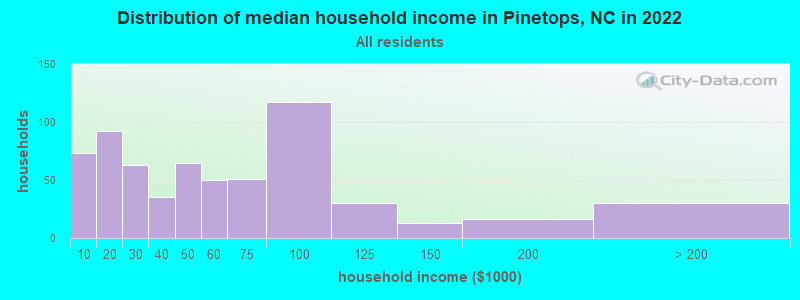
Pinetops, NC household income distribution

- 73Less than $10,000
- 92$10,000 to $19,999
- 63$20,000 to $29,999
- 35$30,000 to $39,999
- 65$40,000 to $49,999
- 50$50,000 to $59,999
- 51$60,000 to $74,999
- 117$75,000 to $99,999
- 30$100,000 to $124,999
- 13$125,000 to $149,999
- 16$150,000 to $199,999
- 30$200,000 or more
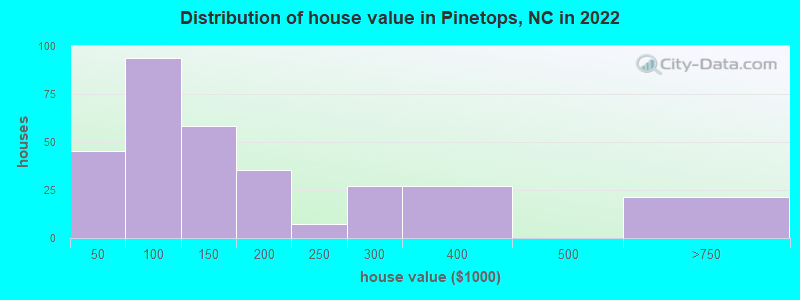
Home value of owner - occupied houses in 2022 in Pinetops, NC
-
- 6Less than $10,000
- 8$15,000 to $19,999
- 5$25,000 to $29,999
- 25$40,000 to $49,999
- 6$50,000 to $59,999
- 12$60,000 to $69,999
- 5$70,000 to $79,999
- 31$80,000 to $89,999
- 11$90,000 to $99,999
- 32$100,000 to $124,999
- 25$125,000 to $149,999
- 20$150,000 to $174,999
- 15$175,000 to $199,999
- 7$200,000 to $249,999
- 26$250,000 to $299,999
- 26$300,000 to $399,999
- 21$500,000 to $749,999
Rent paid by renters in 2022 in Pinetops, NC
-
- 6Less than $100
- 10$100 to $149
- 15$150 to $199
- 15$200 to $249
- 3$250 to $299
- 50$350 to $399
- 17$400 to $449
- 20$450 to $499
- 72$500 to $549
- 12$550 to $599
- 7$600 to $649
- 6$700 to $749
- 10$750 to $799
- 7$800 to $899
- 29No cash rent


Percentage of workers working in this county: 65.3%
Number of people working at home: 42 (8.1% of all workers)
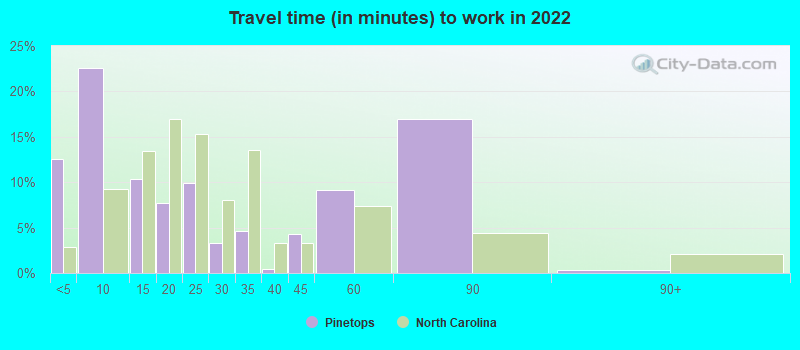
Travel time to work (commute)
- Less than 5 minutes: 21
- 5 to 9 minutes: 128
- 10 to 14 minutes: 18
- 15 to 19 minutes: 52
- 20 to 24 minutes: 50
- 25 to 29 minutes: 6
- 30 to 34 minutes: 150
- 35 to 39 minutes: 6
- 40 to 44 minutes: 5
- 45 to 59 minutes: 2
- 60 to 89 minutes: 4
- 90 or more minutes: 14
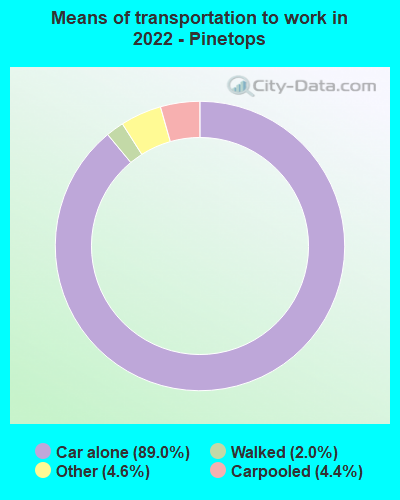
Means of transportation to work:
- Drove a car alone: 596 (81.9%)
- Carpooled: 30 (4.1%)
- Taxi: 36 (4.9%)
- Walked: 12 (1.6%)
- Worked at home: 17 (2.3%)

- Unemployment by race in 2022
- Unemployment rate for White non-Hispanic residents
- 2.9%Males
- 7.1%Females
- Unemployment rate for Black residents
- 3.6%Males
- 3.6%Females

- Year of entry for the foreign-born population in Pinetops, North Carolina
- 132010 or later
- 82000 to 2009
- 01990 to 1999
- 31980 to 1989
- 21970 to 1979
- 0Before 1970

First ancestries reported:
- American: 188 (17.2%)
- Irish: 50 (4.6%)
- Italian: 28 (2.6%)
- German: 15 (1.4%)
- English: 7 (0.6%)
- Scotch-Irish: 5 (0.5%)
- Scottish: 3 (0.3%)
Most common places of birth for foreign-born residents (%):
| Pinetops: | 76.9% (20) |
| North Carolina: | 2.6% (22,964) |
| Pinetops: | 38.5% (10) |
| North Carolina: | 0.3% (2,644) |
Place of birth for U.S.-born residents:
- This state: 1,178
- Other state: 176
- Northeast: 74
- Midwest: 13
- South: 82
- West: 6
87.4% of Pinetops residents lived in the same house 1 years ago.
Out of people who lived in different houses, 30.0% lived in this county.
Out of people who lived in different counties, 67.0% lived in North Carolina.
| Pinetops: | 87.4% |
| State average: | 87.3% |
Education attainment for males 25 years and older:
- No schooling: 0
- Nursery to 4th grade: 0
- 5th and 6th grade: 3
- 7th and 8th grade: 11
- 9th grade: 5
- 10th grade: 18
- 11th grade: 8
- 12th grade, no diploma: 6
- High school graduate (or equivalency): 209
- Less than 1 year of college: 14
- Some college more than 1 year, no degree: 39
- Associate degree: 34
- Bachelor's degree: 38
- Master's degree: 13
- Professional school degree: 9
- Doctorate degree: 0

Education attainment for females 25 years and older:
- No schooling: 0
- Nursery to 4th grade: 0
- 5th and 6th grade: 4
- 7th and 8th grade: 6
- 9th grade: 9
- 10th grade: 6
- 11th grade: 78
- 12th grade, no diploma: 0
- High school graduate (or equivalency): 214
- Less than 1 year of college: 34
- Some college more than 1 year, no degree: 96
- Associate degree: 36
- Bachelor's degree: 68
- Master's degree: 8
- Professional school degree: 0
- Doctorate degree: 0


Housing units in structures:
- One, detached: 530
- Two: 30
- 3 or 4: 16
- 5 to 9: 66
- Mobile homes: 70
Median worth of mobile homes: $105,498
Housing units lacking complete kitchen facilities in 2022: 1.2%
House/condo owner moved in on average 21 years ago
Renter moved in on average 6 years ago

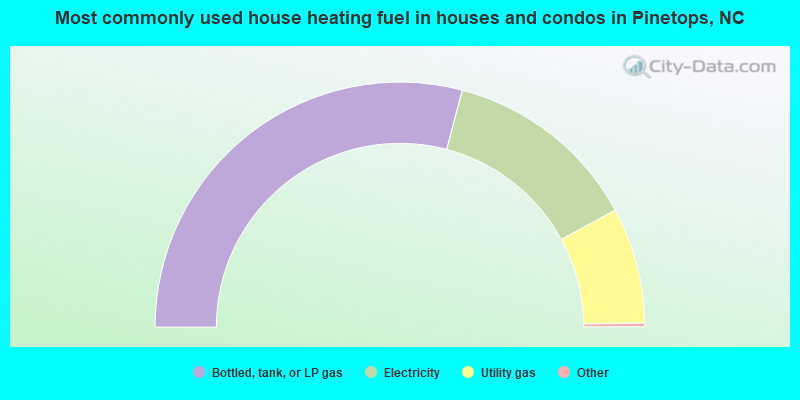
- 58.5%Bottled, tank, or LP gas
- 26.1%Electricity
- 15.4%Utility gas
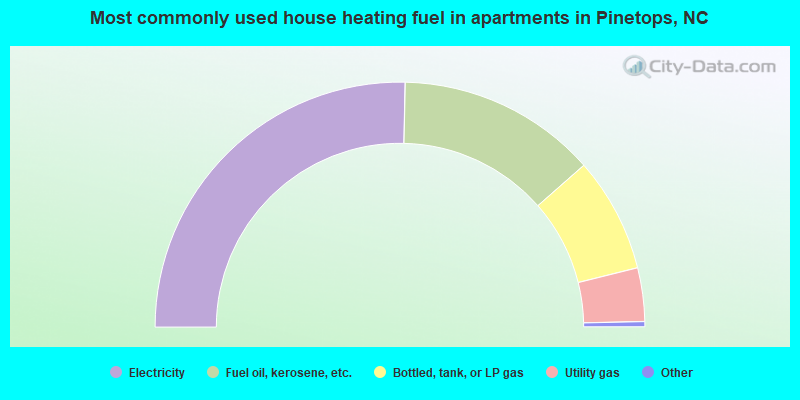
- 51.0%Electricity
- 26.5%Fuel oil, kerosene, etc.
- 15.3%Bottled, tank, or LP gas
- 7.1%Utility gas
Private vs. public school enrollment:
| Here: | 11.1% |
| North Carolina: | 13.8% |
| Here: | 0.0% |
| North Carolina: | 11.9% |
| Here: | 0.0% |
| North Carolina: | 19.3% |


