Housing density: 1,405 houses/condos per square mile
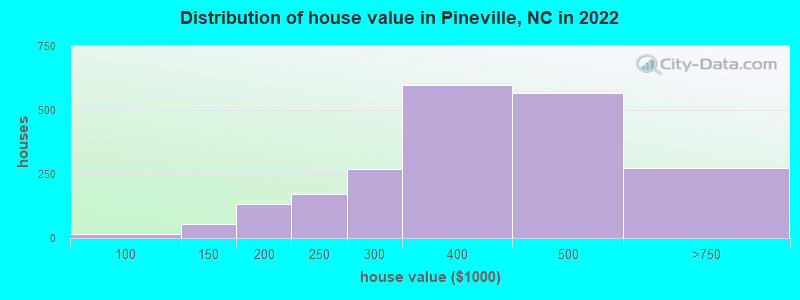
Median price asked for vacant for-sale houses and condos in 2022 in this county: $500,447.
Median contract rent in 2022: $1,288 (lower quartile is $1,113, upper quartile is $1,610)
Median rent asked for vacant for-rent units in 2022: $1,128
Median gross rent in Pineville, NC in 2022: $1,424
Housing units in Pineville with a mortgage: 1,846 (48 second mortgage, 0 home equity loan, 44 both second mortgage and home equity loan) Houses without a mortgage: 7
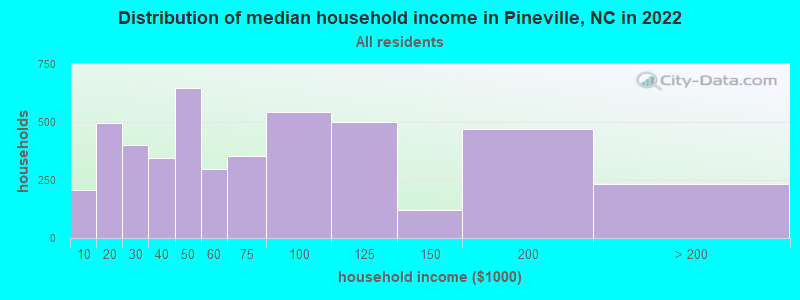
Median household income for houses/condos with a mortgage: $102,843
Median household income for apartments without a mortgage: $56,018
Median monthly housing costs: $1,418
Compare current foreclosures near Pineville, NC:
#1
Aileen Cir
Pineville, NC 28134
768
sq. feet
1
baths
2
beds
#2
Aileen Cir
Pineville, NC 28134
-
sq. feet
-
baths
-
beds
#3
Borgin Way
Pineville, NC 28134
-
sq. feet
-
baths
-
beds
#4
Shoehorn St
Pineville, NC 28134
-
sq. feet
-
baths
-
beds
#5
Bluffton Ct
Pineville, NC 28134
-
sq. feet
-
baths
-
beds
#6
Glenway Trail Ct
Pineville, NC 28134
-
sq. feet
-
baths
-
beds
#7
Atwell Glen Ln
Pineville, NC 28134
-
sq. feet
-
baths
-
beds
#8
Glenway Trl Ct
Pineville, NC 28134
-
sq. feet
-
baths
-
beds
#9
Windy Knoll Ln
Charlotte, NC 28227
3,621
sq. feet
5
baths
4
beds
#10
Fort Mill Highway , Indian Land, Sc 29707 Aka 806 Fort Mill Highway
Size of family households: 1,080 2-persons, 751 3-persons, 200 4-persons, 159 5-persons, 317 6-persons, 1 7-or-more-persons.
Size of nonfamily households: 1,988 1-person, 261 2-persons, 3 3-persons.
1,010 married couples with children.
863 single-parent households (161 men, 702 women).
77.8% of residents of Pineville speak English at home.
16.5% of residents speak Spanish at home (59% speak English very well, 24% speak English well, 4% speak English not well, 13% don't speak English at all).
2.8% of residents speak other Indo-European language at home (45% speak English very well, 12% speak English well, 7% speak English not well, 35% don't speak English at all).
3.2% of residents speak Asian or Pacific Island language at home (67% speak English very well, 26% speak English well, 7% speak English not well).
0.4% of residents speak other language at home (100% speak English very well).
Foreign born population: 1,656 (15.3%)
(47.0% of them are naturalized citizens)
Year of entry for the foreign-born population in Pineville, North Carolina
7582010 or later
3782000 to 2009
3181990 to 1999
681980 to 1989
61970 to 1979
40Before 1970
First ancestries reported:
African: 802 (13.8%)
English: 355 (6.1%)
American: 256 (4.4%)
German: 205 (3.5%)
Irish: 169 (2.9%)
Italian: 129 (2.2%)
Norwegian: 85 (1.5%)
Scotch-Irish: 69 (1.2%)
Scottish: 51 (0.9%)
Russian: 49 (0.8%)
French: 42 (0.7%)
European: 40 (0.7%)
British: 32 (0.5%)
Jamaican: 29 (0.5%)
Arab: 26 (0.4%)
Northern European: 25 (0.4%)
Polish: 17 (0.3%)
Hungarian: 13 (0.2%)
Slovak: 12 (0.2%)
Swedish: 12 (0.2%)
Portuguese: 11 (0.2%)
Welsh: 11 (0.2%)
Greek: 10 (0.2%)
Pennsylvania German: 10 (0.2%)
Haitian: 10 (0.2%)
Australian: 9 (0.2%)
West Indian: 9 (0.2%)
Eastern European: 5 (0.09%)
Canadian: 3 (0.05%)
Most common places of birth for foreign-born residents (%):
Venezuela
Pineville:
35.1% (609)
North Carolina:
1.2% (9,986)
Honduras
Pineville:
22.8% (395)
North Carolina:
4.7% (40,707)
India
Pineville:
13.4% (233)
North Carolina:
9.3% (80,594)
Indonesia
Pineville:
3.5% (60)
North Carolina:
0.2% (1,923)
Colombia
Pineville:
3.4% (59)
North Carolina:
2.1% (18,275)
Mexico
Pineville:
3.2% (55)
North Carolina:
24.7% (214,776)
Ecuador
Pineville:
3.1% (54)
North Carolina:
0.9% (7,765)
Korea
Pineville:
2.8% (49)
North Carolina:
1.8% (15,988)
Russia
Pineville:
2.3% (39)
North Carolina:
0.9% (8,067)
Dominican Republic
Pineville:
1.9% (33)
North Carolina:
1.7% (15,135)
Jamaica
Pineville:
1.8% (31)
North Carolina:
1.3% (11,419)
Philippines
Pineville:
1.6% (28)
North Carolina:
2.4% (20,695)
Taiwan
Pineville:
1.6% (28)
North Carolina:
0.4% (3,524)
Place of birth for U.S.-born residents:
This state: 3,775
Other state: 5,310
Northeast: 1,717
Midwest: 1,173
South: 1,995
West: 414
79.5% of Pineville residents lived in the same house 1 years ago. Out of people who lived in different houses, 37.6% lived in this county. Out of people who lived in different counties, 43.2% lived in North Carolina.
Pineville:
79.5%
State average:
87.3%
Education attainment for males 25 years and older:
No schooling: 17
Nursery to 4th grade: 0
5th and 6th grade: 39
7th and 8th grade: 30
9th grade: 36
10th grade: 25
11th grade: 55
12th grade, no diploma: 12
High school graduate (or equivalency): 473
Less than 1 year of college: 186
Some college more than 1 year, no degree: 486
Associate degree: 230
Bachelor's degree: 949
Master's degree: 353
Professional school degree: 30
Doctorate degree: 10
Education attainment for females 25 years and older:
No schooling: 84
Nursery to 4th grade: 0
5th and 6th grade: 0
7th and 8th grade: 16
9th grade: 19
10th grade: 0
11th grade: 8
12th grade, no diploma: 11
High school graduate (or equivalency): 647
Less than 1 year of college: 213
Some college more than 1 year, no degree: 1,013
Associate degree: 328
Bachelor's degree: 1,614
Master's degree: 464
Professional school degree: 40
Doctorate degree: 11
Housing units in structures:
One, detached: 1,769
One, attached: 1,019
Two: 7
3 or 4: 110
5 to 9: 295
10 to 19: 719
20 to 49: 627
50 or more: 470
Housing units lacking complete plumbing facilities in 2022: 0.2%
Housing units lacking complete kitchen facilities in 2022: 4.9%