Piru, CA (California) Houses and Residents
| Piru: | $517,800 |
| California: | $715,900 |
Mean price in 2022:
Detached houses: $519,316
Here: $519,316 State: $988,808 Townhouses or other attached units: $181,826
Here: $181,826 State: $838,546 Mobile homes: $582,991
Here: $582,991 State: $184,506
Total population: 2,063 (Urban population: 0, Rural population: 1,164 (13 farm, 1,151 nonfarm))
Houses: 689 (627 occupied: 364 owner occupied, 263 renter occupied)
| % of renters here: | 42% |
| State: | 44% |
Housing density: 296 houses/condos per square mile
Median price asked for vacant for-sale houses and condos in 2022 in this county: $1,328,053.
Median contract rent in 2022: $1,203 (lower quartile is $916, upper quartile is $1,982)
Median rent asked for vacant for-rent units in 2022: $1,159
Median gross rent in Piru, CA in 2022: $1,379
Housing units in Piru with a mortgage: 279 (0 second mortgage, 0 home equity loan, 0 both second mortgage and home equity loan)
Houses without a mortgage: 0
Median household income for houses/condos with a mortgage: $97,596
Median monthly housing costs: $1,589
Compare current foreclosures near Piru, CA:
| Photo | Address | Area | Beds / Baths | Price | Details |
|---|---|---|---|---|---|

|
#1
Temescal St
Piru, CA 93040
|
- sq. feet
|
- baths - beds |
show details | |

|
#2
Campus Park Dr Apt A
Moorpark, CA 93021
|
1,029 sq. feet
|
2 baths 2 beds |
show details | |

|
#3
Kilfinan St
Northridge, CA 91326
|
2,814 sq. feet
|
3 baths 4 beds |
show details | |

|
#4
Muledeer Ln
Castaic, CA 91384
|
1,736 sq. feet
|
3 baths 4 beds |
show details | |

|
#5
Aquarius Ave
Agoura Hills, CA 91301
|
2,347 sq. feet
|
3 baths 5 beds |
show details | |

|
#6
Center Ln
Santa Paula, CA 93060
|
1,250 sq. feet
|
2 baths 3 beds |
show details | |

|
#7
Alamo St Unit 1
Simi Valley, CA 93063
|
531 sq. feet
|
1 baths 1 beds |
show details | |

|
#8
Laramie Ave
Chatsworth, CA 91311
|
1,479 sq. feet
|
2 baths 4 beds |
show details | |

|
#9
Church St
Simi Valley, CA 93065
|
1,303 sq. feet
|
2 baths 3 beds |
show details | |

|
#10
Roosevelt Ct
Simi Valley, CA 93065
|
3,691 sq. feet
|
3 baths 4 beds |
show details |
| Photo | Address | Area | Beds / Baths | Price | Details |
|---|---|---|---|---|---|

|
#11
Elderberry Ave
Moorpark, CA 93021
|
1,587 sq. feet
|
2 baths 3 beds |
show details | |

|
#12
June Rose Ct
Castaic, CA 91384
|
2,957 sq. feet
|
3 baths 4 beds |
show details | |

|
#13
Coulter Ct
Simi Valley, CA 93065
|
1,596 sq. feet
|
2 baths 5 beds |
show details | |

|
#14
Bryce Dr
Castaic, CA 91384
|
1,897 sq. feet
|
3 baths 4 beds |
show details | |

|
#15
Mira Sol Dr
Moorpark, CA 93021
|
1,644 sq. feet
|
2 baths 3 beds |
show details | |

|
#16
Bridlewood Dr
Castaic, CA 91384
|
2,230 sq. feet
|
3 baths 4 beds |
show details | |

|
#17
White Wing Way
Santa Clarita, CA 91350
|
2,328 sq. feet
|
3 baths 5 beds |
show details | |

|
#18
Walnut Ave
Simi Valley, CA 93063
|
2,275 sq. feet
|
2 baths 4 beds |
show details | |

|
#19
Susan Beth Way Unit C
Santa Clarita, CA 91350
|
- sq. feet
|
1 baths 2 beds |
show details | |

|
#20
Katherine St
Simi Valley, CA 93063
|
1,835 sq. feet
|
2 baths 4 beds |
show details |
| Photo | Address | Area | Beds / Baths | Price | Details |
|---|---|---|---|---|---|

|
#21
Loire Valley Dr
Simi Valley, CA 93065
|
5,100 sq. feet
|
5 baths 4 beds |
show details | |

|
#22
Wolfe Cir
Stevenson Ranch, CA 91381
|
2,363 sq. feet
|
3 baths 4 beds |
show details | |

|
#23
Lenope Pl
Chatsworth, CA 91311
|
5,307 sq. feet
|
6 baths 5 beds |
show details | |

|
#24
Harmony Way
Santa Clarita, CA 91390
|
3,354 sq. feet
|
3 baths 4 beds |
show details | |

|
#25
Hacienda Ranch Ct
Valencia, CA 91354
|
4,005 sq. feet
|
5 baths 5 beds |
show details | |

|
#26
Hammond Ct
Valencia, CA 91354
|
2,071 sq. feet
|
3 baths 4 beds |
show details | |

|
#27
Francisco Way
Valencia, CA 91354
|
3,152 sq. feet
|
3 baths 5 beds |
show details | |

|
#28
Cherry St
Newhall, CA 91321
|
2,352 sq. feet
|
3 baths 4 beds |
show details | |

|
#29
Sycamore St
Santa Paula, CA 93060
|
720 sq. feet
|
1 baths 2 beds |
show details | |

|
#30
Thorn Ridge Ct
Simi Valley, CA 93063
|
4,346 sq. feet
|
4 baths 5 beds |
show details |
| Photo | Address | Area | Beds / Baths | Price | Details |
|---|---|---|---|---|---|

|
#31
Quartz Ln
Castaic, CA 91384
|
1,536 sq. feet
|
2 baths 3 beds |
show details | |

|
#32
Pocahantas Dr
Castaic, CA 91384
|
1,590 sq. feet
|
2 baths 3 beds |
show details | |

|
#33
Vicky Ave
Canoga Park, CA 91304
|
1,639 sq. feet
|
3 baths 4 beds |
show details | |

|
#34
Sycamore Dr
Santa Clarita, CA 91350
|
1,867 sq. feet
|
3 baths 4 beds |
show details | |

|
#35
Hacienda Ranch Ct
Valencia, CA 91354
|
4,005 sq. feet
|
4 baths 3 beds |
show details | |

|
#36
Bridgewood Ln
Thousand Oaks, CA 91362
|
1,465 sq. feet
|
2 baths 2 beds |
show details | |

|
#37
Mcbean Pkwy Unit 53
Valencia, CA 91355
|
1,178 sq. feet
|
2 baths 2 beds |
show details | |

|
#38
Market St
Fillmore, CA 93015
|
1,545 sq. feet
|
1 baths 4 beds |
show details | |

|
#39
Acacia Dr
Valencia, CA 91354
|
1,352 sq. feet
|
2 baths 2 beds |
show details | |

|
#40
Avenida Crescenta
Valencia, CA 91355
|
1,817 sq. feet
|
2 baths 4 beds |
show details |
| Photo | Address | Area | Beds / Baths | Price | Details |
|---|---|---|---|---|---|

|
#41
Leora St
Simi Valley, CA 93063
|
2,081 sq. feet
|
3 baths 3 beds |
show details | |

|
#42
Golden Canyon Cir
Chatsworth, CA 91311
|
1,586 sq. feet
|
3 baths 3 beds |
show details | |

|
#43
King St
Fillmore, CA 93015
|
1,148 sq. feet
|
2 baths 3 beds |
show details | |

|
#44
Calle Madreselva
Thousand Oaks, CA 91360
|
979 sq. feet
|
1 baths 3 beds |
show details | |

|
#45
Sale Ave
Canoga Park, CA 91304
|
1,882 sq. feet
|
2 baths 4 beds |
show details | |

|
#46
Big Cloud Cir
Thousand Oaks, CA 91360
|
1,858 sq. feet
|
3 baths 5 beds |
show details | |

|
#47
Lynette Ln
Santa Clarita, CA 91350
|
1,863 sq. feet
|
2 baths 4 beds |
show details | |

|
#48
Dearborn Dr
Valencia, CA 91354
|
1,804 sq. feet
|
3 baths 3 beds |
show details | |

|
#49
San Fran Cyn/montana
Santa Clarita, CA 91350
|
- sq. feet
|
- baths - beds |
$4,638
|
show details |

|
Check over 1 million property listings on Foreclosure.com!
|
browse all offers | |||

Latest news about housing in Piru, CA collected exclusively by city-data.com from local newspapers, TV, and radio stations


Median year apartment built: 1994
Household type by relationship:
Households: 2,157- Male householders: 263 (13 living alone), Female householders: 352 (44 living alone)
400 spouses (400 opposite-sex spouses), 48 unmarried partners, (48 opposite-sex unmarried partners), 810 children (803 natural, 0 adopted, 6 stepchildren), 92 grandchildren, 0 brothers or sisters, 83 parents, 8 foster children, 63 other relatives, 34 non-relatives
Size of family households: 142 2-persons, 158 3-persons, 126 4-persons, 44 5-persons, 32 6-persons, 27 7-or-more-persons.
Size of nonfamily households: 59 1-person, 29 2-persons, 13 3-persons.
356 married couples with children.
111 single-parent households (15 men, 96 women).
27.0% of residents of Piru speak English at home.
73.2% of residents speak Spanish at home (50% speak English very well, 18% speak English well, 16% speak English not well, 17% don't speak English at all).
0.5% of residents speak other language at home (100% speak English very well).
Foreign born population: 689 (31.9%)
(42.4% of them are naturalized citizens)
| Here: | 5.3 |
| State: | 6.0 |
| Here: | 5.0 |
| State: | 3.9 |

- Bedrooms in owner-occupied houses and condos in Piru, California
- 0no bedroom
- 181 bedroom
- 682 bedrooms
- 1723 bedrooms
- 1034 bedrooms
- 45+ bedrooms

- Bedrooms in renter-occupied apartments in Piru, California
- 13no bedroom
- 31 bedroom
- 662 bedrooms
- 1303 bedrooms
- 524 bedrooms
- 05+ bedrooms

- Cars and other vehicles available in Piru in owner-occupied houses/condos
- 0no vehicle
- 1061 vehicle
- 1082 vehicles
- 183 vehicles
- 1064 vehicles
- 265+ vehicles

- Cars and other vehicles available in Piru in renter-occupied apartments
- 13no vehicle
- 741 vehicle
- 1242 vehicles
- 333 vehicles
- 124 vehicles
- 75+ vehicles

- Rooms in owner-occupied houses in Piru, California
- 01 room
- 02 rooms
- 183 rooms
- 514 rooms
- 1425 rooms
- 1016 rooms
- 387 rooms
- 158 rooms
- 09+ rooms

- Rooms in renter-occupied apartments in Piru, California
- 131 room
- 02 rooms
- 143 rooms
- 224 rooms
- 1265 rooms
- 586 rooms
- 307 rooms
- 08 rooms
- 09+ rooms


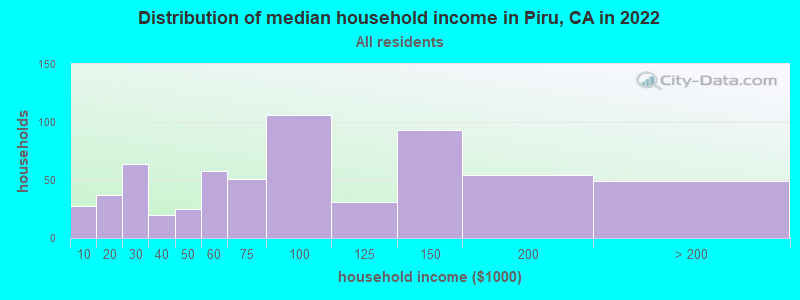
Piru, CA household income distribution

- 28Less than $10,000
- 37$10,000 to $19,999
- 64$20,000 to $29,999
- 20$30,000 to $39,999
- 25$40,000 to $49,999
- 58$50,000 to $59,999
- 51$60,000 to $74,999
- 106$75,000 to $99,999
- 31$100,000 to $124,999
- 93$125,000 to $149,999
- 54$150,000 to $199,999
- 49$200,000 or more
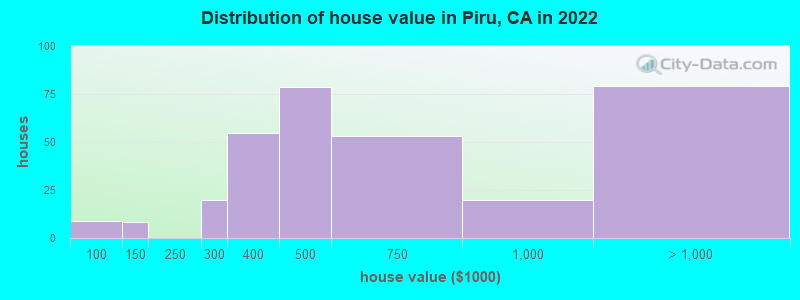
Home value of owner - occupied houses in 2022 in Piru, CA
-
- 8$90,000 to $99,999
- 8$100,000 to $124,999
- 19$250,000 to $299,999
- 54$300,000 to $399,999
- 78$400,000 to $499,999
- 52$500,000 to $749,999
- 19$750,000 to $999,999
- 69$1,000,000 to $1,499,999
- 10$2,000,000 or more
Rent paid by renters in 2022 in Piru, CA
-
- 7$250 to $299
- 8$300 to $349
- 8$550 to $599
- 4$700 to $749
- 4$800 to $899
- 59$900 to $999
- 15$1,000 to $1,249
- 5$1,250 to $1,499
- 47$1,500 to $1,999
- 17$2,000 to $2,499
- 8$2,500 to $2,999
- 25$3,500 or more
- 29No cash rent


Percentage of workers working in this county: 73.7%
Number of people working at home: 134 (12.8% of all workers)
Travel time to work (commute)
- Less than 5 minutes: 22
- 5 to 9 minutes: 100
- 10 to 14 minutes: 79
- 15 to 19 minutes: 96
- 20 to 24 minutes: 161
- 25 to 29 minutes: 59
- 30 to 34 minutes: 132
- 35 to 39 minutes: 0
- 40 to 44 minutes: 68
- 45 to 59 minutes: 86
- 60 to 89 minutes: 35
- 90 or more minutes: 65
Means of transportation to work:
- Drove a car alone: 354 (82.5%)
- Carpooled: 45 (10.5%)
- Walked: 9 (2.1%)
- Other means: 7 (1.6%)
- Worked at home: 14 (3.3%)

- Unemployment by race in 2022
- Unemployment rate for White non-Hispanic residents
- 10.9%Females
- Unemployment rate for two or more race residents
- 6.2%Males
- Unemployment rate for Hispanic or Latino residents
- 4.2%Males
- 8.4%Females

- Year of entry for the foreign-born population in Piru, California
- 1082010 or later
- 552000 to 2009
- 1731990 to 1999
- 581980 to 1989
- 711970 to 1979
- 46Before 1970

First ancestries reported:
- French: 30 (1.7%)
- Scottish: 19 (1.1%)
- Irish: 18 (1.0%)
- American: 9 (0.5%)
- Syrian: 9 (0.5%)
- German: 7 (0.4%)
- English: 4 (0.2%)
Most common places of birth for foreign-born residents (%):
| Piru: | 94.7% (628) |
| California: | 37.2% (3,881,193) |
| Piru: | 2.7% (18) |
| California: | 1.2% (127,477) |
Place of birth for U.S.-born residents:
- This state: 1,360
- Other state: 102
- Northeast: 17
- Midwest: 33
- South: 39
- West: 11
95.7% of Piru residents lived in the same house 1 years ago.
Out of people who lived in different houses, 35.8% lived in this county.
Out of people who lived in different counties, 71.4% lived in California.
| Piru: | 95.7% |
| State average: | 88.9% |
Education attainment for males 25 years and older:
- No schooling: 44
- Nursery to 4th grade: 107
- 5th and 6th grade: 87
- 7th and 8th grade: 14
- 9th grade: 0
- 10th grade: 16
- 11th grade: 19
- 12th grade, no diploma: 20
- High school graduate (or equivalency): 105
- Less than 1 year of college: 56
- Some college more than 1 year, no degree: 89
- Associate degree: 43
- Bachelor's degree: 67
- Master's degree: 38
- Professional school degree: 0
- Doctorate degree: 0

Education attainment for females 25 years and older:
- No schooling: 27
- Nursery to 4th grade: 46
- 5th and 6th grade: 90
- 7th and 8th grade: 0
- 9th grade: 9
- 10th grade: 20
- 11th grade: 12
- 12th grade, no diploma: 14
- High school graduate (or equivalency): 199
- Less than 1 year of college: 36
- Some college more than 1 year, no degree: 113
- Associate degree: 36
- Bachelor's degree: 61
- Master's degree: 4
- Professional school degree: 0
- Doctorate degree: 0


Housing units in structures:
- One, detached: 476
- One, attached: 26
- 3 or 4: 103
- 5 to 9: 19
- 10 to 19: 3
- 20 to 49: 13
- 50 or more: 6
- Mobile homes: 28
- Boats, RVs, vans, etc.: 13
Housing units lacking complete kitchen facilities in 2022: 4.2%
House/condo owner moved in on average 17 years ago
Renter moved in on average 6 years ago

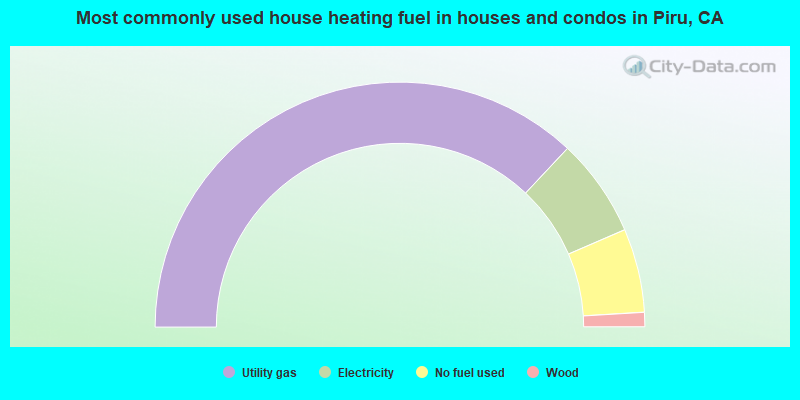
- 74.0%Utility gas
- 13.0%Electricity
- 11.1%No fuel used
- 1.9%Wood
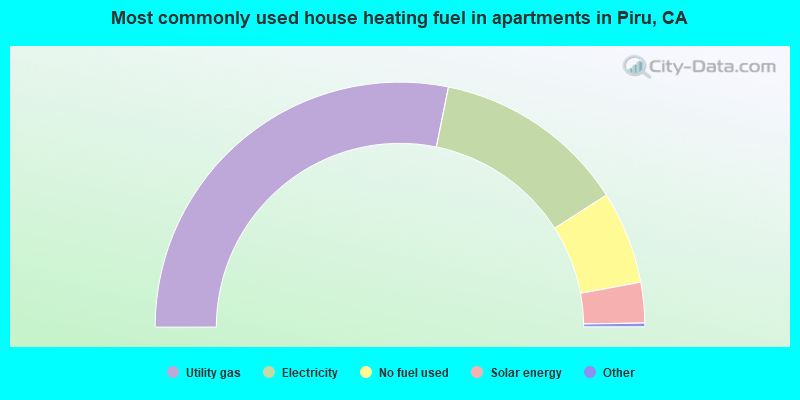
- 56.7%Utility gas
- 25.7%Electricity
- 12.3%No fuel used
- 5.4%Solar energy
Private vs. public school enrollment:
| Here: | 20.5% |
| California: | 10.5% |
| Here: | 0.0% |
| California: | 8.5% |
| Here: | 3.8% |
| California: | 15.9% |


