Pittsburg, CA (California) Houses and Residents
| Pittsburg: | $605,900 |
| California: | $715,900 |
Mean price in 2022:
Detached houses: $382,275
Here: $382,275 State: $988,808 Townhouses or other attached units: $503,623
Here: $503,623 State: $838,546 In 5-or-more-unit structures: $250,152
Here: $250,152 State: $730,996 Mobile homes: $92,399
Here: $92,399 State: $184,506
Total population: 68,140 (Urban population: 56,749, Rural population: 71 (all nonfarm))
Houses: 25,570 (24,480 occupied: 15,912 owner occupied, 8,568 renter occupied)
| % of renters here: | 35% |
| State: | 44% |
Housing density: 1,639 houses/condos per square mile
Median price asked for vacant for-sale houses and condos in 2022: $278,973.
Median contract rent in 2022: $1,918 (lower quartile is $1,548, upper quartile is over $2,000)
Median rent asked for vacant for-rent units in 2022: $1,844
Median gross rent in Pittsburg, CA in 2022: over $2,000
Housing units in Pittsburg with a mortgage: 12,067 (766 second mortgage, 70 home equity loan, 535 both second mortgage and home equity loan)
Houses without a mortgage: 114
Median household income for houses/condos with a mortgage: $126,186
Median household income for apartments without a mortgage: $85,722
Median monthly housing costs: $2,141
Compare current foreclosures in Pittsburg, CA:
| Photo | Address | Area | Beds / Baths | Price | Details |
|---|---|---|---|---|---|

|
#1
E 12th St
Pittsburg, CA 94565
|
1,345 sq. feet
|
1 baths 2 beds |
$519,000
|
show details |

|
#2
Dias Cir
Pittsburg, CA 94565
|
881 sq. feet
|
2 baths 2 beds |
show details | |

|
#3
W 4th St
Pittsburg, CA 94565
|
2,017 sq. feet
|
2 baths 4 beds |
show details | |

|
#4
Wharf Dr
Pittsburg, CA 94565
|
- sq. feet
|
2 baths 4 beds |
show details | |

|
#5
Panoramic Ave
Pittsburg, CA 94565
|
1,364 sq. feet
|
1 baths 4 beds |
show details | |

|
#6
Shasta Cir
Pittsburg, CA 94565
|
1,053 sq. feet
|
1 baths 3 beds |
show details | |

|
#7
Kingsly Dr
Pittsburg, CA 94565
|
2,052 sq. feet
|
2 baths 4 beds |
show details | |

|
#8
Danridge Pl
Pittsburg, CA 94565
|
1,422 sq. feet
|
2 baths 3 beds |
show details | |

|
#9
Heron Dr
Pittsburg, CA 94565
|
1,873 sq. feet
|
2 baths 4 beds |
show details | |

|
#10
Sandpiper Dr
Pittsburg, CA 94565
|
1,740 sq. feet
|
2 baths 3 beds |
show details |
| Photo | Address | Area | Beds / Baths | Price | Details |
|---|---|---|---|---|---|

|
#11
Marina Rd
Pittsburg, CA 94565
|
955 sq. feet
|
1 baths 3 beds |
show details | |

|
#12
Babbling Brook Way
Pittsburg, CA 94565
|
2,025 sq. feet
|
3 baths 4 beds |
show details | |

|
#13
Alamo Ct
Pittsburg, CA 94565
|
1,430 sq. feet
|
2 baths 3 beds |
show details | |

|
#14
Chatworth St
Pittsburg, CA 94565
|
1,550 sq. feet
|
2 baths 3 beds |
show details | |

|
#15
Goff Ave
Pittsburg, CA 94565
|
1,122 sq. feet
|
2 baths 3 beds |
show details | |

|
#16
Oakridge Ln
Pittsburg, CA 94565
|
1,698 sq. feet
|
2 baths 4 beds |
show details | |

|
#17
Bruno Ave
Pittsburg, CA 94565
|
955 sq. feet
|
1 baths 3 beds |
show details | |

|
#18
Hillcrest Ave
Pittsburg, CA 94565
|
1,018 sq. feet
|
1 baths 3 beds |
show details | |

|
#19
Sea Point Wy
Pittsburg, CA 94565
|
1,643 sq. feet
|
2 baths 3 beds |
show details | |

|
#20
Clearland Cir
Pittsburg, CA 94565
|
1,076 sq. feet
|
2 baths 3 beds |
show details |
| Photo | Address | Area | Beds / Baths | Price | Details |
|---|---|---|---|---|---|

|
#21
Lakeview Cir
Pittsburg, CA 94565
|
757 sq. feet
|
1 baths 2 beds |
show details | |

|
#22
Cleveland Ave
Pittsburg, CA 94565
|
921 sq. feet
|
1 baths 2 beds |
show details | |

|
#23
Lawnview Ct
Pittsburg, CA 94565
|
1,622 sq. feet
|
2 baths 4 beds |
show details | |

|
#24
Orinda Cir
Pittsburg, CA 94565
|
1,349 sq. feet
|
2 baths 3 beds |
show details | |

|
#25
Mount Whitney Dr
Pittsburg, CA 94565
|
1,386 sq. feet
|
2 baths 3 beds |
show details | |

|
#26
Dew Drop Cir
Pittsburg, CA 94565
|
1,684 sq. feet
|
2 baths 3 beds |
show details | |

|
#27
Seagull Ct
Pittsburg, CA 94565
|
1,553 sq. feet
|
2 baths 4 beds |
show details | |

|
#28
Manor Dr
Pittsburg, CA 94565
|
918 sq. feet
|
1 baths 2 beds |
show details | |

|
#29
Woodhill Dr
Pittsburg, CA 94565
|
3,205 sq. feet
|
3 baths 5 beds |
show details | |

|
#30
Peppermill Ln
Pittsburg, CA 94565
|
1,092 sq. feet
|
2 baths 2 beds |
show details |
| Photo | Address | Area | Beds / Baths | Price | Details |
|---|---|---|---|---|---|

|
#31
Meadowbrook Ave
Pittsburg, CA 94565
|
1,122 sq. feet
|
1 baths 2 beds |
show details | |

|
#32
Marlin Dr
Pittsburg, CA 94565
|
1,000 sq. feet
|
1 baths 3 beds |
show details | |

|
#33
San Tomas Ct
Pittsburg, CA 94565
|
2,122 sq. feet
|
3 baths 3 beds |
show details | |

|
#34
Crestview Dr
Pittsburg, CA 94565
|
1,355 sq. feet
|
2 baths 3 beds |
show details | |

|
#35
Mepham Dr
Pittsburg, CA 94565
|
1,608 sq. feet
|
2 baths 3 beds |
show details | |

|
#36
E 12th St
Pittsburg, CA 94565
|
1,435 sq. feet
|
1 baths 2 beds |
show details | |

|
#37
Burton Ave
Pittsburg, CA 94565
|
1,033 sq. feet
|
1 baths 3 beds |
show details | |

|
#38
Chabot Ct
Pittsburg, CA 94565
|
1,479 sq. feet
|
2 baths 3 beds |
show details | |

|
#39
William Way
Pittsburg, CA 94565
|
882 sq. feet
|
1 baths 3 beds |
show details | |

|
#40
Scudero Cir
Pittsburg, CA 94565
|
1,883 sq. feet
|
2 baths 4 beds |
show details |
| Photo | Address | Area | Beds / Baths | Price | Details |
|---|---|---|---|---|---|

|
#41
Bruno Ave
Pittsburg, CA 94565
|
955 sq. feet
|
1 baths 3 beds |
show details | |

|
#42
Cassia Ct
Pittsburg, CA 94565
|
2,135 sq. feet
|
2 baths 4 beds |
show details | |

|
#43
Madison Ave
Pittsburg, CA 94565
|
884 sq. feet
|
1 baths 2 beds |
show details | |

|
#44
Shasta Cir
Pittsburg, CA 94565
|
1,053 sq. feet
|
1 baths 3 beds |
show details | |

|
#45
Brookside Dr
Pittsburg, CA 94565
|
1,645 sq. feet
|
2 baths 3 beds |
show details | |

|
#46
Palo Verde Dr
Pittsburg, CA 94565
|
1,351 sq. feet
|
2 baths 3 beds |
show details | |

|
#47
Rain Drop Cir
Pittsburg, CA 94565
|
1,783 sq. feet
|
2 baths 3 beds |
show details | |

|
#48
Metten Ave
Pittsburg, CA 94565
|
1,608 sq. feet
|
2 baths 4 beds |
show details | |

|
#49
Fletcher Ct
Pittsburg, CA 94565
|
1,426 sq. feet
|
2 baths 3 beds |
show details | |

|
Check over 1 million property listings on Foreclosure.com!
|
browse all offers | |||

Latest news about housing in Pittsburg, CA collected exclusively by city-data.com from local newspapers, TV, and radio stations


Median year apartment built: 1983
Household type by relationship:
Households: 77,585- Male householders: 10,905 (2,391 living alone), Female householders: 13,575 (2,480 living alone)
12,570 spouses (12,112 opposite-sex spouses), 1,407 unmarried partners, (1,407 opposite-sex unmarried partners), 24,567 children (22,816 natural, 604 adopted, 1,147 stepchildren), 4,042 grandchildren, 1,867 brothers or sisters, 3,411 parents, 86 foster children, 3,056 other relatives, 1,314 non-relatives
- In group quarters: 785
Size of family households: 5,884 2-persons, 3,764 3-persons, 3,911 4-persons, 1,683 5-persons, 1,392 6-persons, 2,160 7-or-more-persons.
Size of nonfamily households: 4,871 1-person, 766 2-persons, 49 3-persons.
9,510 married couples with children.
3,721 single-parent households (1,039 men, 2,682 women).
49.1% of residents of Pittsburg speak English at home.
32.4% of residents speak Spanish at home (60% speak English very well, 21% speak English well, 15% speak English not well, 5% don't speak English at all).
4.7% of residents speak other Indo-European language at home (71% speak English very well, 14% speak English well, 14% speak English not well, 1% don't speak English at all).
11.5% of residents speak Asian or Pacific Island language at home (57% speak English very well, 28% speak English well, 13% speak English not well, 2% don't speak English at all).
2.5% of residents speak other language at home (80% speak English very well, 6% speak English well, 8% speak English not well, 6% don't speak English at all).
Foreign born population: 22,611 (29.1%)
(58.1% of them are naturalized citizens)
| Here: | 6.1 |
| State: | 6.0 |
| Here: | 4.3 |
| State: | 3.9 |

- Bedrooms in owner-occupied houses and condos in Pittsburg, California
- 108no bedroom
- 1351 bedroom
- 1,9962 bedrooms
- 7,5333 bedrooms
- 4,4174 bedrooms
- 1,7235+ bedrooms

- Bedrooms in renter-occupied apartments in Pittsburg, California
- 206no bedroom
- 2,3851 bedroom
- 2,6472 bedrooms
- 2,1253 bedrooms
- 8194 bedrooms
- 3865+ bedrooms

- Cars and other vehicles available in Pittsburg in owner-occupied houses/condos
- 352no vehicle
- 2,9651 vehicle
- 5,4572 vehicles
- 4,2103 vehicles
- 1,8724 vehicles
- 1,0565+ vehicles

- Cars and other vehicles available in Pittsburg in renter-occupied apartments
- 1,255no vehicle
- 2,4291 vehicle
- 3,2142 vehicles
- 1,0953 vehicles
- 5304 vehicles
- 455+ vehicles

- Rooms in owner-occupied houses in Pittsburg, California
- 521 room
- 02 rooms
- 6723 rooms
- 1,5204 rooms
- 3,0605 rooms
- 4,0916 rooms
- 2,0607 rooms
- 2,1458 rooms
- 2,3129+ rooms

- Rooms in renter-occupied apartments in Pittsburg, California
- 2061 room
- 1,4132 rooms
- 1,4653 rooms
- 1,4464 rooms
- 1,5475 rooms
- 1,0046 rooms
- 3697 rooms
- 6838 rooms
- 4359+ rooms


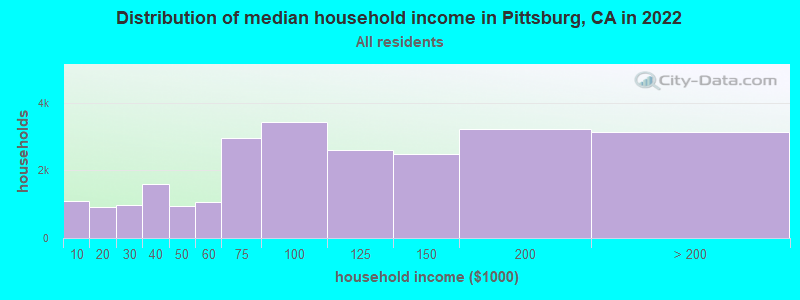
Pittsburg, CA household income distribution

- 1,097Less than $10,000
- 928$10,000 to $19,999
- 979$20,000 to $29,999
- 1,589$30,000 to $39,999
- 952$40,000 to $49,999
- 1,063$50,000 to $59,999
- 2,967$60,000 to $74,999
- 3,435$75,000 to $99,999
- 2,601$100,000 to $124,999
- 2,482$125,000 to $149,999
- 3,242$150,000 to $199,999
- 3,145$200,000 or more
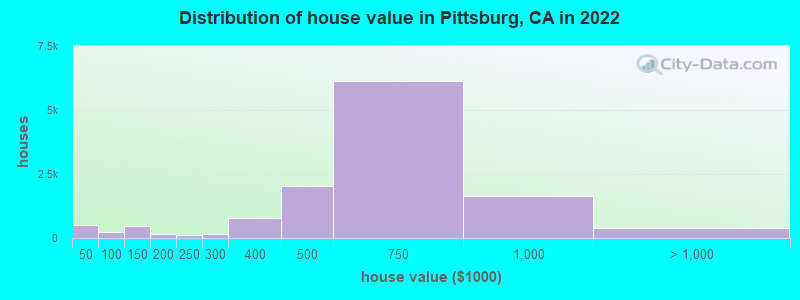
Home value of owner - occupied houses in 2022 in Pittsburg, CA
-
- 302Less than $10,000
- 105$10,000 to $14,999
- 3$15,000 to $19,999
- 47$30,000 to $34,999
- 52$40,000 to $49,999
- 104$50,000 to $59,999
- 9$60,000 to $69,999
- 27$70,000 to $79,999
- 23$80,000 to $89,999
- 8$90,000 to $99,999
- 404$100,000 to $124,999
- 74$125,000 to $149,999
- 100$150,000 to $174,999
- 41$175,000 to $199,999
- 102$200,000 to $249,999
- 147$250,000 to $299,999
- 782$300,000 to $399,999
- 2,037$400,000 to $499,999
- 6,114$500,000 to $749,999
- 1,658$750,000 to $999,999
- 230$1,000,000 to $1,499,999
- 62$1,500,000 to $1,999,999
- 105$2,000,000 or more
Rent paid by renters in 2022 in Pittsburg, CA
-
- 23Less than $100
- 10$100 to $149
- 72$150 to $199
- 181$200 to $249
- 174$250 to $299
- 26$300 to $349
- 84$350 to $399
- 81$400 to $449
- 26$450 to $499
- 19$500 to $549
- 41$550 to $599
- 45$600 to $649
- 80$650 to $699
- 10$700 to $749
- 31$750 to $799
- 85$800 to $899
- 155$900 to $999
- 500$1,000 to $1,249
- 642$1,250 to $1,499
- 3,403$1,500 to $1,999
- 2,373$2,000 to $2,499
- 597$2,500 to $2,999
- 114$3,000 to $3,499
- 312$3,500 or more
- 72No cash rent

Percentage of workers working in this county: 70.5%
Number of people working at home: 3,024 (8.5% of all workers)
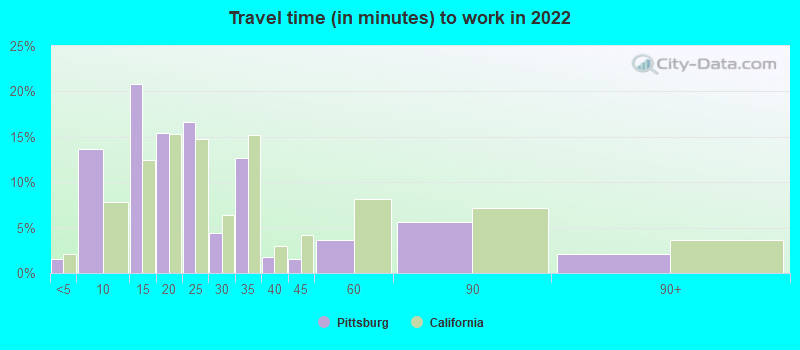
Travel time to work (commute)
- Less than 5 minutes: 305
- 5 to 9 minutes: 1,741
- 10 to 14 minutes: 3,811
- 15 to 19 minutes: 2,820
- 20 to 24 minutes: 4,241
- 25 to 29 minutes: 1,444
- 30 to 34 minutes: 4,211
- 35 to 39 minutes: 916
- 40 to 44 minutes: 2,550
- 45 to 59 minutes: 4,610
- 60 to 89 minutes: 5,176
- 90 or more minutes: 1,915
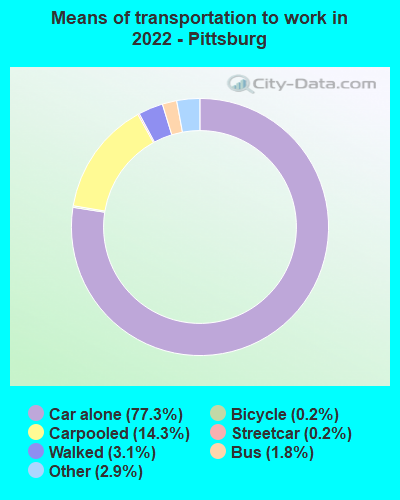
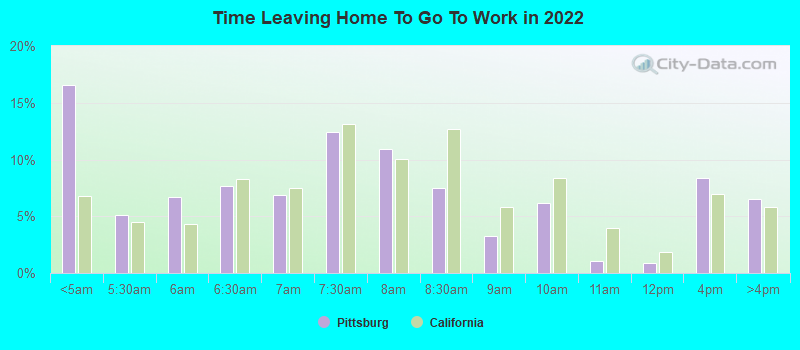
Means of transportation to work:
- Drove a car alone: 10,229 (61.1%)
- Carpooled: 2,121 (12.7%)
- Bus: 193 (1.2%)
- Subway or elevated rail: 21 (0.1%)
- Light rail, streetcar or trolley: 7 (0.0%)
- Taxi: 418 (2.5%)
- Bicycle: 17 (0.1%)
- Walked: 580 (3.5%)
- Worked at home: 3,024 (18.1%)
- Unemployment by race in 2022
- Unemployment rate for White non-Hispanic residents
- 17.9%Males
- 14.9%Females
- Unemployment rate for Black residents
- 11.2%Males
- 13.2%Females
- Unemployment rate for American Indian and Alaska Native residents
- 14.0%Males
- 6.1%Females
- Unemployment rate for Asian residents
- 4.6%Males
- 5.8%Females
- Unemployment rate for other race residents
- 3.9%Males
- 3.7%Females
- Unemployment rate for two or more race residents
- 5.4%Males
- 5.6%Females
- Unemployment rate for Hispanic or Latino residents
- 2.9%Males
- 5.7%Females

- Year of entry for the foreign-born population in Pittsburg, California
- 4,4282010 or later
- 7,5582000 to 2009
- 6,2631990 to 1999
- 5,0011980 to 1989
- 2,3961970 to 1979
- 1,615Before 1970

First ancestries reported:
- Italian: 1,391 (3.0%)
- English: 864 (1.8%)
- American: 552 (1.2%)
- Irish: 536 (1.1%)
- African: 519 (1.1%)
- European: 495 (1.1%)
- German: 482 (1.0%)
- Nigerian: 385 (0.8%)
- Kenyan: 375 (0.8%)
- Scottish: 309 (0.7%)
- Turkish: 165 (0.4%)
- Egyptian: 142 (0.3%)
- Ethiopian: 122 (0.3%)
- Polish: 121 (0.3%)
- Afghan: 119 (0.3%)
- Portuguese: 114 (0.2%)
- Liberian: 100 (0.2%)
- Norwegian: 80 (0.2%)
- Greek: 79 (0.2%)
- Hungarian: 75 (0.2%)
- British: 71 (0.2%)
- Arab: 54 (0.1%)
- Belizean: 42 (0.09%)
- Dutch: 34 (0.07%)
- Swedish: 33 (0.07%)
- Ukrainian: 31 (0.07%)
- Jordanian: 27 (0.06%)
- Scotch-Irish: 25 (0.05%)
- Scandinavian: 22 (0.05%)
- Latvian: 22 (0.05%)
- Jamaican: 22 (0.05%)
- Guyanese: 21 (0.04%)
- Sudanese: 20 (0.04%)
- West Indian: 20 (0.04%)
- Swiss: 17 (0.04%)
- Slovene: 15 (0.03%)
- Palestinian: 15 (0.03%)
- Croatian: 15 (0.03%)
- Lithuanian: 14 (0.03%)
- Russian: 11 (0.02%)
- French: 10 (0.02%)
- Australian: 6 (0.01%)
- Iranian: 5 (0.01%)
- Bulgarian: 5 (0.01%)
- Brazilian: 3 (0.01%)
Most common places of birth for foreign-born residents (%):
| Pittsburg: | 39.0% (9,539) |
| California: | 37.2% (3,881,193) |
| Pittsburg: | 20.8% (5,092) |
| California: | 7.8% (818,297) |
| Pittsburg: | 4.3% (1,060) |
| California: | 4.2% (440,287) |
| Pittsburg: | 4.3% (1,042) |
| California: | 5.2% (539,184) |
| Pittsburg: | 2.8% (685) |
| California: | 0.7% (74,025) |
| Pittsburg: | 2.7% (665) |
| California: | 6.6% (684,672) |
| Pittsburg: | 2.4% (588) |
| California: | 0.3% (35,557) |
| Pittsburg: | 2.4% (579) |
| California: | 4.9% (512,335) |
| Pittsburg: | 2.1% (516) |
| California: | 0.3% (33,937) |
| Pittsburg: | 1.8% (437) |
| California: | 0.6% (58,161) |
| Pittsburg: | 1.7% (425) |
| California: | 0.5% (53,260) |
| Pittsburg: | 1.7% (410) |
| California: | 0.4% (42,718) |
| Pittsburg: | 1.6% (398) |
| California: | 2.8% (290,436) |
Place of birth for U.S.-born residents:
- This state: 44,708
- Other state: 8,707
- Northeast: 1,529
- Midwest: 3,663
- South: 2,144
- West: 1,371
89.2% of Pittsburg residents lived in the same house 1 years ago.
Out of people who lived in different houses, 41.4% lived in this county.
Out of people who lived in different counties, 85.7% lived in California.
| Pittsburg: | 89.2% |
| State average: | 88.9% |
Education attainment for males 25 years and older:
- No schooling: 1,087
- Nursery to 4th grade: 59
- 5th and 6th grade: 567
- 7th and 8th grade: 59
- 9th grade: 300
- 10th grade: 469
- 11th grade: 504
- 12th grade, no diploma: 1,776
- High school graduate (or equivalency): 6,388
- Less than 1 year of college: 2,098
- Some college more than 1 year, no degree: 3,071
- Associate degree: 2,539
- Bachelor's degree: 3,038
- Master's degree: 486
- Professional school degree: 453
- Doctorate degree: 287

Education attainment for females 25 years and older:
- No schooling: 1,206
- Nursery to 4th grade: 381
- 5th and 6th grade: 581
- 7th and 8th grade: 184
- 9th grade: 204
- 10th grade: 249
- 11th grade: 581
- 12th grade, no diploma: 618
- High school graduate (or equivalency): 7,129
- Less than 1 year of college: 1,694
- Some college more than 1 year, no degree: 4,737
- Associate degree: 3,301
- Bachelor's degree: 4,779
- Master's degree: 1,677
- Professional school degree: 359
- Doctorate degree: 296


Housing units in structures:
- One, detached: 17,475
- One, attached: 1,956
- Two: 341
- 3 or 4: 988
- 5 to 9: 583
- 10 to 19: 409
- 20 to 49: 447
- 50 or more: 2,776
- Mobile homes: 595
Median worth of mobile homes: $97,700
Housing units lacking complete kitchen facilities in 2022: 3.1%
House/condo owner moved in on average 11 years ago
Renter moved in on average 4 years ago

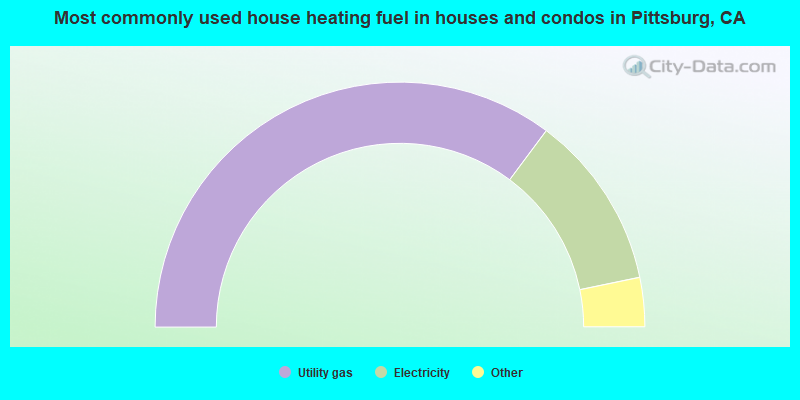
- 70.4%Utility gas
- 23.1%Electricity
- 3.3%Solar energy
- 1.2%No fuel used
- 1.1%Bottled, tank, or LP gas
- 0.7%Wood
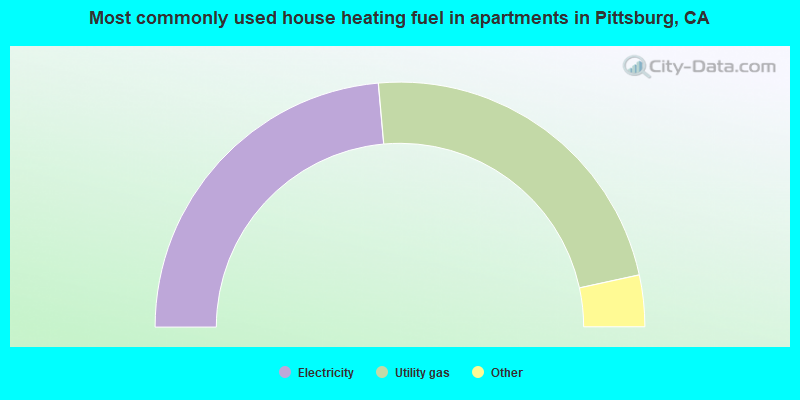
- 47.2%Electricity
- 46.0%Utility gas
- 3.3%Bottled, tank, or LP gas
- 2.3%No fuel used
- 1.0%Solar energy
- 0.1%Fuel oil, kerosene, etc.
Private vs. public school enrollment:
| Here: | 15.0% |
| California: | 10.5% |
| Here: | 1.8% |
| California: | 8.5% |
| Here: | 20.8% |
| California: | 15.9% |


