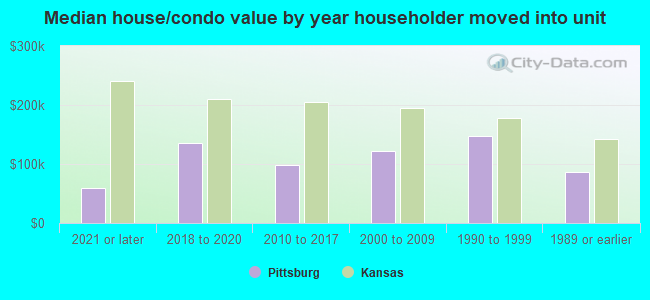
Pittsburg, KS (Kansas) Houses and Residents
| Pittsburg: | $105,865 |
| Kansas: | $206,600 |
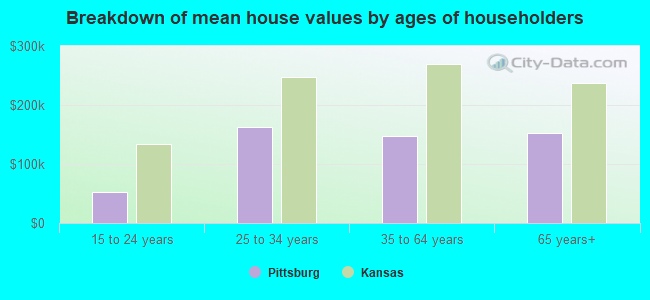
Mean price in 2022:
Detached houses: $142,123
Here: $142,123 State: $264,181 Townhouses or other attached units: $140,992
Here: $140,992 State: $219,178 Mobile homes: $38,611
Here: $38,611 State: $74,712
Total population: 20,394 (Urban population: 18,968 (all inside urban clusters), Rural population: 348 (all nonfarm))
Houses: 9,578 (8,396 occupied: 3,780 owner occupied, 4,716 renter occupied)
| % of renters here: | 56% |
| State: | 32% |
Housing density: 770 houses/condos per square mile
Median price asked for vacant for-sale houses and condos in 2022: $20,478.
Median contract rent in 2022: $628 (lower quartile is $480, upper quartile is $781)
Median rent asked for vacant for-rent units in 2022: $1,403
Median gross rent in Pittsburg, KS in 2022: $815
Housing units in Pittsburg with a mortgage: 2,036 (144 second mortgage, 7 home equity loan, 92 both second mortgage and home equity loan)
Houses without a mortgage: 91
Median household income for houses/condos with a mortgage: $63,457
Median household income for apartments without a mortgage: $49,014
Median monthly housing costs: $785
Compare current foreclosures near Pittsburg, KS:
| Photo | Address | Area | Beds / Baths | Price | Details |
|---|---|---|---|---|---|

|
#1
E 9th St
Pittsburg, KS 66762
|
1,456 sq. feet
|
1 baths 2 beds |
$52,500
|
show details |

|
#2
W 21st St
Pittsburg, KS 66762
|
1,010 sq. feet
|
1 baths 2 beds |
$14,900
|
show details |

|
#3
Thomas St
Pittsburg, KS 66762
|
2,522 sq. feet
|
2 baths 4 beds |
show details | |

|
#4
E 8th St
Pittsburg, KS 66762
|
1,144 sq. feet
|
1 baths 3 beds |
show details | |

|
#5
Countryside Dr
Pittsburg, KS 66762
|
1,286 sq. feet
|
2 baths 3 beds |
show details | |

|
#6
S 200th St
Pittsburg, KS 66762
|
1,056 sq. feet
|
1 baths 2 beds |
show details | |

|
#7
E Centennial Dr
Pittsburg, KS 66762
|
2,155 sq. feet
|
2 baths 4 beds |
show details | |

|
#8
N Free King Hwy
Pittsburg, KS 66762
|
1,936 sq. feet
|
2 baths 4 beds |
show details | |

|
#9
E 7th St
Pittsburg, KS 66762
|
1,010 sq. feet
|
1 baths 2 beds |
show details | |

|
#10
E 17th St
Pittsburg, KS 66762
|
876 sq. feet
|
1 baths 2 beds |
show details |
| Photo | Address | Area | Beds / Baths | Price | Details |
|---|---|---|---|---|---|

|
#11
E 10th St
Pittsburg, KS 66762
|
824 sq. feet
|
1 baths 2 beds |
show details | |

|
#12
E Ford St Apt 206
Pittsburg, KS 66762
|
- sq. feet
|
- baths - beds |
show details | |

|
#13
Robin Rd
Pittsburg, KS 66762
|
- sq. feet
|
- baths - beds |
show details | |

|
#14
W 4th St
Pittsburg, KS 66762
|
- sq. feet
|
- baths - beds |
show details | |

|
#15
N Home St
Pittsburg, KS 66762
|
- sq. feet
|
- baths - beds |
show details | |

|
#16
S Walnut St
Pittsburg, KS 66762
|
- sq. feet
|
- baths - beds |
show details | |

|
#17
E 20th St
Pittsburg, KS 66762
|
- sq. feet
|
- baths - beds |
show details | |

|
#18
S Walnut St
Pittsburg, KS 66762
|
- sq. feet
|
- baths - beds |
show details | |

|
#19
S 200th St
Pittsburg, KS 66762
|
- sq. feet
|
- baths - beds |
show details | |

|
#20
S 220th St
Pittsburg, KS 66762
|
- sq. feet
|
- baths - beds |
show details |
| Photo | Address | Area | Beds / Baths | Price | Details |
|---|---|---|---|---|---|

|
#21
N Free King Hwy
Pittsburg, KS 66762
|
- sq. feet
|
- baths - beds |
show details | |

|
#22
E Monroe St Apt B
Pittsburg, KS 66762
|
- sq. feet
|
- baths - beds |
show details | |

|
#23
E 510th Ave
Pittsburg, KS 66762
|
- sq. feet
|
- baths - beds |
show details | |

|
#24
E Cedar St
Cherokee, KS 66724
|
944 sq. feet
|
1 baths 2 beds |
show details | |

|
#25
Fireside Dr
Arma, KS 66712
|
1,535 sq. feet
|
2 baths 3 beds |
show details | |

|
#26
E 650th Ave
Mulberry, KS 66756
|
2,241 sq. feet
|
1 baths 3 beds |
show details | |

|
#27
S Jefferson St
Frontenac, KS 66763
|
1,000 sq. feet
|
1 baths 1 beds |
show details | |

|
#28
NE 100th St
Weir, KS 66781
|
3,543 sq. feet
|
3 baths 5 beds |
show details | |

|
#29
W Carlton St
Frontenac, KS 66763
|
1,244 sq. feet
|
1 baths 3 beds |
show details | |

|
#30
N Cayuga St
Frontenac, KS 66763
|
1,104 sq. feet
|
1 baths 2 beds |
show details |
| Photo | Address | Area | Beds / Baths | Price | Details |
|---|---|---|---|---|---|

|
#31
E Williams St
Arma, KS 66712
|
1,272 sq. feet
|
1 baths 3 beds |
show details | |

|
#32
N Carbon St
Girard, KS 66743
|
- sq. feet
|
- baths - beds |
show details | |

|
#33
S Osage St
Girard, KS 66743
|
- sq. feet
|
- baths - beds |
show details | |

|
#34
W North County Rd
Frontenac, KS 66763
|
- sq. feet
|
2 baths - beds |
show details | |

|
#35
S 130th St
Girard, KS 66743
|
- sq. feet
|
- baths - beds |
show details | |

|
#36
West Cedar 000091
Cherokee, KS 66724
|
- sq. feet
|
- baths - beds |
show details | |

|
#37
E 620th Ave
Franklin, KS 66735
|
- sq. feet
|
- baths - beds |
show details | |

|
#38
E 614th Ave
Girard, KS 66743
|
- sq. feet
|
- baths - beds |
show details | |

|
#39
S Highway 43
Liberal, MO 64762
|
- sq. feet
|
- baths - beds |
show details | |

|
Check over 1 million property listings on Foreclosure.com!
|
browse all offers | |||

Latest news about housing in Pittsburg, KS collected exclusively by city-data.com from local newspapers, TV, and radio stations

 | Garden City — Any tricks for finding a nice house to rent? (70 replies) |
| Looking for the Lemman family of Pittsburg, KS (2 replies) |
| Considering Hays, Kansas...the good, the bad, the ugly (80 replies) |
| Neodesha (15 replies) |
| Room(s) for rent in Pittsburg KS (2 replies) |
| Anyone familiar with Independence KS? (35 replies) |
Median year apartment built: 1975
Household type by relationship:
Households: 20,618- Male householders: 3,998 (1,432 living alone), Female householders: 4,309 (1,530 living alone)
2,695 spouses (2,695 opposite-sex spouses), 721 unmarried partners, (619 opposite-sex unmarried partners), 4,917 children (4,670 natural, 61 adopted, 185 stepchildren), 402 grandchildren, 291 brothers or sisters, 186 parents, 93 foster children, 110 other relatives, 1,252 non-relatives
- In group quarters: 1,641
Size of family households: 1,934 2-persons, 1,264 3-persons, 776 4-persons, 329 5-persons, 111 6-persons, 72 7-or-more-persons.
Size of nonfamily households: 3,090 1-person, 734 2-persons, 89 3-persons, 76 4-persons, 33 5-persons, 1 6-persons.
2,137 married couples with children.
1,721 single-parent households (246 men, 1,475 women).
92.3% of residents of Pittsburg speak English at home.
5.5% of residents speak Spanish at home (79% speak English very well, 10% speak English well, 6% speak English not well, 5% don't speak English at all).
0.7% of residents speak other Indo-European language at home (86% speak English very well, 14% speak English well).
1.1% of residents speak Asian or Pacific Island language at home (95% speak English very well, 5% speak English well).
0.1% of residents speak other language at home (100% speak English very well).
Foreign born population: 999 (4.8%)
(50.1% of them are naturalized citizens)
| Here: | 6.3 |
| State: | 6.9 |
| Here: | 4.4 |
| State: | 4.4 |
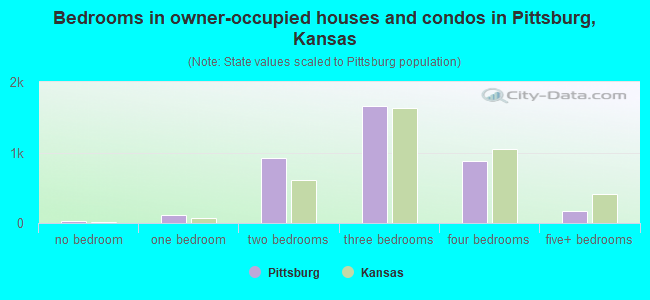
- Bedrooms in owner-occupied houses and condos in Pittsburg, Kansas
- 25no bedroom
- 1131 bedroom
- 9242 bedrooms
- 1,6663 bedrooms
- 8834 bedrooms
- 1715+ bedrooms
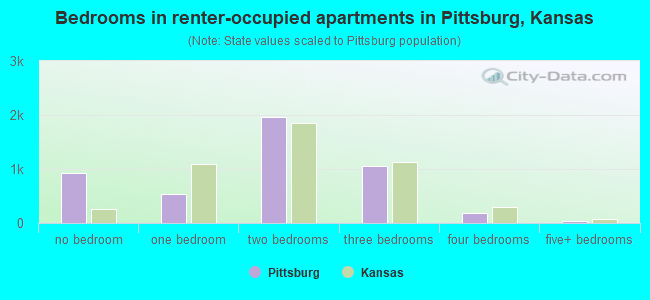
- Bedrooms in renter-occupied apartments in Pittsburg, Kansas
- 933no bedroom
- 5441 bedroom
- 1,9632 bedrooms
- 1,0613 bedrooms
- 1804 bedrooms
- 365+ bedrooms
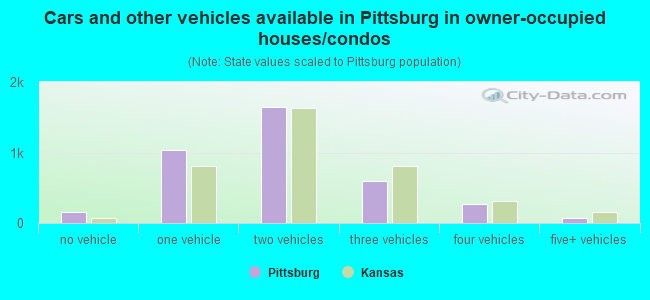
- Cars and other vehicles available in Pittsburg in owner-occupied houses/condos
- 163no vehicle
- 1,0321 vehicle
- 1,6432 vehicles
- 5973 vehicles
- 2694 vehicles
- 775+ vehicles
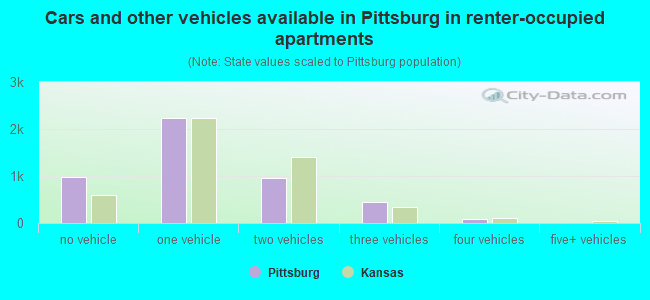
- Cars and other vehicles available in Pittsburg in renter-occupied apartments
- 978no vehicle
- 2,2401 vehicle
- 9622 vehicles
- 4513 vehicles
- 844 vehicles
- 25+ vehicles
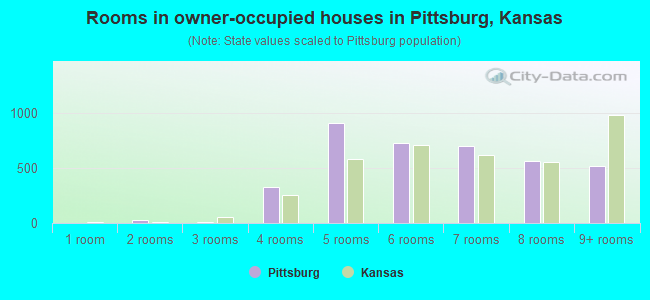
- Rooms in owner-occupied houses in Pittsburg, Kansas
- 01 room
- 252 rooms
- 123 rooms
- 3274 rooms
- 9105 rooms
- 7326 rooms
- 6977 rooms
- 5618 rooms
- 5189+ rooms
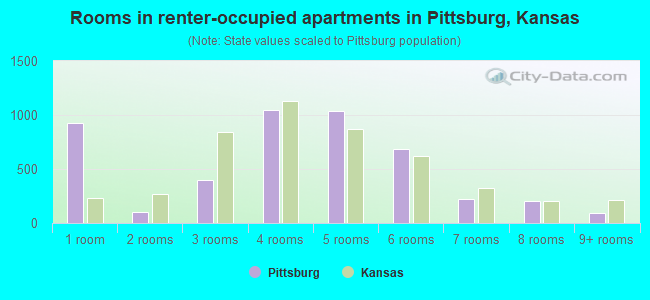
- Rooms in renter-occupied apartments in Pittsburg, Kansas
- 9241 room
- 1062 rooms
- 3993 rooms
- 1,0444 rooms
- 1,0395 rooms
- 6816 rooms
- 2267 rooms
- 2088 rooms
- 909+ rooms
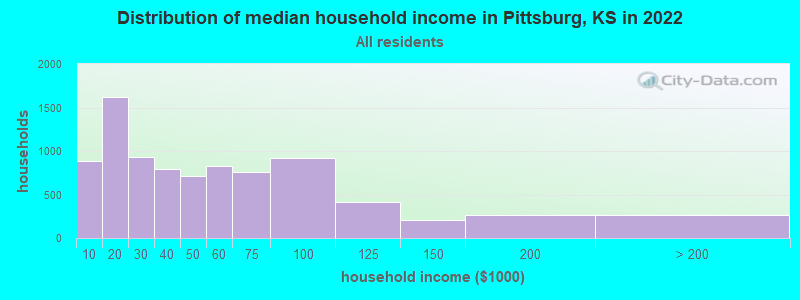
Pittsburg, KS household income distribution

- 884Less than $10,000
- 1,624$10,000 to $19,999
- 930$20,000 to $29,999
- 796$30,000 to $39,999
- 710$40,000 to $49,999
- 830$50,000 to $59,999
- 761$60,000 to $74,999
- 914$75,000 to $99,999
- 412$100,000 to $124,999
- 205$125,000 to $149,999
- 265$150,000 to $199,999
- 267$200,000 or more
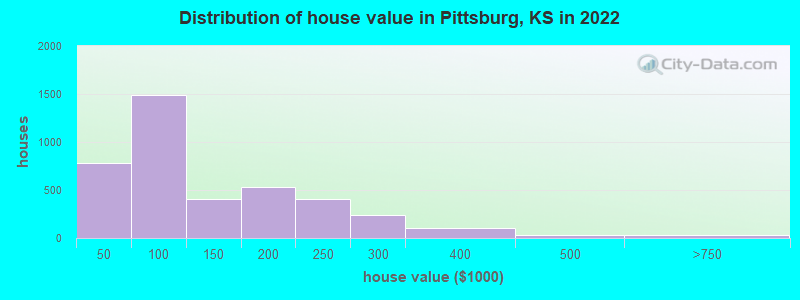
Home value of owner - occupied houses in 2022 in Pittsburg, KS
-
- 97Less than $10,000
- 57$10,000 to $14,999
- 6$15,000 to $19,999
- 42$20,000 to $24,999
- 29$25,000 to $29,999
- 79$30,000 to $34,999
- 60$35,000 to $39,999
- 409$40,000 to $49,999
- 205$50,000 to $59,999
- 259$60,000 to $69,999
- 322$70,000 to $79,999
- 132$80,000 to $89,999
- 162$90,000 to $99,999
- 229$100,000 to $124,999
- 180$125,000 to $149,999
- 394$150,000 to $174,999
- 140$175,000 to $199,999
- 409$200,000 to $249,999
- 238$250,000 to $299,999
- 106$300,000 to $399,999
- 32$400,000 to $499,999
- 27$500,000 to $749,999
- 7$2,000,000 or more
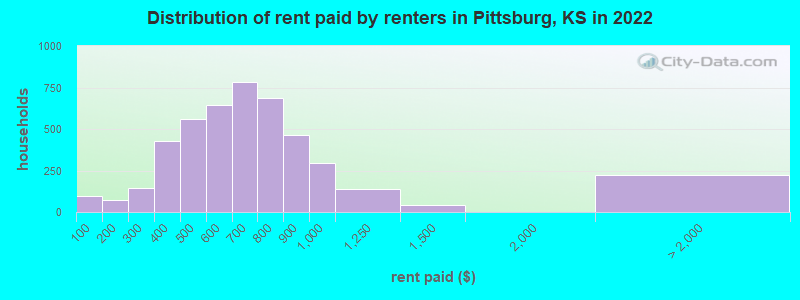
Rent paid by renters in 2022 in Pittsburg, KS
-
- 98Less than $100
- 8$100 to $149
- 63$150 to $199
- 98$200 to $249
- 43$250 to $299
- 307$300 to $349
- 122$350 to $399
- 169$400 to $449
- 389$450 to $499
- 363$500 to $549
- 279$550 to $599
- 466$600 to $649
- 314$650 to $699
- 341$700 to $749
- 347$750 to $799
- 466$800 to $899
- 294$900 to $999
- 140$1,000 to $1,249
- 40$1,250 to $1,499
- 224No cash rent
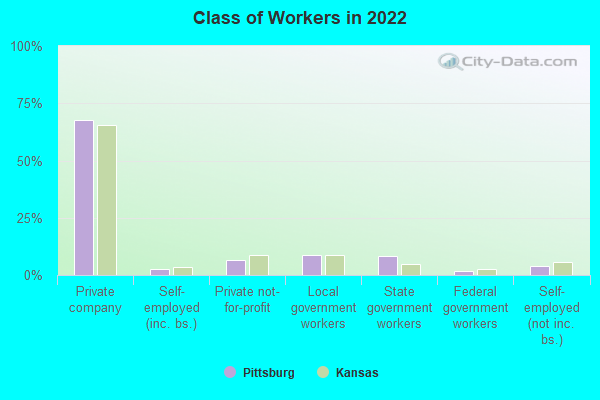
Percentage of workers working in this county: 92.1%
Number of people working at home: 512 (5.0% of all workers)
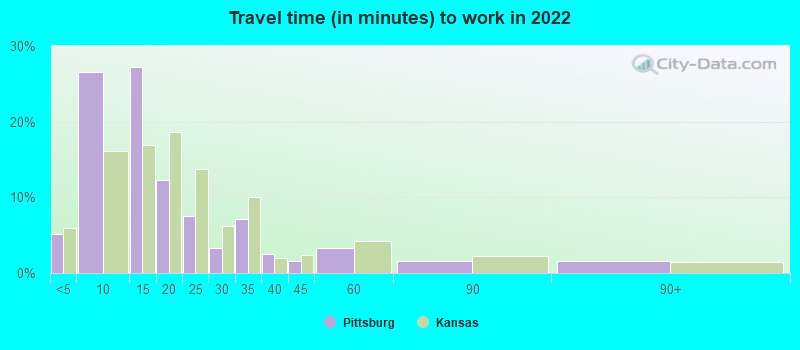
Travel time to work (commute)
- Less than 5 minutes: 585
- 5 to 9 minutes: 3,379
- 10 to 14 minutes: 2,652
- 15 to 19 minutes: 842
- 20 to 24 minutes: 503
- 25 to 29 minutes: 88
- 30 to 34 minutes: 601
- 35 to 39 minutes: 189
- 40 to 44 minutes: 115
- 45 to 59 minutes: 164
- 60 to 89 minutes: 143
- 90 or more minutes: 187
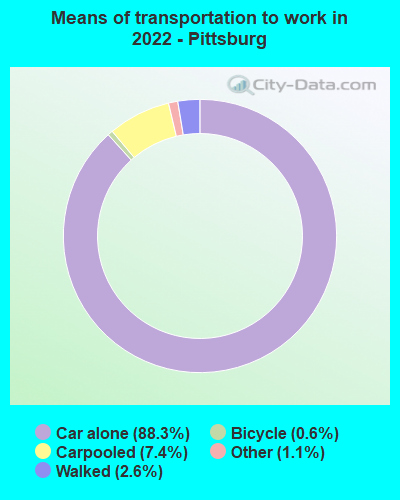
Means of transportation to work:
- Drove a car alone: 11,840 (83.0%)
- Carpooled: 1,007 (7.1%)
- Taxi: 169 (1.2%)
- Bicycle: 77 (0.5%)
- Walked: 365 (2.6%)
- Worked at home: 512 (3.6%)
- Unemployment by race in 2022
- Unemployment rate for White non-Hispanic residents
- 3.9%Males
- 3.7%Females
- Unemployment rate for Black residents
- 8.3%Males
- Unemployment rate for American Indian and Alaska Native residents
- 22.9%Males
- Unemployment rate for other race residents
- 26.2%Males
- Unemployment rate for two or more race residents
- 6.2%Females
- Unemployment rate for Hispanic or Latino residents
- 1.5%Males
- 1.5%Females
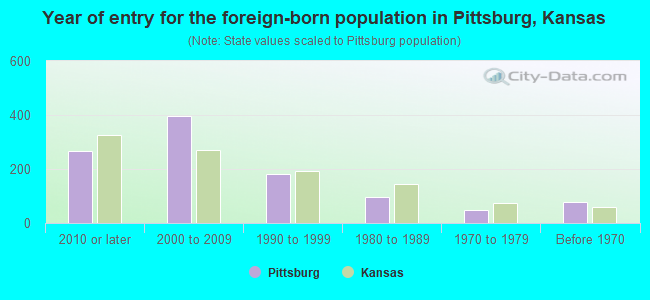
- Year of entry for the foreign-born population in Pittsburg, Kansas
- 2652010 or later
- 3952000 to 2009
- 1821990 to 1999
- 961980 to 1989
- 491970 to 1979
- 77Before 1970
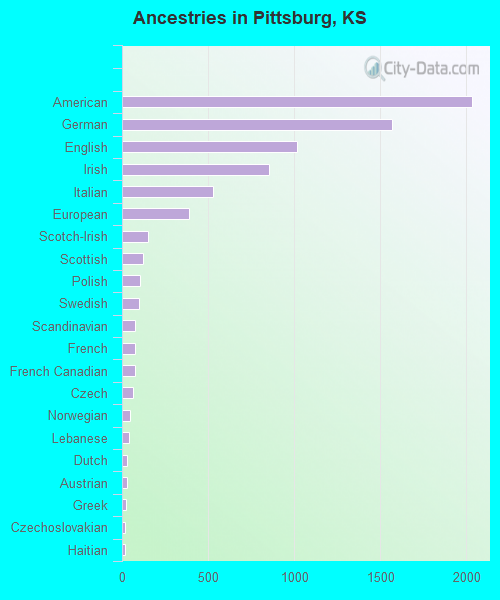
First ancestries reported:
- American: 2,030 (20.1%)
- German: 1,566 (15.5%)
- English: 1,014 (10.0%)
- Irish: 852 (8.4%)
- Italian: 526 (5.2%)
- European: 392 (3.9%)
- Scotch-Irish: 153 (1.5%)
- Scottish: 122 (1.2%)
- Polish: 102 (1.0%)
- Swedish: 101 (1.0%)
- Scandinavian: 77 (0.8%)
- French: 74 (0.7%)
- French Canadian: 73 (0.7%)
- Czech: 66 (0.7%)
- Norwegian: 44 (0.4%)
- Lebanese: 41 (0.4%)
- Dutch: 29 (0.3%)
- Austrian: 28 (0.3%)
- Greek: 25 (0.2%)
- Czechoslovakian: 20 (0.2%)
- Haitian: 20 (0.2%)
- Russian: 17 (0.2%)
- Iranian: 16 (0.2%)
- Welsh: 8 (0.08%)
- Arab: 7 (0.07%)
- Slovene: 6 (0.06%)
- Belgian: 5 (0.05%)
- Eastern European: 5 (0.05%)
- Lithuanian: 5 (0.05%)
- Kenyan: 5 (0.05%)
- British: 5 (0.05%)
- Yugoslavian: 4 (0.04%)
- Romanian: 3 (0.03%)
- Northern European: 3 (0.03%)
- Finnish: 1 (0.01%)
Most common places of birth for foreign-born residents (%):
| Pittsburg: | 23.7% (241) |
| Kansas: | 39.2% (81,282) |
| Pittsburg: | 19.5% (198) |
| Kansas: | 6.5% (13,547) |
| Pittsburg: | 11.1% (113) |
| Kansas: | 3.5% (7,355) |
| Pittsburg: | 8.4% (85) |
| Kansas: | 2.2% (4,488) |
| Pittsburg: | 7.5% (76) |
| Kansas: | 0.2% (410) |
| Pittsburg: | 4.1% (42) |
| Kansas: | 0.7% (1,362) |
| Pittsburg: | 3.5% (36) |
| Kansas: | 2.6% (5,492) |
| Pittsburg: | 2.7% (27) |
| Kansas: | 0.7% (1,401) |
| Pittsburg: | 2.6% (26) |
| Kansas: | 3.9% (8,053) |
| Pittsburg: | 2.5% (25) |
| Kansas: | 0.2% (487) |
| Pittsburg: | 2.3% (23) |
| Kansas: | 0.0% (61) |
| Pittsburg: | 2.0% (20) |
| Kansas: | 1.6% (3,353) |
| Pittsburg: | 1.7% (17) |
| Kansas: | 0.1% (159) |
Place of birth for U.S.-born residents:
- This state: 11,807
- Other state: 7,418
- Northeast: 259
- Midwest: 3,614
- South: 2,180
- West: 1,343
72.2% of Pittsburg residents lived in the same house 1 years ago.
Out of people who lived in different houses, 32.3% lived in this county.
Out of people who lived in different counties, 51.6% lived in Kansas.
| Pittsburg: | 72.2% |
| State average: | 85.3% |
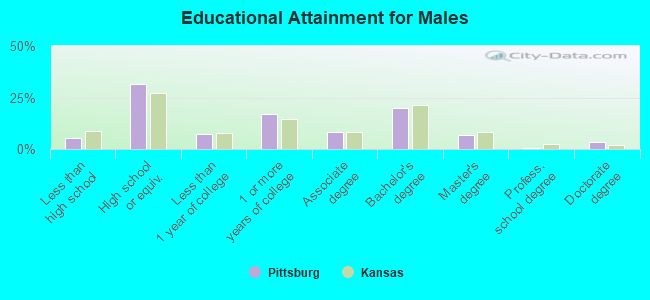
Education attainment for males 25 years and older:
- No schooling: 68
- Nursery to 4th grade: 0
- 5th and 6th grade: 54
- 7th and 8th grade: 7
- 9th grade: 21
- 10th grade: 12
- 11th grade: 24
- 12th grade, no diploma: 83
- High school graduate (or equivalency): 1,629
- Less than 1 year of college: 380
- Some college more than 1 year, no degree: 888
- Associate degree: 434
- Bachelor's degree: 1,040
- Master's degree: 364
- Professional school degree: 27
- Doctorate degree: 165
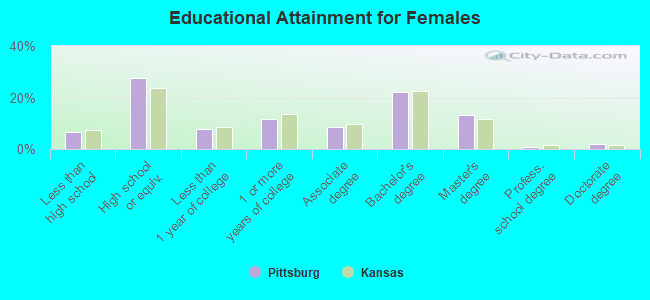
Education attainment for females 25 years and older:
- No schooling: 114
- Nursery to 4th grade: 5
- 5th and 6th grade: 10
- 7th and 8th grade: 50
- 9th grade: 18
- 10th grade: 41
- 11th grade: 52
- 12th grade, no diploma: 80
- High school graduate (or equivalency): 1,517
- Less than 1 year of college: 422
- Some college more than 1 year, no degree: 650
- Associate degree: 470
- Bachelor's degree: 1,215
- Master's degree: 735
- Professional school degree: 48
- Doctorate degree: 103
Housing units in structures:
- One, detached: 6,558
- One, attached: 381
- Two: 497
- 3 or 4: 261
- 5 to 9: 470
- 10 to 19: 544
- 20 to 49: 495
- 50 or more: 226
- Mobile homes: 143
Housing units lacking complete kitchen facilities in 2022: 3.5%
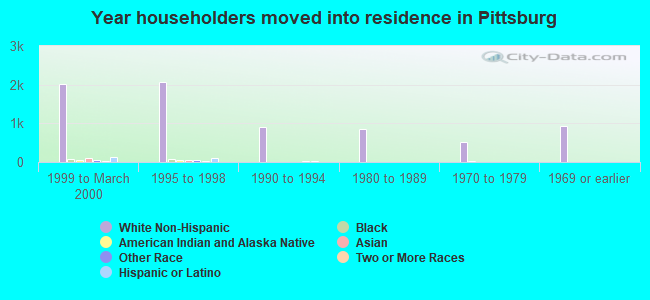
House/condo owner moved in on average 9 years ago
Renter moved in on average 1 years ago
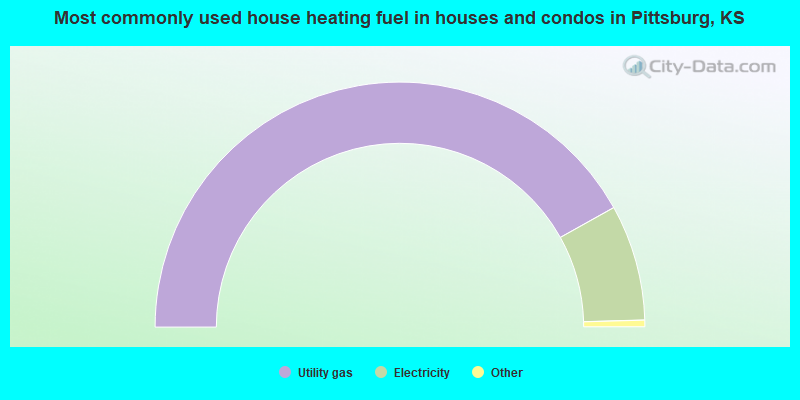
- 83.8%Utility gas
- 15.3%Electricity
- 0.5%Bottled, tank, or LP gas
- 0.2%Fuel oil, kerosene, etc.
- 0.2%Other fuel
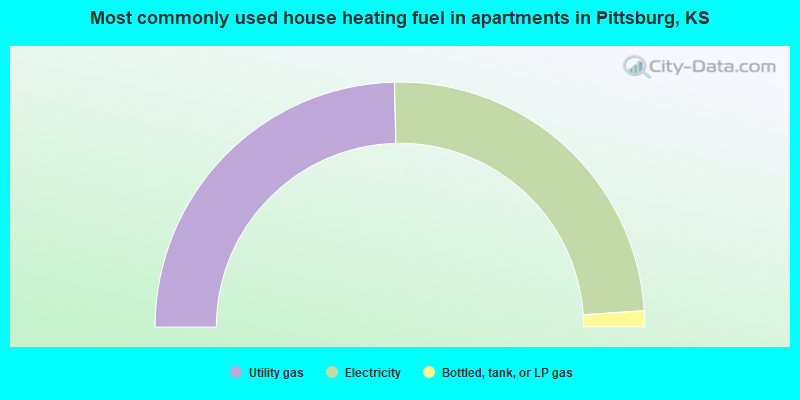
- 49.3%Utility gas
- 48.6%Electricity
- 2.1%Bottled, tank, or LP gas
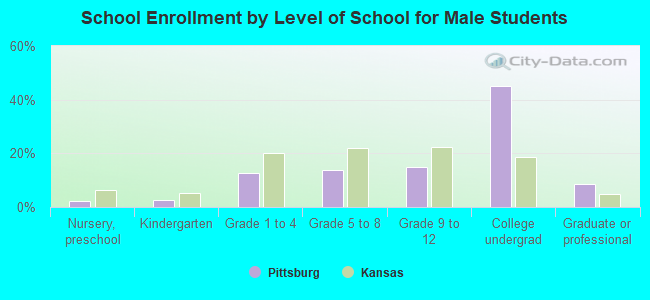
Private vs. public school enrollment:
| Here: | 12.4% |
| Kansas: | 14.1% |
| Here: | 13.6% |
| Kansas: | 10.8% |
| Here: | 5.4% |
| Kansas: | 15.4% |