Plano, TX (Texas) Houses and Residents
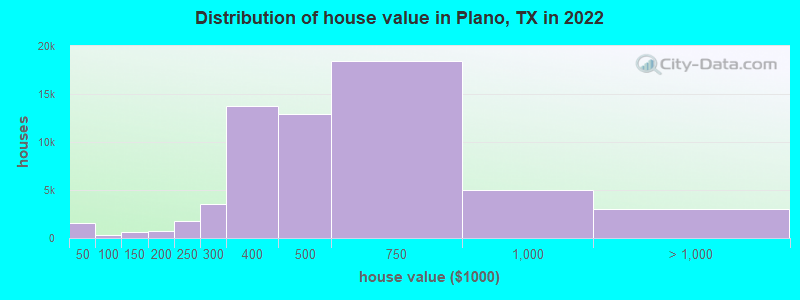
Estimated median house or condo value in 2022: $466,100 (it was $161,200 in 2000 )
Plano:
$466,100Texas:
$275,400
Lower value quartile - upper value quartile: $350,200 - $649,500Mean price in 2022: Detached houses: $527,425 Here:
$527,425State:
$369,058
Townhouses or other attached units: $364,351 Here:
$364,351State:
$327,631
In 2-unit structures: $197,463 Here:
$197,463State:
$374,947
In 3-to-4-unit structures: $359,780 Here:
$359,780State:
$209,652
In 5-or-more-unit structures: $332,307 Here:
$332,307State:
$413,944
Mobile homes: $139,962 Here:
$139,962State:
$124,413
Total population: 278,480 (Urban population: 222,183, Rural population: 118 (all nonfarm) )
Houses: 116,292 (110,466 occupied: 61,623 owner occupied, 48,843 renter occupied )
% of renters here:
44%State:
38%
Housing density: 1,625 houses/condos per square mile
Median price asked for vacant for-sale houses and condos in 2022: $385,347.
Median contract rent in 2022: $1,546 (lower quartile is $1,228, upper quartile is $1,981)
Median rent asked for vacant for-rent units in 2022: $2,002
Median gross rent in Plano, TX in 2022: $1,719
Housing units in Plano with a mortgage: 37,017 (1,834 second mortgage, 0 home equity loan, 1,453 both second mortgage and home equity loan )Houses without a mortgage: 1,031
Median household income for houses/condos with a mortgage: $157,976
Median household income for apartments without a mortgage: $120,471
Median monthly housing costs: $1,720
Data:
Median house or condo value ($)
Median house or condo value ($ change since 2000)
Median house or condo value ($) - White
Median house or condo value ($) - Black or African American
Median house or condo value ($) - Asian
Median house or condo value ($) - Hispanic or Latino
Median house or condo value ($) - American Indian and Alaska Native
Median house or condo value ($) - Multirace
Median house or condo value ($) - Other Race
Median price asked for mobile homes ($)
Household density (households per square mile)
Mean house or condo value by units in structure - 1, detached ($)
Mean house or condo value by units in structure - 1, attached ($)
Mean house or condo value by units in structure - 2 ($)
Mean house or condo value by units in structure by units in structure - 3 or 4 ($)
Mean house or condo value by units in structure - 5 or more ($)
Mean house or condo value by units in structure - Boat, RV, van, etc. ($)
Mean house or condo value by units in structure - Mobile home ($)
Median contract rent ($)
Median contract rent - Lower quartile ($)
Median contract rent - Upper quartile ($)
Median gross rent ($)
Urban houses (%)
Rural houses (%)
Houses occupied (%)
Houses occupied (% change since 2000)
Houses owner occupied (%)
Houses owner occupied (% change since 2000)
Houses renter occupied (%)
Houses renter occupied (% change since 2000)
Vacant housing units - For rent (%)
Vacant housing units - For rent (% change since 2000)
Vacant housing units - For sale only (%)
Vacant housing units - For sale only (% change since 2000)
Vacant housing units - Rented or sold, not occupied (%)
Vacant housing units - Rented or sold, not occupied (% change since 2000)
Vacant housing units - For seasonal, recreational, or occasional use (%)
Vacant housing units - For seasonal, recreational, or occasional use (% change since 2000)
Vacant housing units - For migrant workers (%)
Vacant housing units - For migrant workers (% change since 2000)
Vacant housing units - Other vacant (%)
Vacant housing units - Other vacant (% change since 2000)
Median monthly housing costs ($)
Median household income for houses/condos with a mortgage ($)
Median household income for houses/condos without a mortgage ($)
Median household income ($)
Median household income ($) - White
Median household income ($) - Black or African American
Median household income ($) - Asian
Median household income ($) - Hispanic or Latino
Median household income ($) - American Indian and Alaska Native
Median household income ($) - Multirace
Median household income ($) - Other Race
Mortgage status - with mortgage (%)
Mortgage status - with second mortgage (%)
Mortgage status - with home equity loan (%)
Mortgage status - with both second mortgage and home equity loan (%)
Mortgage status - without a mortgage (%)
Median year house/condo built
Median year apartment built
Household type by relationship - Male householder living alone (%)
Household type by relationship - Male householder not living alone (%)
Household type by relationship - Female householder living alone (%)
Household type by relationship - Female householder not living alone (%)
Household type by relationship - Opposite-Sex spouse (%)
Household type by relationship - Same-Sex spouse (%)
Household type by relationship - Opposite-Sex unmarried partner (%)
Household type by relationship - Same-Sex unmarried partner (%)
Household type by relationship - In group quarters (%)
Size of family households - 2-person household (%)
Size of family households - 3-person household (%)
Size of family households - 4-person household (%)
Size of family households - 5-person household (%)
Size of family households - 6-person household (%)
Size of family households - 7-or-more-person household (%)
Size of nonfamily households - 1-person household (%)
Size of nonfamily households - 2-person household (%)
Size of nonfamily households - 3-person household (%)
Size of nonfamily households - 4-person household (%)
Size of nonfamily households - 5-person household (%)
Size of nonfamily households - 6-person household (%)
Size of nonfamily households - 7-or-moreperson household (%)
Year house built - Built 2010 or later (%)
Year house built - Built 2000 to 2009 (%)
Year house built - Built 1990 to 1999 (%)
Year house built - Built 1980 to 1989 (%)
Year house built - Built 1970 to 1979 (%)
Year house built - Built 1960 to 1969 (%)
Year house built - Built 1950 to 1959 (%)
Year house built - Built 1940 to 1949 (%)
Year house built - Built 1939 or earlier (%)
Median number of rooms in houses and condos
Median number of rooms in apartments
Median number of bedrooms in owner occupied houses
Mean number of bedrooms in owner occupied houses
Median number of bedrooms in renter occupied houses
Mean number of bedrooms in renter occupied houses
Median number of vehichles in owner occupied houses
Mean number of vehichles in owner occupied houses
Median number of vehichles in renter occupied houses
Mean number of vehichles in renter occupied houses
Rooms in owner-occupied houses - 1 room (%)
Rooms in owner-occupied houses - 2 rooms (%)
Rooms in owner-occupied houses - 3 rooms (%)
Rooms in owner-occupied houses - 4 rooms (%)
Rooms in owner-occupied houses - 5 rooms (%)
Rooms in owner-occupied houses - 6 rooms (%)
Rooms in owner-occupied houses - 7 rooms (%)
Rooms in owner-occupied houses - 8 rooms (%)
Rooms in owner-occupied houses - 9+ rooms (%)
Rooms in renter-occupied houses - 1 room (%)
Rooms in renter-occupied houses - 2 rooms (%)
Rooms in renter-occupied houses - 3 rooms (%)
Rooms in renter-occupied houses - 4 rooms (%)
Rooms in renter-occupied houses - 5 rooms (%)
Rooms in renter-occupied houses - 6 rooms (%)
Rooms in renter-occupied houses - 7 rooms (%)
Rooms in renter-occupied houses - 8 rooms (%)
Rooms in renter-occupied houses - 9+ rooms (%)
Bedrooms in owner-occupied houses - no bedrooms (%)
Bedrooms in owner-occupied houses - 1 bedroom (%)
Bedrooms in owner-occupied houses - 2 bedrooms (%)
Bedrooms in owner-occupied houses - 3 bedrooms (%)
Bedrooms in owner-occupied houses - 4 bedrooms (%)
Bedrooms in owner-occupied houses - 5+ bedrooms (%)
Bedrooms in renter-occupied houses - no bedrooms (%)
Bedrooms in renter-occupied houses - 1 bedroom (%)
Bedrooms in renter-occupied houses - 2 bedrooms (%)
Bedrooms in renter-occupied houses - 3 bedrooms (%)
Bedrooms in renter-occupied houses - 4 bedrooms (%)
Bedrooms in renter-occupied houses - 5+ bedrooms (%)
Vehicles available in owner-occupied houses - no vehicle available (%)
Vehicles available in owner-occupied houses - 1 vehicle available(%)
Vehicles available in owner-occupied houses - 2 Vehicles available (%)
Vehicles available in owner-occupied houses - 3 Vehicles available (%)
Vehicles available in owner-occupied houses - 4 Vehicles available (%)
Vehicles available in owner-occupied houses - 5+ Vehicles available (%)
Vehicles available in renter-occupied houses - no vehicle available (%)
Vehicles available in renter-occupied houses - 1 vehicle available (%)
Vehicles available in renter-occupied houses - 2 Vehicles available (%)
Vehicles available in renter-occupied houses - 3 Vehicles available (%)
Vehicles available in renter-occupied houses - 4 Vehicles available (%)
Vehicles available in renter-occupied houses - 5+ Vehicles available (%)
Housing units in structures - 1, detached (%)
Housing units in structures - 1, attached (%)
Housing units in structures - 2 (%)
Housing units in structures - 3 or 4 (%)
Housing units in structures - 5 to 9 (%)
Housing units in structures - 10 to 19 (%)
Housing units in structures - 20 to 49 (%)
Housing units in structures - 50 or more (%)
Housing units in structures - Mobile home (%)
Housing units in structures - Boat, RV, van, etc. (%)
Housing units in structures - Owners - 1, detached (%)
Housing units in structures - Owners - 1, attached (%)
Housing units in structures - Owners - 2 (%)
Housing units in structures - Owners - 3 or 4 (%)
Housing units in structures - Owners - 5 to 9 (%)
Housing units in structures - Owners - 10 to 19 (%)
Housing units in structures - Owners - 20 to 49 (%)
Housing units in structures - Owners - 50 or more (%)
Housing units in structures - Owners - Mobile home (%)
Housing units in structures - Owners - Boat, RV, van, etc. (%)
Housing units in structures - Renters - 1, detached (%)
Housing units in structures - Renters - 1, attached (%)
Housing units in structures - Renters - 2 (%)
Housing units in structures - Renters - 3 or 4 (%)
Housing units in structures - Renters - 5 to 9 (%)
Housing units in structures - Renters - 10 to 19 (%)
Housing units in structures - Renters - 20 to 49 (%)
Housing units in structures - Renters - 50 or more (%)
Housing units in structures - Renters - Mobile home (%)
Housing units in structures - Renters - Boat, RV, van, etc. (%)
House/condo owner moved in on average (years ago)
Renter moved in on average (years ago)
Year householder moved into unit - Moved in 1999 to March 2000 (%)
Year householder moved into unit - Moved in 1999 to March 2000 (%) - White
Year householder moved into unit - Moved in 1999 to March 2000 (%) - Black or African American
Year householder moved into unit - Moved in 1999 to March 2000 (%) - Asian
Year householder moved into unit - Moved in 1999 to March 2000 (%) - Hispanic or Latino
Year householder moved into unit - Moved in 1999 to March 2000 (%) - American Indian and Alaska Native
Year householder moved into unit - Moved in 1999 to March 2000 (%) - Multirace
Year householder moved into unit - Moved in 1999 to March 2000 (%) - Other Race
Year householder moved into unit - Moved in 1995 to 1998 (%)
Year householder moved into unit - Moved in 1995 to 1998 (%) - White
Year householder moved into unit - Moved in 1995 to 1998 (%) - Black or African American
Year householder moved into unit - Moved in 1995 to 1998 (%) - Asian
Year householder moved into unit - Moved in 1995 to 1998 (%) - Hispanic or Latino
Year householder moved into unit - Moved in 1995 to 1998 (%) - American Indian and Alaska Native
Year householder moved into unit - Moved in 1995 to 1998 (%) - Multirace
Year householder moved into unit - Moved in 1995 to 1998 (%) - Other Race
Year householder moved into unit - Moved in 1990 to 1994 (%)
Year householder moved into unit - Moved in 1990 to 1994 (%) - White
Year householder moved into unit - Moved in 1990 to 1994 (%) - Black or African American
Year householder moved into unit - Moved in 1990 to 1994 (%) - Asian
Year householder moved into unit - Moved in 1990 to 1994 (%) - Hispanic or Latino
Year householder moved into unit - Moved in 1990 to 1994 (%) - American Indian and Alaska Native
Year householder moved into unit - Moved in 1990 to 1994 (%) - Multirace
Year householder moved into unit - Moved in 1990 to 1994 (%) - Other Race
Year householder moved into unit - Moved in 1980 to 1989 (%)
Year householder moved into unit - Moved in 1980 to 1989 (%) - White
Year householder moved into unit - Moved in 1980 to 1989 (%) - Black or African American
Year householder moved into unit - Moved in 1980 to 1989 (%) - Asian
Year householder moved into unit - Moved in 1980 to 1989 (%) - Hispanic or Latino
Year householder moved into unit - Moved in 1980 to 1989 (%) - American Indian and Alaska Native
Year householder moved into unit - Moved in 1980 to 1989 (%) - Multirace
Year householder moved into unit - Moved in 1980 to 1989 (%) - Other Race
Year householder moved into unit - Moved in 1970 to 1979 (%)
Year householder moved into unit - Moved in 1970 to 1979 (%) - White
Year householder moved into unit - Moved in 1970 to 1979 (%) - Black or African American
Year householder moved into unit - Moved in 1970 to 1979 (%) - Asian
Year householder moved into unit - Moved in 1970 to 1979 (%) - Hispanic or Latino
Year householder moved into unit - Moved in 1970 to 1979 (%) - American Indian and Alaska Native
Year householder moved into unit - Moved in 1970 to 1979 (%) - Multirace
Year householder moved into unit - Moved in 1970 to 1979 (%) - Other Race
Year householder moved into unit - Moved in 1969 or earlier (%)
Year householder moved into unit - Moved in 1969 or earlier (%) - White
Year householder moved into unit - Moved in 1969 or earlier (%) - Black or African American
Year householder moved into unit - Moved in 1969 or earlier (%) - Asian
Year householder moved into unit - Moved in 1969 or earlier (%) - Hispanic or Latino
Year householder moved into unit - Moved in 1969 or earlier (%) - American Indian and Alaska Native
Year householder moved into unit - Moved in 1969 or earlier (%) - Multirace
Year householder moved into unit - Moved in 1969 or earlier (%) - Other Race
Housing units lacking complete plumbing facilities (%)
Housing units lacking complete kitchen facilities (%)
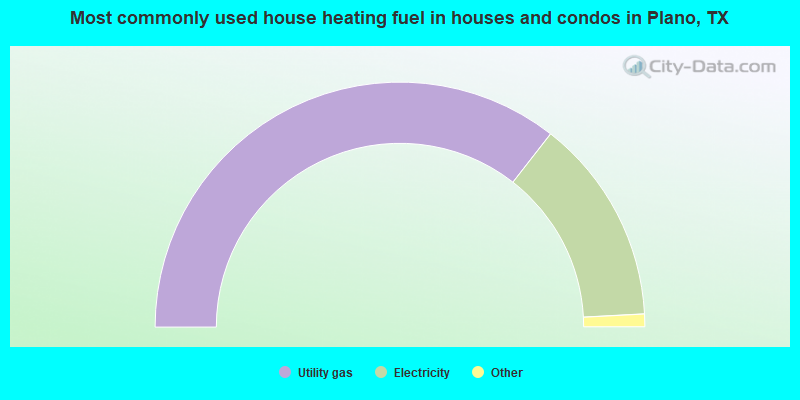
House heating fuel used in houses and condos - Utility gas (%)
House heating fuel used in houses and condos - Bottled, tank, or LP gas (%)
House heating fuel used in houses and condos - Electricity (%)
House heating fuel used in houses and condos - Fuel oil, kerosene, etc. (%)
House heating fuel used in houses and condos - Coal or coke (%)
House heating fuel used in houses and condos - Wood (%)
House heating fuel used in houses and condos - Solar energy (%)
House heating fuel used in houses and condos - Other fuel (%)
House heating fuel used in houses and condos - No fuel used (%)
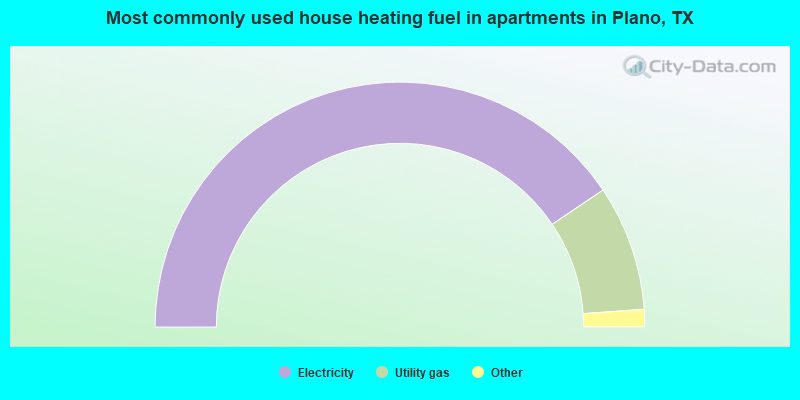
House heating fuel used in apartments - Utility gas (%)
House heating fuel used in apartments - Bottled, tank, or LP gas (%)
House heating fuel used in apartments - Electricity (%)
House heating fuel used in apartments - Fuel oil, kerosene, etc. (%)
House heating fuel used in apartments - Coal or coke (%)
House heating fuel used in apartments - Wood (%)
House heating fuel used in apartments - Solar energy (%)
House heating fuel used in apartments - Other fuel (%)
House heating fuel used in apartments - No fuel used (%)
Latest news about housing in Plano, TX collected exclusively by city-data.com from local newspapers, TV, and radio stations
Median year house/condo built: 1990Median year apartment built: 1998Household type by relationship:
Households: 290,108
Male householders: 60,957 (12,810 living alone ), Female householders: 49,509 (14,574 living alone )61,390 spouses (60,778 opposite-sex spouses ), 5,865 unmarried partners , (5,429 opposite-sex unmarried partners ), 84,044 children (81,443 natural , 641 adopted , 1,960 stepchildren ), 3,405 grandchildren , 3,419 brothers or sisters , 8,649 parents , 263 foster children , 3,697 other relatives , 7,692 non-relatives In group quarters: 1,218
Size of family households: 32,758 2-persons , 19,719 3-persons , 14,730 4-persons , 5,912 5-persons , 2,209 6-persons , 1,047 7-or-more-persons .
Size of nonfamily households: 27,384 1-person , 6,156 2-persons , 394 3-persons , 40 4-persons , 117 6-persons .
46,327 married couples with children. single-parent households (2,654 men , 7,923 women ).
65.7% of residents of Plano speak English at home. of residents speak Spanish at home (64% speak English very well , 17% speak English well , 13% speak English not well , 6% don't speak English at all ).of residents speak other Indo-European language at home (75% speak English very well , 19% speak English well , 6% speak English not well , 1% don't speak English at all ).of residents speak Asian or Pacific Island language at home (68% speak English very well , 22% speak English well , 9% speak English not well , 2% don't speak English at all ).of residents speak other language at home (73% speak English very well , 16% speak English well , 3% speak English not well , 8% don't speak English at all ).
Foreign born population: 77,197 (26.6%)of them are naturalized citizens )
Median number of rooms in houses and condos:
Median number of rooms in apartments
Owner-occupied Renter-occupied
Bedrooms in owner-occupied houses and condos in Plano, Texas
0 no bedroom 388 1 bedroom 2,885 2 bedrooms 20,652 3 bedrooms 29,912 4 bedrooms 7,786 5+ bedrooms
Bedrooms in renter-occupied apartments in Plano, Texas
3,632 no bedroom 17,347 1 bedroom 16,545 2 bedrooms 7,128 3 bedrooms 3,778 4 bedrooms 413 5+ bedrooms
Owner-occupied Renter-occupied
Rooms in owner-occupied houses in Plano, Texas
0 1 room 131 2 rooms 570 3 rooms 2,675 4 rooms 6,229 5 rooms 8,207 6 rooms 10,503 7 rooms 11,074 8 rooms 22,234 9+ rooms
Rooms in renter-occupied apartments in Plano, Texas
3,226 1 room 6,127 2 rooms 13,709 3 rooms 11,345 4 rooms 5,788 5 rooms 2,777 6 rooms 2,447 7 rooms 1,816 8 rooms 1,608 9+ rooms
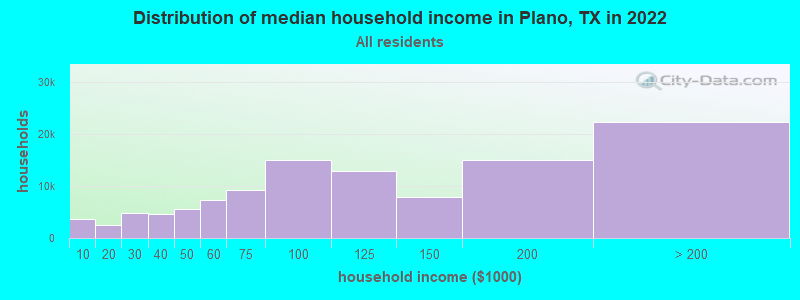
Plano, TX household income distribution 3,579 Less than $10,0002,470 $10,000 to $19,9994,797 $20,000 to $29,9994,637 $30,000 to $39,9995,597 $40,000 to $49,9997,362 $50,000 to $59,9999,138 $60,000 to $74,99914,964 $75,000 to $99,99912,846 $100,000 to $124,9997,911 $125,000 to $149,99914,891 $150,000 to $199,99922,274 $200,000 or more
Home value of owner - occupied houses in 2022 in Plano, TX 818 Less than $10,000278 $10,000 to $14,99966 $15,000 to $19,99941 $25,000 to $29,999204 $30,000 to $34,999128 $35,000 to $39,99944 $40,000 to $49,99954 $60,000 to $69,999109 $80,000 to $89,999134 $90,000 to $99,99977 $100,000 to $124,999497 $125,000 to $149,999289 $150,000 to $174,999492 $175,000 to $199,9991,777 $200,000 to $249,9993,500 $250,000 to $299,99913,728 $300,000 to $399,99912,967 $400,000 to $499,99918,419 $500,000 to $749,9995,000 $750,000 to $999,9991,826 $1,000,000 to $1,499,999445 $1,500,000 to $1,999,999730 $2,000,000 or moreRent paid by renters in 2022 in Plano, TX 152 Less than $10068 $100 to $149195 $150 to $19940 $200 to $24982 $250 to $29948 $300 to $349171 $350 to $39927 $400 to $44956 $450 to $49953 $500 to $54958 $550 to $59956 $600 to $649187 $650 to $699124 $700 to $74937 $750 to $799450 $800 to $8991,220 $900 to $9998,193 $1,000 to $1,24910,824 $1,250 to $1,49917,188 $1,500 to $1,9996,922 $2,000 to $2,4991,616 $2,500 to $2,999914 $3,000 to $3,499543 $3,500 or more830 No cash rent
Percentage of workers working in this county: 67.6%Number of people working at home: 46,416 (29.4% of all workers )
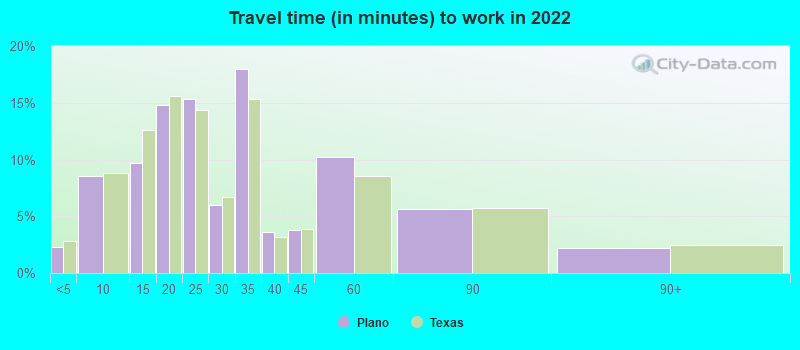
Travel time to work (commute)
Less than 5 minutes: 3,1965 to 9 minutes: 9,88610 to 14 minutes: 12,98315 to 19 minutes: 15,68520 to 24 minutes: 18,90025 to 29 minutes: 8,46630 to 34 minutes: 20,81135 to 39 minutes: 4,80740 to 44 minutes: 4,84545 to 59 minutes: 6,84160 to 89 minutes: 4,00190 or more minutes: 1,223
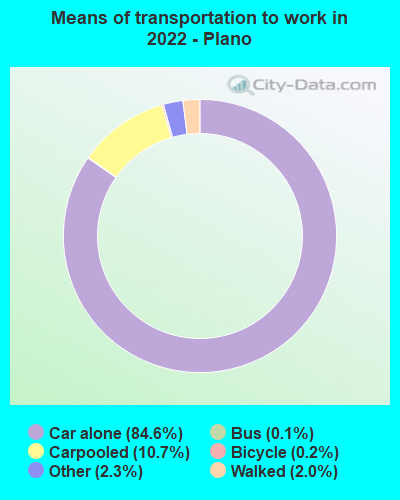
Means of transportation to work:
Drove a car alone: 135,449 (65.6%)Carpooled: 17,180 (8.3%)Bus : 171 (0.1%)Subway or elevated rail : 42 (0.0%)Light rail, streetcar or trolley : 121 (0.1%)Taxi: 3,650 (1.8%)Bicycle: 386 (0.2%)Walked: 3,156 (1.5%)Worked at home: 46,416 (22.5%)
Unemployment by race in 2022
Unemployment rate for White non-Hispanic residents 1.4% Males2.9% FemalesUnemployment rate for Black residents 6.8% Males3.5% FemalesUnemployment rate for American Indian and Alaska Native residents 1.4% FemalesUnemployment rate for Asian residents 4.1% Males5.7% FemalesUnemployment rate for other race residents 0.8% Males6.5% FemalesUnemployment rate for two or more race residents 2.5% Males2.1% FemalesUnemployment rate for Hispanic or Latino residents 2.2% Males1.9% Females
Year of entry for the foreign-born population in Plano, Texas
30,708 2010 or later 14,653 2000 to 2009 15,097 1990 to 1999 10,249 1980 to 1989 5,266 1970 to 1979 2,303 Before 1970
First ancestries reported:
American: 16,501 (9.2%)
English: 12,621 (7.0%)
German: 6,894 (3.8%)
Irish: 4,350 (2.4%)
European: 3,336 (1.9%)
Iranian: 2,522 (1.4%)
Italian: 1,936 (1.1%)
Scotch-Irish: 1,580 (0.9%)
Scottish: 1,521 (0.8%)
Russian: 1,231 (0.7%)
Nigerian: 1,205 (0.7%)
Ethiopian: 958 (0.5%)
French: 921 (0.5%)
Norwegian: 794 (0.4%)
Polish: 656 (0.4%)
Eastern European: 641 (0.4%)
Dutch: 631 (0.3%)
Iraqi: 508 (0.3%)
Lebanese: 475 (0.3%)
African: 473 (0.3%)
Kenyan: 470 (0.3%)
Ukrainian: 446 (0.2%)
Albanian: 413 (0.2%)
Canadian: 389 (0.2%)
British: 368 (0.2%)
Czech: 364 (0.2%)
Danish: 360 (0.2%)
Welsh: 352 (0.2%)
Scandinavian: 347 (0.2%)
Greek: 340 (0.2%)
Armenian: 326 (0.2%)
Haitian: 312 (0.2%)
Egyptian: 284 (0.2%)
Israeli: 266 (0.1%)
French Canadian: 247 (0.1%)
Northern European: 238 (0.1%)
Ghanaian: 236 (0.1%)
Turkish: 231 (0.1%)
Swedish: 224 (0.1%)
Palestinian: 220 (0.1%)
Austrian: 219 (0.1%)
Jamaican: 215 (0.1%)
Brazilian: 214 (0.1%)
Slavic: 191 (0.1%)
Afghan: 165 (0.09%)
South African: 165 (0.09%)
Hungarian: 160 (0.09%)
Yugoslavian: 151 (0.08%)
Syrian: 143 (0.08%)
Slovak: 135 (0.07%)
Czechoslovakian: 125 (0.07%)
West Indian: 117 (0.06%)
Jordanian: 114 (0.06%)
Romanian: 101 (0.06%)
Moroccan: 96 (0.05%)
Croatian: 87 (0.05%)
Portuguese: 87 (0.05%)
Arab: 81 (0.04%)
Serbian: 72 (0.04%)
Latvian: 64 (0.04%)
Bulgarian: 55 (0.03%)
British West Indian: 50 (0.03%)
Trinidadian and Tobagonian: 48 (0.03%)
Finnish: 48 (0.03%)
Estonian: 46 (0.03%)
Basque: 45 (0.02%)
Pennsylvania German: 43 (0.02%)
Sudanese: 40 (0.02%)
Liberian: 30 (0.02%)
Bahamian: 29 (0.02%)
Swiss: 27 (0.01%)
Belgian: 22 (0.01%)
Bermudan: 21 (0.01%)
Cajun: 19 (0.01%)
Dutch West Indian: 16 (0.01%)
Ugandan: 14 (0.01%)
Luxembourger: 13 (0.01%)
Australian: 11 (0.01%)
Most common places of birth for foreign-born residents (%): India Plano:
29.9% (25,177)Texas:
6.1% (306,347)
Mexico Plano:
10.3% (8,703)Texas:
48.4% (2,411,723)
China, excluding Hong Kong and Taiwan Plano:
7.9% (6,675)Texas:
2.3% (115,558)
Pakistan Plano:
3.6% (3,052)Texas:
1.2% (62,159)
Korea Plano:
3.5% (2,981)Texas:
1.2% (60,172)
Guatemala Plano:
3.2% (2,702)Texas:
1.8% (87,382)
Iran Plano:
2.7% (2,250)Texas:
0.6% (28,963)
Vietnam Plano:
2.7% (2,236)Texas:
3.7% (184,770)
Taiwan Plano:
2.5% (2,117)Texas:
0.6% (27,844)
El Salvador Plano:
2.4% (2,022)Texas:
4.5% (224,455)
Philippines Plano:
2.3% (1,915)Texas:
2.1% (103,148)
Canada Plano:
1.8% (1,490)Texas:
1.1% (55,371)
Place of birth for U.S.-born residents:
This state: 117,209Other state: 91,089Northeast: 16,337Midwest: 21,915South: 33,658West: 19,179 85.9% of Plano residents lived in the same house 1 years ago.
Out of people who lived in different houses, 22.7% lived in this county.
Out of people who lived in different counties, 52.0% lived in Texas.
Plano:
85.9%State average:
85.7%
Education attainment for males 25 years and older:
No schooling: 957Nursery to 4th grade: 05th and 6th grade: 1387th and 8th grade: 2239th grade: 78810th grade: 011th grade: 14212th grade, no diploma: 1,007High school graduate (or equivalency): 13,707Less than 1 year of college: 4,018Some college more than 1 year, no degree: 8,274Associate degree: 7,618Bachelor's degree: 36,205Master's degree: 17,559Professional school degree: 4,612Doctorate degree: 2,825
Education attainment for females 25 years and older:
No schooling: 2,189Nursery to 4th grade: 225th and 6th grade: 2707th and 8th grade: 5369th grade: 43710th grade: 28711th grade: 91312th grade, no diploma: 2,534High school graduate (or equivalency): 13,472Less than 1 year of college: 6,539Some college more than 1 year, no degree: 11,934Associate degree: 8,151Bachelor's degree: 37,400Master's degree: 18,223Professional school degree: 3,094Doctorate degree: 1,638
Housing units in structures:
One, detached: 68,654One, attached: 4,483Two: 1,1523 or 4: 3,4695 to 9: 8,73410 to 19: 7,81020 to 49: 4,70750 or more: 16,972Mobile homes: 311Housing units lacking complete plumbing facilities in 2022: 0.1%Housing units lacking complete kitchen facilities in 2022: 1.1%House/condo owner moved in on average 12 years ago
Renter moved in on average 2 years ago
Private vs. public school enrollment:
Students in private schools in grades 1 to 8 (elementary and middle school): 3,199 Students in private schools in grades 9 to 12 (high school): 1,412 Students in private undergraduate colleges: 1,471