Pleasant Prairie, WI (Wisconsin) Houses and Residents
| Pleasant Prairie: | $337,133 |
| Wisconsin: | $252,800 |
Mean price in 2022:
Detached houses: $404,825
Here: $404,825 State: $308,468 Townhouses or other attached units: $294,537
Here: $294,537 State: $265,873 In 2-unit structures: $236,899
Here: $236,899 State: $203,667 In 3-to-4-unit structures: $304,323
Here: $304,323 State: $216,833 In 5-or-more-unit structures: $197,334
Here: $197,334 State: $280,537 Mobile homes: $42,602
Here: $42,602 State: $79,042
Total population: 20,400 (Urban population: 13,941, Rural population: 1,939 (47 farm, 1,892 nonfarm))
Houses: 8,933 (8,539 occupied: 6,926 owner occupied, 1,867 renter occupied)
| % of renters here: | 21% |
| State: | 32% |
Housing density: 267 houses/condos per square mile
Median price asked for vacant for-sale houses and condos in 2022: $256,495.
Median contract rent in 2022: $1,181 (lower quartile is $902, upper quartile is $1,430)
Median rent asked for vacant for-rent units in 2022: $3,332
Median gross rent in Pleasant Prairie, WI in 2022: $1,309
Housing units in Pleasant Prairie with a mortgage: 4,685 (408 second mortgage, 6 home equity loan, 371 both second mortgage and home equity loan)
Houses without a mortgage: 155
Median household income for houses/condos with a mortgage: $112,804
Median household income for apartments without a mortgage: $92,603
Median monthly housing costs: $1,362
Compare current foreclosures near Pleasant Prairie, WI:
| Photo | Address | Area | Beds / Baths | Price | Details |
|---|---|---|---|---|---|

|
#1
106th St
Pleasant Prairie, WI 53158
|
1,922 sq. feet
|
1 baths 3 beds |
show details | |

|
#2
106th St
Pleasant Prairie, WI 53158
|
1,344 sq. feet
|
1 baths 3 beds |
show details | |

|
#3
Lexington Pl Apt 12
Pleasant Prairie, WI 53158
|
1,080 sq. feet
|
2 baths 2 beds |
show details | |

|
#4
107th St
Pleasant Prairie, WI 53158
|
1,528 sq. feet
|
1 baths 2 beds |
show details | |

|
#5
88th St
Pleasant Prairie, WI 53158
|
1,843 sq. feet
|
2 baths 4 beds |
show details | |

|
#6
93rd St
Pleasant Prairie, WI 53158
|
1,080 sq. feet
|
2 baths 3 beds |
show details | |

|
#7
7th Ave
Pleasant Prairie, WI 53158
|
- sq. feet
|
- baths - beds |
show details | |

|
#8
88th Ave Lot 324
Pleasant Prairie, WI 53158
|
- sq. feet
|
- baths - beds |
show details | |

|
#9
2nd Ave
Pleasant Prairie, WI 53158
|
- sq. feet
|
- baths - beds |
show details | |

|
#10
82nd St Apt 209
Pleasant Prairie, WI 53158
|
- sq. feet
|
- baths - beds |
show details |
| Photo | Address | Area | Beds / Baths | Price | Details |
|---|---|---|---|---|---|

|
#11
Cooper Rd
Pleasant Prairie, WI 53158
|
- sq. feet
|
- baths - beds |
show details | |

|
#12
80th St Apt 99
Pleasant Prairie, WI 53158
|
- sq. feet
|
- baths - beds |
show details | |

|
#13
91st St, Apt 116
Pleasant Prairie, WI 53158
|
- sq. feet
|
- baths - beds |
show details | |

|
#14
100th Pl Unit Ee
Pleasant Prairie, WI 53158
|
- sq. feet
|
- baths - beds |
show details | |

|
#15
Seasons Pl, Apt 204
Pleasant Prairie, WI 53158
|
- sq. feet
|
- baths - beds |
show details | |

|
#16
Creekside Cir # 220
Pleasant Prairie, WI 53158
|
- sq. feet
|
- baths - beds |
show details | |

|
#17
104th St
Pleasant Prairie, WI 53158
|
- sq. feet
|
- baths - beds |
show details | |

|
#18
83rd St, Apt 19
Pleasant Prairie, WI 53158
|
- sq. feet
|
- baths - beds |
show details | |

|
#19
Clover Ct
Round Lake, IL 60073
|
1,682 sq. feet
|
1 baths 3 beds |
$273,000
|
show details |

|
#20
69th St
Kenosha, WI 53143
|
1,248 sq. feet
|
1 baths 3 beds |
$218,900
|
show details |
| Photo | Address | Area | Beds / Baths | Price | Details |
|---|---|---|---|---|---|

|
#21
Clover Ln
Round Lake, IL 60073
|
- sq. feet
|
2 baths 3 beds |
$130,000
|
show details |

|
#22
16th St
North Chicago, IL 60064
|
1,388 sq. feet
|
1 baths 4 beds |
show details | |

|
#23
Elisha Ave
Zion, IL 60099
|
1,404 sq. feet
|
2 baths 4 beds |
show details | |

|
#24
Enoch Ave
Zion, IL 60099
|
1,462 sq. feet
|
2 baths 3 beds |
show details | |

|
#25
N Park Ave
Lake Villa, IL 60046
|
1,184 sq. feet
|
1 baths 3 beds |
show details | |

|
#26
Lincoln St
North Chicago, IL 60064
|
1,136 sq. feet
|
1 baths 2 beds |
show details | |

|
#27
N Greentree Rd
Grayslake, IL 60030
|
2,008 sq. feet
|
2 baths 4 beds |
show details | |

|
#28
W Engle Dr
Lake Villa, IL 60046
|
1,456 sq. feet
|
1 baths 3 beds |
show details | |

|
#29
Stonegate Rd
Waukegan, IL 60087
|
1,081 sq. feet
|
1 baths 3 beds |
show details | |

|
#30
Bassett Rd
Burlington, WI 53105
|
1,314 sq. feet
|
1 baths 3 beds |
show details |
| Photo | Address | Area | Beds / Baths | Price | Details |
|---|---|---|---|---|---|

|
#31
Ojibwa Trl
Round Lake, IL 60073
|
1,683 sq. feet
|
2 baths 2 beds |
show details | |

|
#32
N Algonquin Dr
Grayslake, IL 60030
|
1,440 sq. feet
|
1 baths 3 beds |
show details | |

|
#33
Broadway Ave
North Chicago, IL 60064
|
1,482 sq. feet
|
2 baths 3 beds |
show details | |

|
#34
Crossland Dr
Grayslake, IL 60030
|
1,562 sq. feet
|
1 baths 3 beds |
show details | |

|
#35
N Old Lake Ave
Antioch, IL 60002
|
2,904 sq. feet
|
2 baths 3 beds |
show details | |

|
#36
280th Ave
Salem, WI 53168
|
2,149 sq. feet
|
2 baths 3 beds |
show details | |

|
#37
Cherokee Dr
Round Lake, IL 60073
|
1,136 sq. feet
|
2 baths 4 beds |
show details | |

|
#38
Woodside Ct
Grayslake, IL 60030
|
3,078 sq. feet
|
2 baths 4 beds |
show details | |

|
#39
Cameron Dr
Antioch, IL 60002
|
2,427 sq. feet
|
2 baths 4 beds |
show details | |

|
#40
Meadow Hill Ln
Round Lake, IL 60073
|
1,176 sq. feet
|
2 baths 3 beds |
show details |
| Photo | Address | Area | Beds / Baths | Price | Details |
|---|---|---|---|---|---|

|
#41
69th St
Kenosha, WI 53142
|
2,577 sq. feet
|
2 baths 4 beds |
show details | |

|
#42
101st St
Bristol, WI 53104
|
- sq. feet
|
1 baths 4 beds |
show details | |

|
#43
Park Ave
North Chicago, IL 60064
|
1,550 sq. feet
|
1 baths 3 beds |
show details | |

|
#44
Maryland Ave
Racine, WI 53403
|
999 sq. feet
|
1 baths 3 beds |
show details | |

|
#45
Hillside Ave
Antioch, IL 60002
|
2,448 sq. feet
|
3 baths 5 beds |
show details | |

|
#46
Timber Lake Dr
Antioch, IL 60002
|
3,473 sq. feet
|
3 baths 5 beds |
show details | |

|
#47
Van Buren Rd
Kenosha, WI 53142
|
2,214 sq. feet
|
1 baths 3 beds |
show details | |

|
#48
Tall Oaks Dr
Antioch, IL 60002
|
2,160 sq. feet
|
2 baths 3 beds |
show details | |

|
#49
Sprucewood Ln
Lake Villa, IL 60046
|
1,291 sq. feet
|
1 baths 3 beds |
show details | |

|
Check over 1 million property listings on Foreclosure.com!
|
browse all offers | |||


 | Condos, townhomes in Kenosha (10 replies) |
| Rental home in Kenosha area needed for a German Expat (0 replies) |
| cute, cheap lake town for weekend home (29 replies) |
| Seeking guidance on moving to Milwaukee (20 replies) |
| Retiring in WI (23 replies) |
| Is Kenosha a safe city to live in? (3 replies) |

Median year apartment built: 2009
Household type by relationship:
Households: 21,262- Male householders: 4,633 (866 living alone), Female householders: 3,728 (1,070 living alone)
4,699 spouses (4,699 opposite-sex spouses), 708 unmarried partners, (596 opposite-sex unmarried partners), 5,918 children (5,619 natural, 139 adopted, 159 stepchildren), 398 grandchildren, 113 brothers or sisters, 109 parents, 13 foster children, 78 other relatives, 594 non-relatives
- In group quarters: 264
Size of family households: 2,748 2-persons, 1,289 3-persons, 1,291 4-persons, 505 5-persons, 131 6-persons, 10 7-or-more-persons.
Size of nonfamily households: 2,159 1-person, 482 2-persons, 22 3-persons, 105 4-persons, 22 5-persons.
2,972 married couples with children.
969 single-parent households (174 men, 795 women).
90.6% of residents of Pleasant Prairie speak English at home.
3.3% of residents speak Spanish at home (65% speak English very well, 17% speak English well, 18% speak English not well).
3.6% of residents speak other Indo-European language at home (89% speak English very well, 7% speak English well, 3% speak English not well).
1.6% of residents speak Asian or Pacific Island language at home (62% speak English very well, 30% speak English well, 9% speak English not well).
0.9% of residents speak other language at home (95% speak English very well, 5% speak English well).
Foreign born population: 1,056 (5.0%)
(83.0% of them are naturalized citizens)
| Here: | 6.6 |
| State: | 6.5 |
| Here: | 3.2 |
| State: | 4.1 |

- Bedrooms in owner-occupied houses and condos in Pleasant Prairie, Wisconsin
- 0no bedroom
- 691 bedroom
- 1,3192 bedrooms
- 2,9683 bedrooms
- 1,9314 bedrooms
- 6395+ bedrooms
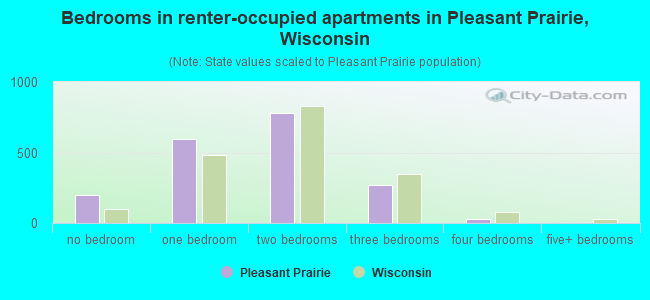
- Bedrooms in renter-occupied apartments in Pleasant Prairie, Wisconsin
- 196no bedroom
- 5931 bedroom
- 7792 bedrooms
- 2723 bedrooms
- 274 bedrooms
- 05+ bedrooms

- Cars and other vehicles available in Pleasant Prairie in owner-occupied houses/condos
- 91no vehicle
- 1,3501 vehicle
- 3,3452 vehicles
- 1,5133 vehicles
- 3534 vehicles
- 2745+ vehicles

- Cars and other vehicles available in Pleasant Prairie in renter-occupied apartments
- 328no vehicle
- 6281 vehicle
- 6182 vehicles
- 1453 vehicles
- 1474 vehicles
- 05+ vehicles

- Rooms in owner-occupied houses in Pleasant Prairie, Wisconsin
- 01 room
- 202 rooms
- 1723 rooms
- 4574 rooms
- 1,2585 rooms
- 1,2926 rooms
- 1,1757 rooms
- 1,2338 rooms
- 1,3199+ rooms

- Rooms in renter-occupied apartments in Pleasant Prairie, Wisconsin
- 1811 room
- 1792 rooms
- 6343 rooms
- 4484 rooms
- 2305 rooms
- 1226 rooms
- 437 rooms
- 228 rooms
- 89+ rooms


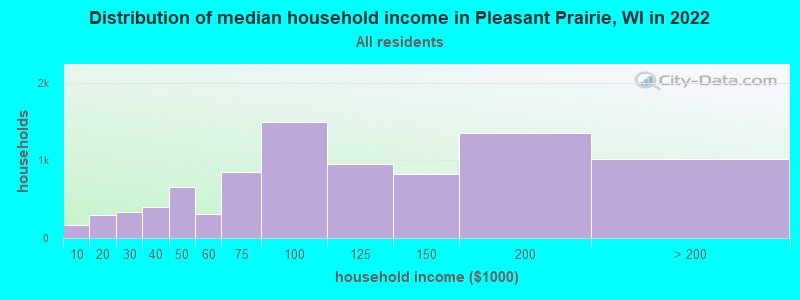
Pleasant Prairie, WI household income distribution

- 162Less than $10,000
- 300$10,000 to $19,999
- 333$20,000 to $29,999
- 405$30,000 to $39,999
- 655$40,000 to $49,999
- 314$50,000 to $59,999
- 847$60,000 to $74,999
- 1,494$75,000 to $99,999
- 951$100,000 to $124,999
- 824$125,000 to $149,999
- 1,355$150,000 to $199,999
- 1,021$200,000 or more
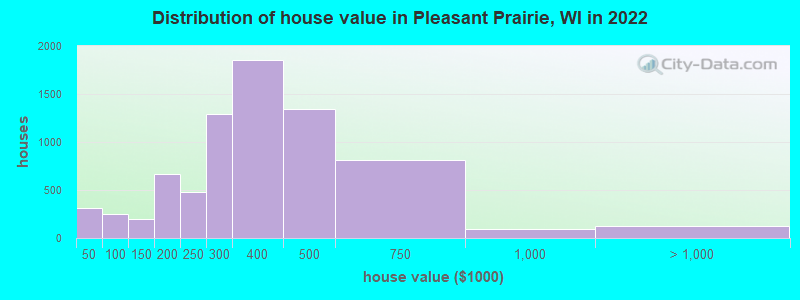
Home value of owner - occupied houses in 2022 in Pleasant Prairie, WI
-
- 41Less than $10,000
- 72$10,000 to $14,999
- 11$15,000 to $19,999
- 20$20,000 to $24,999
- 79$25,000 to $29,999
- 39$30,000 to $34,999
- 45$40,000 to $49,999
- 20$50,000 to $59,999
- 3$60,000 to $69,999
- 87$70,000 to $79,999
- 68$80,000 to $89,999
- 23$90,000 to $99,999
- 81$100,000 to $124,999
- 119$125,000 to $149,999
- 315$150,000 to $174,999
- 346$175,000 to $199,999
- 480$200,000 to $249,999
- 1,289$250,000 to $299,999
- 1,854$300,000 to $399,999
- 1,340$400,000 to $499,999
- 817$500,000 to $749,999
- 91$750,000 to $999,999
- 31$1,000,000 to $1,499,999
- 94$2,000,000 or more
Rent paid by renters in 2022 in Pleasant Prairie, WI
-
- 15$100 to $149
- 21$300 to $349
- 34$350 to $399
- 8$450 to $499
- 67$600 to $649
- 34$700 to $749
- 8$750 to $799
- 206$800 to $899
- 173$900 to $999
- 277$1,000 to $1,249
- 490$1,250 to $1,499
- 339$1,500 to $1,999
- 22$2,000 to $2,499
- 26$3,500 or more
- 77No cash rent

Percentage of workers working in this county: 61.1%
Number of people working at home: 1,736 (16.6% of all workers)
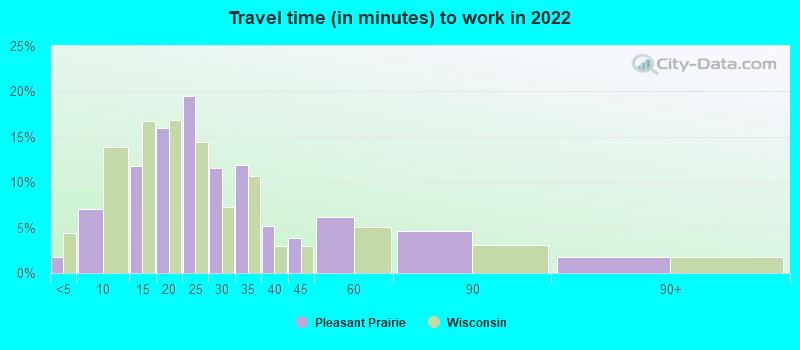
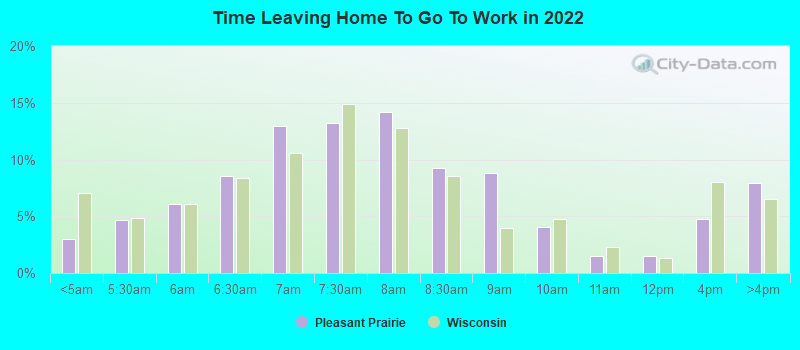
Travel time to work (commute)
- Less than 5 minutes: 182
- 5 to 9 minutes: 999
- 10 to 14 minutes: 1,210
- 15 to 19 minutes: 1,189
- 20 to 24 minutes: 940
- 25 to 29 minutes: 804
- 30 to 34 minutes: 1,576
- 35 to 39 minutes: 290
- 40 to 44 minutes: 326
- 45 to 59 minutes: 706
- 60 to 89 minutes: 423
- 90 or more minutes: 148
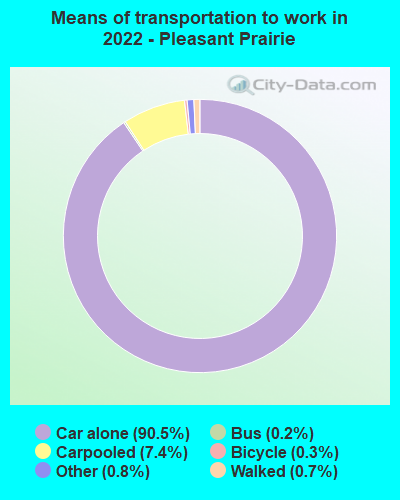
Means of transportation to work:
- Drove a car alone: 14,387 (81.2%)
- Carpooled: 1,305 (7.4%)
- Bus: 29 (0.2%)
- Taxi: 141 (0.8%)
- Bicycle: 51 (0.3%)
- Walked: 114 (0.6%)
- Worked at home: 1,476 (8.3%)
- Unemployment by race in 2022
- Unemployment rate for White non-Hispanic residents
- 4.5%Males
- 2.5%Females
- Unemployment rate for Black residents
- 9.7%Males
- Unemployment rate for other race residents
- 3.1%Males
- Unemployment rate for two or more race residents
- 22.8%Males
- 2.2%Females
- Unemployment rate for Hispanic or Latino residents
- 2.0%Males

- Year of entry for the foreign-born population in Pleasant Prairie, Wisconsin
- 2712010 or later
- 3302000 to 2009
- 2611990 to 1999
- 951980 to 1989
- 2311970 to 1979
- 288Before 1970

First ancestries reported:
- German: 2,370 (25.6%)
- Italian: 938 (10.1%)
- Polish: 691 (7.5%)
- American: 663 (7.1%)
- Irish: 408 (4.4%)
- English: 363 (3.9%)
- Danish: 228 (2.5%)
- Norwegian: 188 (2.0%)
- European: 169 (1.8%)
- Zimbabwean: 140 (1.5%)
- Czech: 103 (1.1%)
- Finnish: 99 (1.1%)
- Ukrainian: 94 (1.0%)
- Scandinavian: 92 (1.0%)
- Lithuanian: 79 (0.9%)
- Dutch: 49 (0.5%)
- Greek: 43 (0.5%)
- Swiss: 34 (0.4%)
- Nigerian: 31 (0.3%)
- Scottish: 30 (0.3%)
- Iranian: 25 (0.3%)
- British: 23 (0.2%)
- Eastern European: 23 (0.2%)
- Romanian: 19 (0.2%)
- Czechoslovakian: 18 (0.2%)
- Slovak: 18 (0.2%)
- Swedish: 17 (0.2%)
- Jamaican: 17 (0.2%)
- French Canadian: 17 (0.2%)
- Scotch-Irish: 16 (0.2%)
- Egyptian: 16 (0.2%)
- Hungarian: 14 (0.2%)
- Austrian: 12 (0.1%)
- Assyrian: 9 (0.10%)
- Croatian: 8 (0.09%)
- African: 7 (0.08%)
- Canadian: 6 (0.06%)
- Armenian: 6 (0.06%)
- French: 4 (0.04%)
- Icelander: 2 (0.02%)
Most common places of birth for foreign-born residents (%):
| Pleasant Prairie: | 27.5% (335) |
| Wisconsin: | 29.5% (87,182) |
| Pleasant Prairie: | 13.1% (160) |
| Wisconsin: | 8.0% (23,594) |
| Pleasant Prairie: | 9.8% (119) |
| Wisconsin: | 3.1% (9,280) |
| Pleasant Prairie: | 9.2% (112) |
| Wisconsin: | 0.0% (140) |
| Pleasant Prairie: | 6.3% (77) |
| Wisconsin: | 3.0% (8,773) |
| Pleasant Prairie: | 5.6% (68) |
| Wisconsin: | 0.4% (1,211) |
| Pleasant Prairie: | 3.6% (44) |
| Wisconsin: | 0.1% (315) |
| Pleasant Prairie: | 2.5% (31) |
| Wisconsin: | 1.5% (4,321) |
| Pleasant Prairie: | 2.3% (28) |
| Wisconsin: | 0.7% (2,079) |
| Pleasant Prairie: | 2.2% (27) |
| Wisconsin: | 0.7% (2,177) |
| Pleasant Prairie: | 2.1% (25) |
| Wisconsin: | 0.1% (231) |
| Pleasant Prairie: | 1.9% (23) |
| Wisconsin: | 0.4% (1,247) |
| Pleasant Prairie: | 1.8% (22) |
| Wisconsin: | 0.5% (1,621) |
| Pleasant Prairie: | 1.7% (21) |
| Wisconsin: | 0.7% (2,099) |
| Pleasant Prairie: | 1.6% (20) |
| Wisconsin: | 0.7% (1,960) |
Place of birth for U.S.-born residents:
- This state: 11,230
- Other state: 8,741
- Northeast: 313
- Midwest: 6,953
- South: 881
- West: 533
87.9% of Pleasant Prairie residents lived in the same house 1 years ago.
Out of people who lived in different houses, 31.3% lived in this county.
Out of people who lived in different counties, 30.3% lived in Wisconsin.
| Pleasant Prairie: | 87.9% |
| State average: | 87.7% |
Education attainment for males 25 years and older:
- No schooling: 103
- Nursery to 4th grade: 0
- 5th and 6th grade: 76
- 7th and 8th grade: 52
- 9th grade: 12
- 10th grade: 54
- 11th grade: 24
- 12th grade, no diploma: 83
- High school graduate (or equivalency): 1,814
- Less than 1 year of college: 649
- Some college more than 1 year, no degree: 1,121
- Associate degree: 1,190
- Bachelor's degree: 2,078
- Master's degree: 361
- Professional school degree: 64
- Doctorate degree: 192

Education attainment for females 25 years and older:
- No schooling: 15
- Nursery to 4th grade: 22
- 5th and 6th grade: 0
- 7th and 8th grade: 36
- 9th grade: 23
- 10th grade: 60
- 11th grade: 56
- 12th grade, no diploma: 178
- High school graduate (or equivalency): 2,086
- Less than 1 year of college: 622
- Some college more than 1 year, no degree: 640
- Associate degree: 921
- Bachelor's degree: 2,148
- Master's degree: 703
- Professional school degree: 70
- Doctorate degree: 77


Housing units in structures:
- One, detached: 6,330
- One, attached: 292
- Two: 115
- 3 or 4: 70
- 5 to 9: 185
- 10 to 19: 338
- 20 to 49: 725
- 50 or more: 437
- Mobile homes: 437
Median worth of mobile homes: $49,138
Housing units lacking complete kitchen facilities in 2022: 1.3%
House/condo owner moved in on average 10 years ago
Renter moved in on average 0 years ago

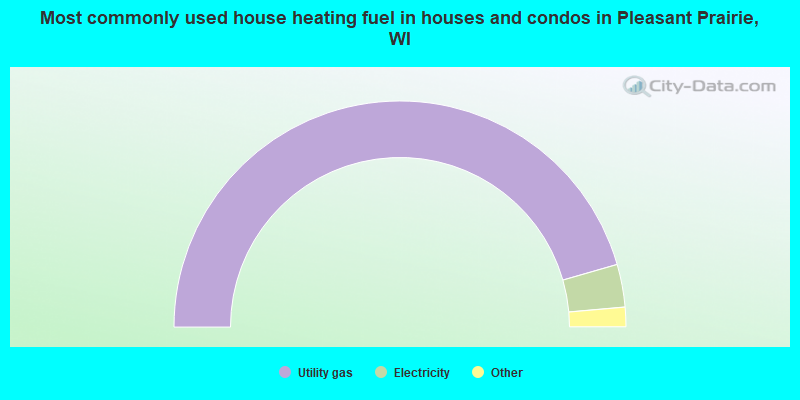
- 91.1%Utility gas
- 6.1%Electricity
- 1.6%Fuel oil, kerosene, etc.
- 1.2%Bottled, tank, or LP gas
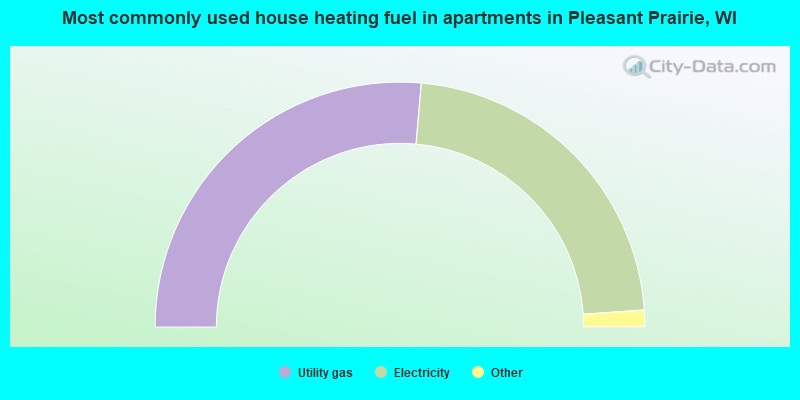
- 52.8%Utility gas
- 45.0%Electricity
- 1.4%Other fuel
- 0.8%No fuel used
Private vs. public school enrollment:
| Here: | 24.6% |
| Wisconsin: | 16.7% |
| Here: | 15.5% |
| Wisconsin: | 12.5% |
| Here: | 25.8% |
| Wisconsin: | 17.5% |


