Housing density: 1,433 houses/condos per square mile
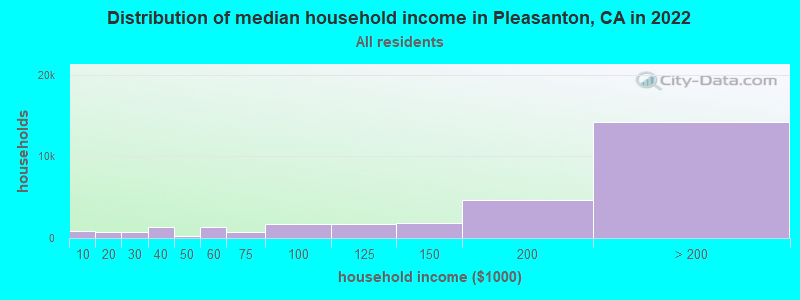
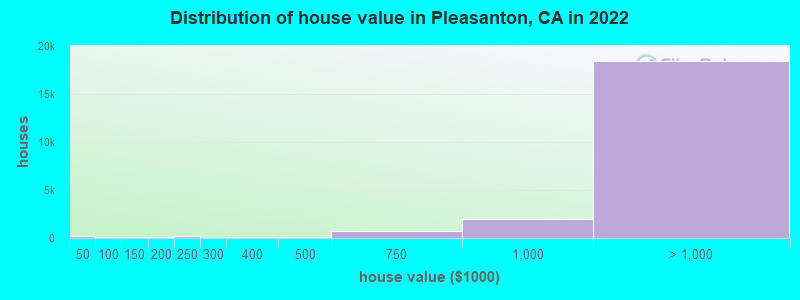
Median price asked for vacant for-sale houses and condos in 2022: $1,137,154.
Median contract rent in 2022: over $2,000 (lower quartile is over $2,000, upper quartile is over $2,000)
Median rent asked for vacant for-rent units in 2022: $4,235
Median gross rent in Pleasanton, CA in 2022: over $2,000
Housing units in Pleasanton with a mortgage: 15,028 (2,066 second mortgage, 57 home equity loan, 1,763 both second mortgage and home equity loan) Houses without a mortgage: 540
Median household income for houses/condos with a mortgage: $250,001
Median household income for apartments without a mortgage: $147,048
15,442 married couples with children.
1,663 single-parent households (592 men, 1,071 women).
57.9% of residents of Pleasanton speak English at home.
5.4% of residents speak Spanish at home (72% speak English very well, 16% speak English well, 8% speak English not well, 4% don't speak English at all).
15.0% of residents speak other Indo-European language at home (82% speak English very well, 12% speak English well, 5% speak English not well, 1% don't speak English at all).
21.7% of residents speak Asian or Pacific Island language at home (63% speak English very well, 22% speak English well, 12% speak English not well, 2% don't speak English at all).
0.4% of residents speak other language at home (83% speak English very well, 12% speak English well, 4% speak English not well, 1% don't speak English at all).
Foreign born population: 27,355 (35.7%)
(54.5% of them are naturalized citizens)
Percentage of workers working in this county: 72.5% Number of people working at home: 12,891 (32.9% of all workers)
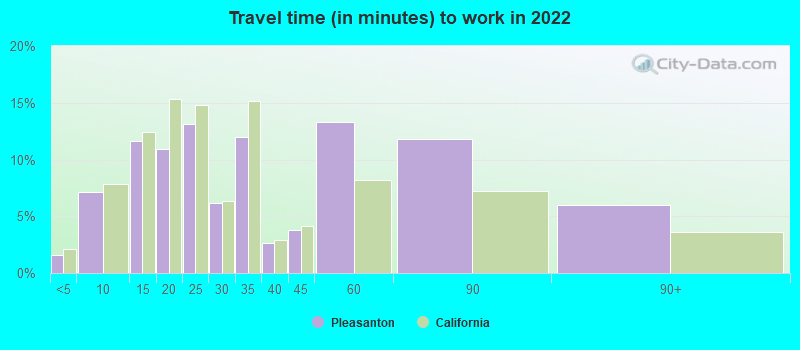
Travel time to work (commute)
Less than 5 minutes: 132
5 to 9 minutes: 2,522
10 to 14 minutes: 3,264
15 to 19 minutes: 2,980
20 to 24 minutes: 1,710
25 to 29 minutes: 929
30 to 34 minutes: 2,021
35 to 39 minutes: 805
40 to 44 minutes: 1,074
45 to 59 minutes: 3,305
60 to 89 minutes: 6,578
90 or more minutes: 674
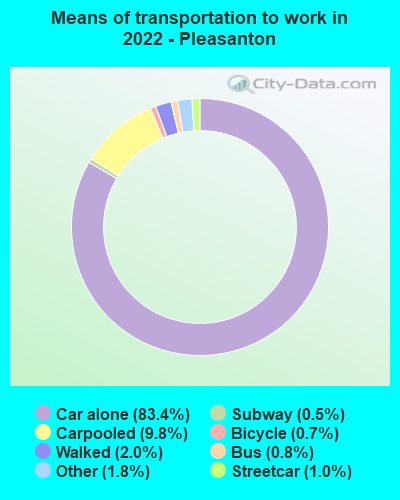
Means of transportation to work:
Drove a car alone: 37,683 (63.9%)
Carpooled: 4,649 (7.9%)
Bus: 291 (0.5%)
Subway or elevated rail: 350 (0.6%)
Long-distance train or commuter rail: 184 (0.3%)
Light rail, streetcar or trolley: 15 (0.0%)
Taxi: 841 (1.4%)
Bicycle: 352 (0.6%)
Walked: 904 (1.5%)
Worked at home: 12,891 (21.9%)
Unemployment by race in 2022
Unemployment rate for White non-Hispanic residents
3.8%Males
2.7%Females
Unemployment rate for Black residents
10.9%Males
10.3%Females
Unemployment rate for American Indian and Alaska Native residents
2.7%Males
Unemployment rate for Asian residents
2.0%Males
5.6%Females
Unemployment rate for other race residents
1.9%Males
7.7%Females
Unemployment rate for two or more race residents
2.9%Males
2.2%Females
Unemployment rate for Hispanic or Latino residents
3.5%Males
4.7%Females
Year of entry for the foreign-born population in Pleasanton, California
10,2182010 or later
6,9952000 to 2009
5,4181990 to 1999
2,2251980 to 1989
1,3871970 to 1979
1,743Before 1970
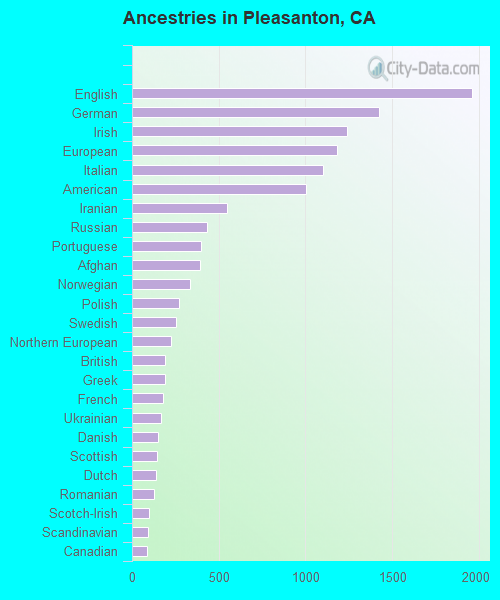
First ancestries reported:
English: 1,960 (4.4%)
German: 1,423 (3.2%)
Irish: 1,237 (2.8%)
European: 1,179 (2.7%)
Italian: 1,102 (2.5%)
American: 1,005 (2.3%)
Iranian: 547 (1.2%)
Russian: 430 (1.0%)
Portuguese: 398 (0.9%)
Afghan: 391 (0.9%)
Norwegian: 332 (0.8%)
Polish: 269 (0.6%)
Swedish: 254 (0.6%)
Northern European: 227 (0.5%)
British: 192 (0.4%)
Greek: 188 (0.4%)
French: 178 (0.4%)
Ukrainian: 169 (0.4%)
Danish: 148 (0.3%)
Scottish: 144 (0.3%)
Dutch: 138 (0.3%)
Romanian: 129 (0.3%)
Scotch-Irish: 99 (0.2%)
Scandinavian: 91 (0.2%)
Canadian: 88 (0.2%)
Eastern European: 83 (0.2%)
French Canadian: 81 (0.2%)
Hungarian: 77 (0.2%)
Jamaican: 70 (0.2%)
Yugoslavian: 65 (0.1%)
African: 65 (0.1%)
Egyptian: 57 (0.1%)
Turkish: 49 (0.1%)
Ethiopian: 48 (0.1%)
Welsh: 47 (0.1%)
Lebanese: 43 (0.10%)
Swiss: 38 (0.09%)
Slovak: 37 (0.08%)
Brazilian: 33 (0.07%)
Ghanaian: 30 (0.07%)
Latvian: 30 (0.07%)
Belgian: 29 (0.07%)
Israeli: 23 (0.05%)
Arab: 20 (0.05%)
Basque: 19 (0.04%)
Croatian: 18 (0.04%)
Armenian: 16 (0.04%)
Maltese: 15 (0.03%)
Assyrian: 14 (0.03%)
Australian: 14 (0.03%)
Lithuanian: 14 (0.03%)
Trinidadian and Tobagonian: 10 (0.02%)
Slavic: 7 (0.02%)
Bulgarian: 7 (0.02%)
Austrian: 3 (0.01%)
Most common places of birth for foreign-born residents (%):
India
Pleasanton:
41.0% (11,424)
California:
5.2% (539,184)
China, excluding Hong Kong and Taiwan
Pleasanton:
18.2% (5,068)
California:
6.6% (684,672)
Korea
Pleasanton:
5.8% (1,623)
California:
3.0% (315,248)
Mexico
Pleasanton:
4.1% (1,147)
California:
37.2% (3,881,193)
Taiwan
Pleasanton:
3.9% (1,076)
California:
1.7% (176,274)
Afghanistan
Pleasanton:
2.3% (638)
California:
0.5% (53,260)
Philippines
Pleasanton:
2.1% (590)
California:
7.8% (818,297)
Iran
Pleasanton:
1.7% (461)
California:
2.0% (206,004)
Russia
Pleasanton:
1.6% (452)
California:
0.7% (71,932)
Place of birth for U.S.-born residents:
This state: 36,378
Other state: 12,425
Northeast: 5,000
Midwest: 2,432
South: 2,431
West: 2,562
87.5% of Pleasanton residents lived in the same house 1 years ago. Out of people who lived in different houses, 33.1% lived in this county. Out of people who lived in different counties, 72.5% lived in California.
Pleasanton:
87.5%
State average:
88.9%
Education attainment for males 25 years and older:
No schooling: 473
Nursery to 4th grade: 0
5th and 6th grade: 62
7th and 8th grade: 0
9th grade: 72
10th grade: 45
11th grade: 0
12th grade, no diploma: 54
High school graduate (or equivalency): 2,141
Less than 1 year of college: 1,067
Some college more than 1 year, no degree: 1,978
Associate degree: 795
Bachelor's degree: 9,088
Master's degree: 8,215
Professional school degree: 1,489
Doctorate degree: 1,644
Education attainment for females 25 years and older:
No schooling: 278
Nursery to 4th grade: 0
5th and 6th grade: 327
7th and 8th grade: 0
9th grade: 0
10th grade: 0
11th grade: 0
12th grade, no diploma: 128
High school graduate (or equivalency): 2,585
Less than 1 year of college: 895
Some college more than 1 year, no degree: 2,390
Associate degree: 1,081
Bachelor's degree: 11,815
Master's degree: 7,807
Professional school degree: 1,614
Doctorate degree: 590
Housing units in structures:
One, detached: 18,541
One, attached: 3,594
Two: 285
3 or 4: 1,541
5 to 9: 1,192
10 to 19: 762
20 to 49: 1,078
50 or more: 3,597
Mobile homes: 374
Boats, RVs, vans, etc.: 72
Median worth of mobile homes: $234,700
Housing units lacking complete plumbing facilities in 2022: 1.0%
Housing units lacking complete kitchen facilities in 2022: 0.5%
House/condo owner moved in on average 11 years ago