Port Hadlock-Irondale, WA (Washington) Houses and Residents
| Port Hadlock-Irondale: | $404,208 |
| Washington: | $569,500 |
Mean price in 2022:
Detached houses: $447,606
Here: $447,606 State: $734,307 Mobile homes: $157,325
Here: $157,325 State: $218,362 Occupied boats, RVs, vans, etc.: $130,125
Here: $130,125 State: $159,523
Total population: 3,580 (Urban population: 3,045 (all inside urban clusters), Rural population: 422 (all nonfarm))
Houses: 1,606 (1,383 occupied: 985 owner occupied, 403 renter occupied)
| % of renters here: | 29% |
| State: | 36% |
Housing density: 241 houses/condos per square mile
Median price asked for vacant for-sale houses and condos in 2022: $1,464,253.
Median contract rent in 2022: $881 (lower quartile is $674, upper quartile is $1,202)
Median rent asked for vacant for-rent units in 2022: $2,186
Median gross rent in Port Hadlock-Irondale, WA in 2022: $1,272
Housing units in Port Hadlock-Irondale with a mortgage: 621 (22 second mortgage, 0 home equity loan, 23 both second mortgage and home equity loan)
Houses without a mortgage: 19
Median household income for houses/condos with a mortgage: $87,701
Median household income for apartments without a mortgage: $56,267
Median monthly housing costs: $1,254
Compare current foreclosures near Port Hadlock-Irondale, WA:
| Photo | Address | Area | Beds / Baths | Price | Details |
|---|---|---|---|---|---|

|
#1
Cape George Rd
Port Townsend, WA 98368
|
1,080 sq. feet
|
2 baths 3 beds |
show details | |

|
#2
Donald Ave
Oak Harbor, WA 98277
|
1,006 sq. feet
|
1 baths 1 beds |
show details | |

|
#3
Lola Ln
Langley, WA 98260
|
1,311 sq. feet
|
2 baths 2 beds |
show details | |

|
#4
Frayne St
Port Hadlock, WA 98339
|
1,404 sq. feet
|
2 baths 3 beds |
show details | |

|
#5
Seaview Ave
Coupeville, WA 98239
|
1,746 sq. feet
|
2 baths 3 beds |
show details | |

|
#6
Thompson Dr
Camano Island, WA 98282
|
1,475 sq. feet
|
3 baths 3 beds |
show details | |

|
#7
Dolphin St
Camano Island, WA 98282
|
1,432 sq. feet
|
2 baths 2 beds |
show details | |

|
#8
Admiralty Way
Camano Island, WA 98282
|
2,127 sq. feet
|
3 baths 3 beds |
show details | |

|
#9
Parker Rd
Coupeville, WA 98239
|
964 sq. feet
|
2 baths 3 beds |
show details | |

|
#10
Thompson Rd
Langley, WA 98260
|
2,208 sq. feet
|
1 baths 1 beds |
show details |
| Photo | Address | Area | Beds / Baths | Price | Details |
|---|---|---|---|---|---|

|
#11
Seaside Dr
Coupeville, WA 98239
|
1,983 sq. feet
|
3 baths 4 beds |
show details | |

|
#12
Buck Rd NE
Hansville, WA 98340
|
1,342 sq. feet
|
2 baths 3 beds |
show details | |

|
#13
Mountain View Ln
Freeland, WA 98249
|
1,414 sq. feet
|
2 baths 3 beds |
show details | |

|
#14
Dogwood Ln
Camano Island, WA 98282
|
2,652 sq. feet
|
3 baths 4 beds |
show details | |

|
#15
Haines St
Port Townsend, WA 98368
|
1,336 sq. feet
|
2 baths 3 beds |
show details | |

|
#16
Rainier Ln
Port Ludlow, WA 98365
|
1,470 sq. feet
|
2 baths 3 beds |
show details | |

|
#17
Flagler Rd
Nordland, WA 98358
|
864 sq. feet
|
1 baths 1 beds |
show details | |

|
#18
W Sims Way, Pmb 471
Port Townsend, WA 98368
|
- sq. feet
|
- baths - beds |
show details | |

|
#19
N Honeycomb Cir
Sequim, WA 98382
|
1,140 sq. feet
|
- baths - beds |
show details | |

|
#20
Cleveland St Unit A
Port Hadlock, WA 98339
|
- sq. feet
|
- baths - beds |
show details |
| Photo | Address | Area | Beds / Baths | Price | Details |
|---|---|---|---|---|---|

|
#21
Engel Rd
Port Townsend, WA 98368
|
- sq. feet
|
- baths - beds |
show details | |

|
#22
Terrace Pl
Camano Island, WA 98282
|
- sq. feet
|
- baths - beds |
show details | |

|
#23
Mariners Dr
Sequim, WA 98382
|
1,686 sq. feet
|
- baths - beds |
show details | |

|
#24
W Cedar St Apt 5
Sequim, WA 98382
|
- sq. feet
|
- baths - beds |
show details | |

|
#25
W Hammond St
Sequim, WA 98382
|
1,560 sq. feet
|
- baths - beds |
show details | |

|
#26
Sunset Pl
Sequim, WA 98382
|
1,398 sq. feet
|
- baths - beds |
show details | |

|
#27
Vine Maple Ln
Camano Island, WA 98282
|
1,782 sq. feet
|
- baths - beds |
show details | |

|
#28
Engel Rd
Port Townsend, WA 98368
|
- sq. feet
|
- baths - beds |
show details | |

|
#29
Washington St Unit 2028
Port Townsend, WA 98368
|
- sq. feet
|
- baths - beds |
show details | |

|
#30
Shady Glen Ln
Greenbank, WA 98253
|
- sq. feet
|
- baths - beds |
show details |
| Photo | Address | Area | Beds / Baths | Price | Details |
|---|---|---|---|---|---|

|
#31
W Rosecrans Ct
Port Townsend, WA 98368
|
- sq. feet
|
- baths - beds |
show details | |

|
#32
El Toro St
Coupeville, WA 98239
|
- sq. feet
|
- baths - beds |
show details | |

|
#33
30th St
Port Townsend, WA 98368
|
- sq. feet
|
- baths - beds |
show details | |

|
#34
O St
Port Townsend, WA 98368
|
- sq. feet
|
- baths - beds |
show details | |

|
#35
Newman Rd Unit 3
Freeland, WA 98249
|
- sq. feet
|
- baths - beds |
show details | |

|
#36
Noble Ln
Port Hadlock, WA 98339
|
1,080 sq. feet
|
- baths - beds |
show details | |

|
#37
Fish Rd # 17
Freeland, WA 98249
|
924 sq. feet
|
- baths - beds |
show details | |

|
#38
Gylany Way
Greenbank, WA 98253
|
- sq. feet
|
- baths - beds |
show details | |

|
#39
Leahy Dr
Coupeville, WA 98239
|
- sq. feet
|
- baths - beds |
show details | |

|
#40
Riepma Ave
Oak Harbor, WA 98277
|
- sq. feet
|
- baths - beds |
show details |
| Photo | Address | Area | Beds / Baths | Price | Details |
|---|---|---|---|---|---|

|
#41
Harbor Sands Ln
Freeland, WA 98249
|
- sq. feet
|
- baths - beds |
show details | |

|
#42
Olympic View Dr
Coupeville, WA 98239
|
- sq. feet
|
- baths - beds |
show details | |

|
#43
Wahl Rd
Freeland, WA 98249
|
- sq. feet
|
- baths - beds |
show details | |

|
#44
Olympic View Dr
Coupeville, WA 98239
|
- sq. feet
|
- baths - beds |
show details | |

|
Check over 1 million property listings on Foreclosure.com!
|
browse all offers | |||


Median year apartment built: 1984
Household type by relationship:
Households: 3,368- Male householders: 551 (165 living alone), Female householders: 808 (248 living alone)
696 spouses (692 opposite-sex spouses), 133 unmarried partners, (133 opposite-sex unmarried partners), 683 children (596 natural, 0 adopted, 87 stepchildren), 70 grandchildren, 65 brothers or sisters, 12 parents, 20 foster children, 40 other relatives, 284 non-relatives
Size of family households: 432 2-persons, 185 3-persons, 164 4-persons, 41 5-persons, 23 6-persons, 11 7-or-more-persons.
Size of nonfamily households: 436 1-person, 61 2-persons, 19 3-persons, 10 4-persons.
256 married couples with children.
253 single-parent households (3 men, 250 women).
96.5% of residents of Port Hadlock-Irondale speak English at home.
0.2% of residents speak Spanish at home (100% speak English very well).
1.3% of residents speak other Indo-European language at home (100% speak English very well).
1.9% of residents speak Asian or Pacific Island language at home (67% speak English very well, 33% speak English well).
Foreign born population: 157 (4.7%)
(69.4% of them are naturalized citizens)
| Here: | 5.3 |
| State: | 6.5 |
| Here: | 4.6 |
| State: | 3.9 |

- Bedrooms in owner-occupied houses and condos in Port Hadlock-Irondale, Washington
- 24no bedroom
- 871 bedroom
- 4542 bedrooms
- 3923 bedrooms
- 294 bedrooms
- 05+ bedrooms

- Bedrooms in renter-occupied apartments in Port Hadlock-Irondale, Washington
- 0no bedroom
- 741 bedroom
- 1452 bedrooms
- 1843 bedrooms
- 04 bedrooms
- 05+ bedrooms

- Cars and other vehicles available in Port Hadlock-Irondale in owner-occupied houses/condos
- 57no vehicle
- 2701 vehicle
- 2722 vehicles
- 2783 vehicles
- 744 vehicles
- 345+ vehicles

- Cars and other vehicles available in Port Hadlock-Irondale in renter-occupied apartments
- 79no vehicle
- 871 vehicle
- 1352 vehicles
- 333 vehicles
- 584 vehicles
- 115+ vehicles

- Rooms in owner-occupied houses in Port Hadlock-Irondale, Washington
- 241 room
- 302 rooms
- 533 rooms
- 1834 rooms
- 2645 rooms
- 1516 rooms
- 787 rooms
- 1198 rooms
- 859+ rooms

- Rooms in renter-occupied apartments in Port Hadlock-Irondale, Washington
- 01 room
- 282 rooms
- 333 rooms
- 1014 rooms
- 2205 rooms
- 96 rooms
- 07 rooms
- 118 rooms
- 09+ rooms


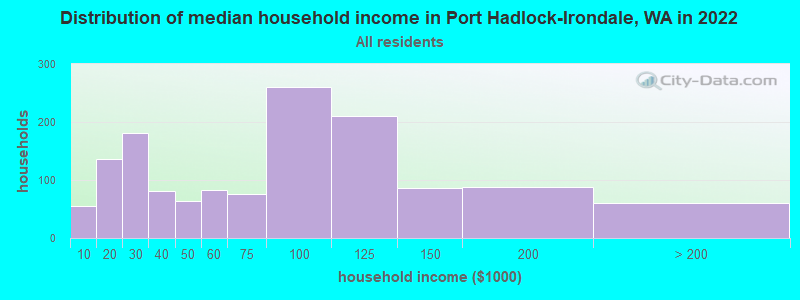
Port Hadlock-Irondale, WA household income distribution

- 55Less than $10,000
- 136$10,000 to $19,999
- 181$20,000 to $29,999
- 81$30,000 to $39,999
- 63$40,000 to $49,999
- 82$50,000 to $59,999
- 76$60,000 to $74,999
- 261$75,000 to $99,999
- 210$100,000 to $124,999
- 87$125,000 to $149,999
- 88$150,000 to $199,999
- 60$200,000 or more
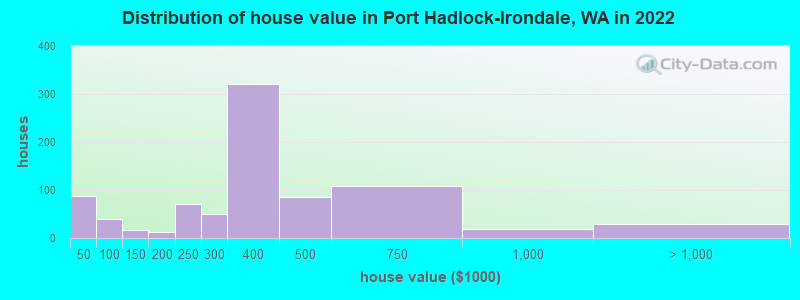
Home value of owner - occupied houses in 2022 in Port Hadlock-Irondale, WA
-
- 11Less than $10,000
- 32$10,000 to $14,999
- 5$20,000 to $24,999
- 7$30,000 to $34,999
- 30$40,000 to $49,999
- 8$80,000 to $89,999
- 11$100,000 to $124,999
- 4$125,000 to $149,999
- 7$150,000 to $174,999
- 4$175,000 to $199,999
- 70$200,000 to $249,999
- 50$250,000 to $299,999
- 320$300,000 to $399,999
- 86$400,000 to $499,999
- 108$500,000 to $749,999
- 18$750,000 to $999,999
- 17$1,000,000 to $1,499,999
- 11$2,000,000 or more
Rent paid by renters in 2022 in Port Hadlock-Irondale, WA
-
- 50$150 to $199
- 16$450 to $499
- 28$600 to $649
- 23$650 to $699
- 8$700 to $749
- 103$800 to $899
- 5$900 to $999
- 47$1,000 to $1,249
- 19$1,250 to $1,499
- 72$1,500 to $1,999
- 8No cash rent


Percentage of workers working in this county: 85.5%
Number of people working at home: 229 (13.9% of all workers)
Travel time to work (commute)
- Less than 5 minutes: 93
- 5 to 9 minutes: 223
- 10 to 14 minutes: 303
- 15 to 19 minutes: 365
- 20 to 24 minutes: 105
- 25 to 29 minutes: 22
- 30 to 34 minutes: 77
- 35 to 39 minutes: 18
- 40 to 44 minutes: 29
- 45 to 59 minutes: 91
- 60 to 89 minutes: 14
- 90 or more minutes: 67
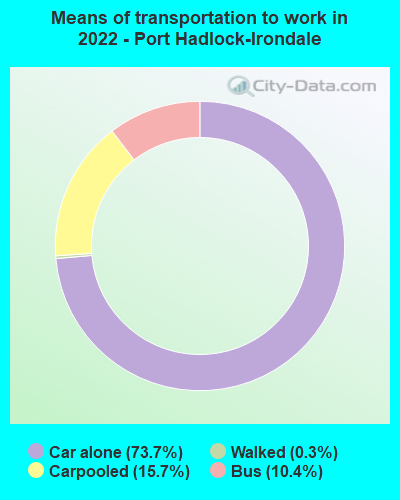
Means of transportation to work:
- Drove a car alone: 551 (57.5%)
- Carpooled: 120 (12.5%)
- Bus: 52 (5.4%)
- Walked: 2 (0.2%)
- Worked at home: 229 (23.9%)

- Unemployment by race in 2022
- Unemployment rate for White non-Hispanic residents
- 0.8%Males
- 6.2%Females
- Unemployment rate for two or more race residents
- 18.4%Males
- Unemployment rate for Hispanic or Latino residents
- 40.9%Males

- Year of entry for the foreign-born population in Port Hadlock-Irondale, Washington
- 112010 or later
- 182000 to 2009
- 1101990 to 1999
- 221980 to 1989
- 121970 to 1979
- 33Before 1970

First ancestries reported:
- American: 282 (21.9%)
- German: 141 (10.9%)
- Brazilian: 92 (7.1%)
- Norwegian: 66 (5.1%)
- Polish: 50 (3.9%)
- Irish: 44 (3.4%)
- European: 39 (3.0%)
- English: 38 (2.9%)
- Scotch-Irish: 28 (2.2%)
- Northern European: 23 (1.8%)
- Greek: 22 (1.7%)
- Scandinavian: 19 (1.5%)
- French: 14 (1.1%)
- Austrian: 12 (0.9%)
- Swedish: 11 (0.9%)
- British: 8 (0.6%)
- Italian: 4 (0.3%)
- Welsh: 4 (0.3%)
- Belizean: 4 (0.3%)
Most common places of birth for foreign-born residents (%):
| Port Hadlock-Irondale: | 43.9% (69) |
| Washington: | 0.8% (9,359) |
| Port Hadlock-Irondale: | 16.6% (26) |
| Washington: | 6.3% (71,661) |
| Port Hadlock-Irondale: | 16.6% (26) |
| Washington: | 0.0% (396) |
| Port Hadlock-Irondale: | 12.1% (19) |
| Washington: | 8.9% (101,353) |
| Port Hadlock-Irondale: | 8.3% (13) |
| Washington: | 0.4% (4,951) |
| Port Hadlock-Irondale: | 5.1% (8) |
| Washington: | 1.5% (17,453) |
| Port Hadlock-Irondale: | 5.1% (8) |
| Washington: | 1.6% (17,761) |
Place of birth for U.S.-born residents:
- This state: 1,798
- Other state: 1,397
- Northeast: 449
- Midwest: 277
- South: 214
- West: 465
94.0% of Port Hadlock-Irondale residents lived in the same house 1 years ago.
Out of people who lived in different houses, 31.1% lived in this county.
Out of people who lived in different counties, 22.7% lived in Washington.
| Port Hadlock-Irondale: | 94.0% |
| State average: | 85.2% |
Education attainment for males 25 years and older:
- No schooling: 12
- Nursery to 4th grade: 0
- 5th and 6th grade: 0
- 7th and 8th grade: 12
- 9th grade: 0
- 10th grade: 1
- 11th grade: 3
- 12th grade, no diploma: 8
- High school graduate (or equivalency): 557
- Less than 1 year of college: 95
- Some college more than 1 year, no degree: 246
- Associate degree: 46
- Bachelor's degree: 127
- Master's degree: 83
- Professional school degree: 0
- Doctorate degree: 0

Education attainment for females 25 years and older:
- No schooling: 0
- Nursery to 4th grade: 0
- 5th and 6th grade: 0
- 7th and 8th grade: 0
- 9th grade: 0
- 10th grade: 12
- 11th grade: 10
- 12th grade, no diploma: 0
- High school graduate (or equivalency): 403
- Less than 1 year of college: 88
- Some college more than 1 year, no degree: 251
- Associate degree: 236
- Bachelor's degree: 275
- Master's degree: 129
- Professional school degree: 18
- Doctorate degree: 11


Housing units in structures:
- One, detached: 950
- One, attached: 70
- Two: 87
- 3 or 4: 21
- 5 to 9: 56
- 10 to 19: 46
- Mobile homes: 313
- Boats, RVs, vans, etc.: 59
Median worth of mobile homes: $225,963
Housing units lacking complete kitchen facilities in 2022: 0.3%
House/condo owner moved in on average 13 years ago
Renter moved in on average 9 years ago

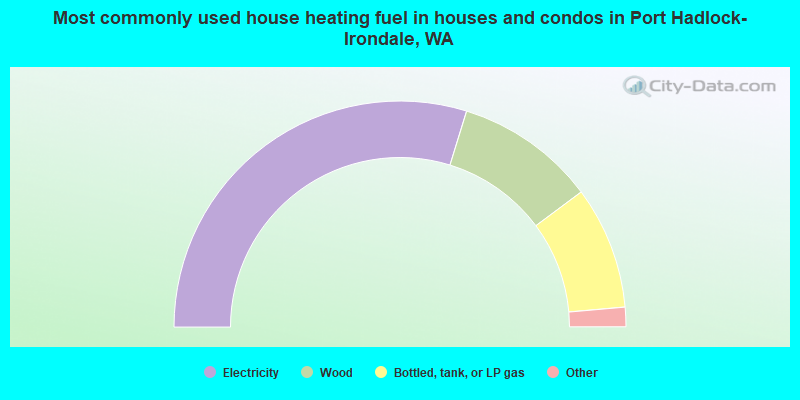
- 59.6%Electricity
- 20.1%Wood
- 17.6%Bottled, tank, or LP gas
- 2.4%Solar energy
- 0.2%Other fuel
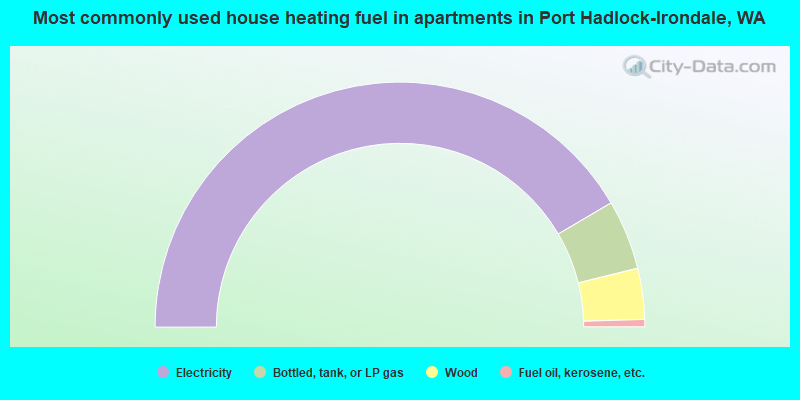
- 83.1%Electricity
- 9.2%Bottled, tank, or LP gas
- 6.7%Wood
- 1.0%Fuel oil, kerosene, etc.
Private vs. public school enrollment:
| Here: | 24.6% |
| Washington: | 12.4% |
| Here: | 0.0% |
| Washington: | 9.2% |
| Here: | 0.0% |
| Washington: | 16.5% |


