Port Royal, SC (South Carolina) Houses and Residents
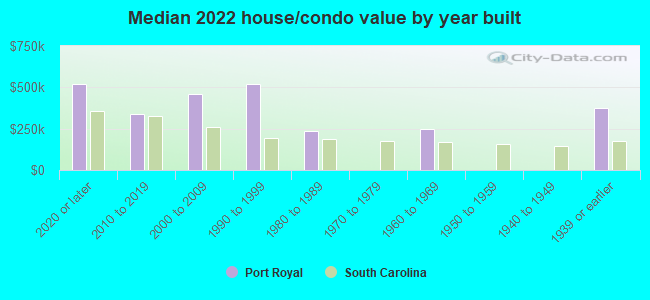
| Port Royal: | $358,401 |
| South Carolina: | $254,600 |
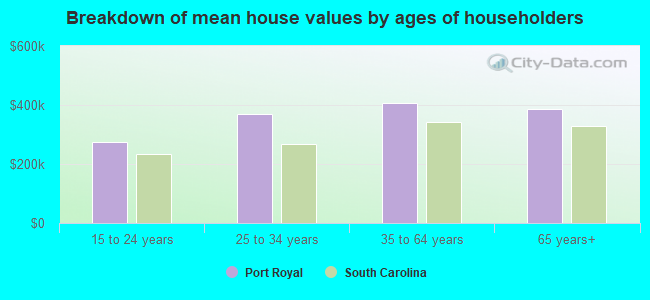
Mean price in 2022:
Detached houses: $403,559
Here: $403,559 State: $368,255 Townhouses or other attached units: $453,292
Here: $453,292 State: $292,023 In 3-to-4-unit structures: $205,956
Here: $205,956 State: $230,702 In 5-or-more-unit structures: $271,239
Here: $271,239 State: $326,361 Mobile homes: $277,051
Here: $277,051 State: $102,531
Total population: 11,870 (Urban population: 4,022 (all inside urban clusters), Rural population: 0)
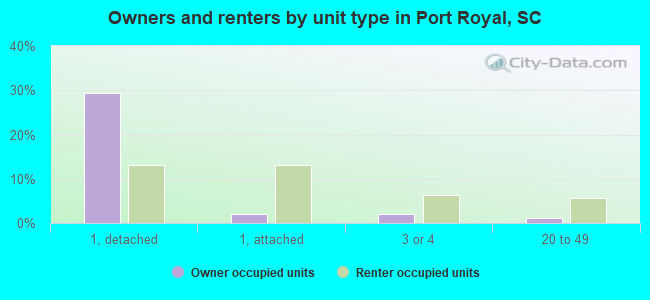
Houses: 5,318 (4,916 occupied: 1,827 owner occupied, 3,159 renter occupied)
| % of renters here: | 63% |
| State: | 28% |
Housing density: 1,370 houses/condos per square mile
Median price asked for vacant for-sale houses and condos in 2022 in this county: $379,761.
Median contract rent in 2022: $1,361 (lower quartile is $1,009, upper quartile is $1,793)
Median rent asked for vacant for-rent units in 2022: $1,363
Median gross rent in Port Royal, SC in 2022: $1,497
Housing units in Port Royal with a mortgage: 1,171 (18 second mortgage, 16 home equity loan, 9 both second mortgage and home equity loan)
Houses without a mortgage: 0
Median household income for houses/condos with a mortgage: $80,435
Median household income for apartments without a mortgage: $86,736
Median monthly housing costs: $1,390
Compare current foreclosures near Port Royal, SC:
| Photo | Address | Area | Beds / Baths | Price | Details |
|---|---|---|---|---|---|

|
#1
Island Pines Dr
Port Royal, SC 29935
|
1,088 sq. feet
|
2 baths 2 beds |
show details | |

|
#2
10th St
Port Royal, SC 29935
|
1,782 sq. feet
|
3 baths - beds |
show details | |

|
#3
Southside Blvd Apt 51
Port Royal, SC 29935
|
- sq. feet
|
- baths - beds |
show details | |

|
#4
Rosemont Ave
Port Royal, SC 29935
|
- sq. feet
|
- baths - beds |
show details | |

|
#5
12th St
Port Royal, SC 29935
|
- sq. feet
|
- baths - beds |
show details | |

|
#6
Ladys Island Dr Unit 126
Port Royal, SC 29935
|
- sq. feet
|
- baths - beds |
show details | |

|
#7
Stuart Towne Ln Apt 11b
Port Royal, SC 29935
|
- sq. feet
|
- baths - beds |
show details | |

|
#8
Laurel St
Port Royal, SC 29935
|
- sq. feet
|
- baths - beds |
show details | |

|
#9
Greenway Ct
Port Royal, SC 29935
|
- sq. feet
|
- baths - beds |
show details | |

|
#10
Stuart Towne Ln Apt 12b
Port Royal, SC 29935
|
- sq. feet
|
- baths - beds |
show details |
| Photo | Address | Area | Beds / Baths | Price | Details |
|---|---|---|---|---|---|

|
#11
Stuart Point Rd
Seabrook, SC 29940
|
1,456 sq. feet
|
2 baths 3 beds |
show details | |

|
#12
Hilda Ave
Ladys Island, SC 29907
|
1,516 sq. feet
|
2 baths 3 beds |
show details | |

|
#13
Charles St # A
Beaufort, SC 29902
|
1,530 sq. feet
|
1 baths 2 beds |
show details | |

|
#14
Centerview Dr
Beaufort, SC 29902
|
1,152 sq. feet
|
1 baths 3 beds |
show details | |

|
#15
4th St
Beaufort, SC 29902
|
1,048 sq. feet
|
2 baths 3 beds |
show details | |

|
#16
Tuscarora Ave
Ladys Island, SC 29907
|
2,486 sq. feet
|
4 baths 3 beds |
show details | |

|
#17
Cross Rd
Bluffton, SC 29910
|
1,642 sq. feet
|
2 baths 3 beds |
show details | |

|
#18
Scott St
Beaufort, SC 29902
|
1,280 sq. feet
|
1 baths 3 beds |
show details | |

|
#19
Mamie Frazier Ln
Beaufort, SC 29906
|
1,212 sq. feet
|
1 baths 3 beds |
show details | |

|
#20
Red Cedar St
Bluffton, SC 29910
|
1,738 sq. feet
|
2 baths 3 beds |
show details |
| Photo | Address | Area | Beds / Baths | Price | Details |
|---|---|---|---|---|---|

|
#21
Hidden Lakes Cir
Bluffton, SC 29910
|
2,298 sq. feet
|
2 baths 3 beds |
show details | |

|
#22
Scott Hill Rd
Saint Helena Island, SC 29920
|
1,280 sq. feet
|
1 baths 3 beds |
show details | |

|
#23
Ramsey Rd
Beaufort, SC 29906
|
1,150 sq. feet
|
1 baths 3 beds |
show details | |

|
#24
Marquis Way
Ladys Island, SC 29907
|
2,114 sq. feet
|
2 baths 3 beds |
show details | |

|
#25
Pelican Cir
Beaufort, SC 29906
|
1,161 sq. feet
|
2 baths 3 beds |
show details | |

|
#26
Cedar Point Dr
Ladys Island, SC 29907
|
1,120 sq. feet
|
1 baths 2 beds |
show details | |

|
#27
Middlefield Cir
Seabrook, SC 29940
|
1,388 sq. feet
|
1 baths 3 beds |
show details | |

|
#28
Seaside Rd
Saint Helena Island, SC 29920
|
1,422 sq. feet
|
1 baths 3 beds |
show details | |

|
#29
Francis Marion Cir
Ladys Island, SC 29907
|
3,086 sq. feet
|
3 baths 4 beds |
show details | |

|
#30
West Sq
Bluffton, SC 29910
|
1,024 sq. feet
|
1 baths 2 beds |
show details |
| Photo | Address | Area | Beds / Baths | Price | Details |
|---|---|---|---|---|---|

|
#31
Fairlawn Ct
Hilton Head Island, SC 29926
|
3,678 sq. feet
|
3 baths 4 beds |
show details | |

|
#32
Pickens St
Ladys Island, SC 29907
|
1,806 sq. feet
|
2 baths 3 beds |
show details | |

|
#33
Pickens St
Ladys Island, SC 29907
|
2,520 sq. feet
|
3 baths 4 beds |
show details | |

|
#34
Jeter Rd
Beaufort, SC 29906
|
1,276 sq. feet
|
2 baths 4 beds |
show details | |

|
#35
Mary Elizabeth Dr
Ladys Island, SC 29907
|
1,186 sq. feet
|
2 baths 3 beds |
show details | |

|
#36
Fish Haul Rd
Hilton Head Island, SC 29926
|
956 sq. feet
|
1 baths 2 beds |
show details | |

|
#37
Whitfield Ln
Saint Helena Island, SC 29920
|
1,780 sq. feet
|
1 baths 3 beds |
show details | |

|
#38
Christine Dr
Ladys Island, SC 29907
|
1,404 sq. feet
|
2 baths 3 beds |
show details | |

|
#39
Broad River Blvd
Beaufort, SC 29906
|
840 sq. feet
|
1 baths 3 beds |
show details | |

|
#40
Shorts Landing Rd
Ladys Island, SC 29907
|
1,189 sq. feet
|
1 baths 3 beds |
show details |
| Photo | Address | Area | Beds / Baths | Price | Details |
|---|---|---|---|---|---|

|
#41
Ratel Cir
Beaufort, SC 29902
|
1,770 sq. feet
|
2 baths 3 beds |
show details | |

|
#42
Jenkins Rd
Yemassee, SC 29945
|
672 sq. feet
|
1 baths 3 beds |
show details | |

|
#43
Heartstone Cir
Bluffton, SC 29910
|
1,636 sq. feet
|
2 baths 3 beds |
show details | |

|
#44
Waverly Way
Beaufort, SC 29902
|
1,339 sq. feet
|
1 baths 3 beds |
show details | |

|
#45
Southside Blvd
Beaufort, SC 29902
|
1,476 sq. feet
|
2 baths 3 beds |
show details | |

|
#46
Stoney Xing
Bluffton, SC 29910
|
1,704 sq. feet
|
2 baths 3 beds |
show details | |

|
#47
Dowlingwood Dr
Beaufort, SC 29902
|
2,913 sq. feet
|
2 baths 3 beds |
show details | |

|
#48
Cypress St
Beaufort, SC 29906
|
1,524 sq. feet
|
2 baths 3 beds |
show details | |

|
#49
Castle Rock Rd
Beaufort, SC 29906
|
840 sq. feet
|
1 baths 4 beds |
show details | |

|
Check over 1 million property listings on Foreclosure.com!
|
browse all offers | |||


 | Charleston is old and busted. Greenville is the new hotness. (717 replies) |
| Rural Towns near Shoreline (75 replies) |
| Opinion (and info) on doing a "winter Vacation Rental" in Port Royal. (0 replies) |
| retire to Beaufort or Bluffton (15 replies) |
| Port of Port Royal Development (14 replies) |
| Looking for Rentals - Port Royal (0 replies) |
Median year apartment built: 2006
Household type by relationship:
Households: 15,135- Male householders: 2,822 (1,163 living alone), Female householders: 2,063 (443 living alone)
2,520 spouses (2,520 opposite-sex spouses), 210 unmarried partners, (210 opposite-sex unmarried partners), 3,667 children (3,016 natural, 88 adopted, 562 stepchildren), 368 grandchildren, 104 brothers or sisters, 149 parents, 0 foster children, 46 other relatives, 94 non-relatives
- In group quarters: 3,085
Size of family households: 1,627 2-persons, 769 3-persons, 367 4-persons, 196 5-persons, 62 6-persons, 21 7-or-more-persons.
Size of nonfamily households: 1,798 1-person, 126 2-persons.
1,455 married couples with children.
750 single-parent households (84 men, 666 women).
88.4% of residents of Port Royal speak English at home.
9.4% of residents speak Spanish at home (77% speak English very well, 13% speak English well, 10% speak English not well).
1.0% of residents speak other Indo-European language at home (100% speak English very well).
0.7% of residents speak Asian or Pacific Island language at home (78% speak English very well, 22% speak English well).
0.4% of residents speak other language at home (94% speak English very well, 6% speak English well).
Foreign born population: 598 (4.0%)
(24.4% of them are naturalized citizens)
| Here: | 6.0 |
| State: | 6.4 |
| Here: | 4.1 |
| State: | 4.5 |
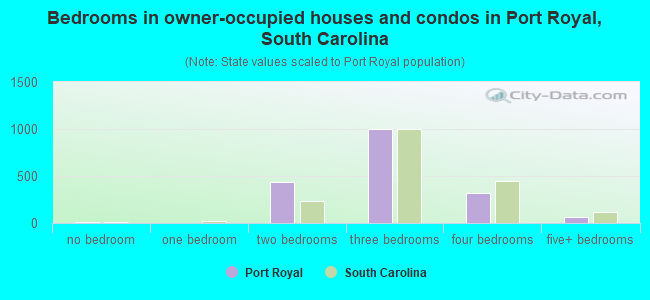
- Bedrooms in owner-occupied houses and condos in Port Royal, South Carolina
- 15no bedroom
- 01 bedroom
- 4332 bedrooms
- 1,0053 bedrooms
- 3154 bedrooms
- 595+ bedrooms
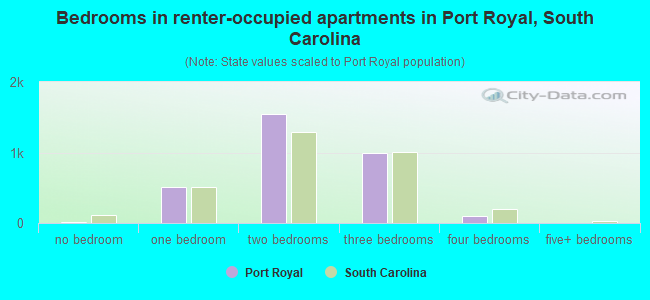
- Bedrooms in renter-occupied apartments in Port Royal, South Carolina
- 14no bedroom
- 5111 bedroom
- 1,5462 bedrooms
- 9873 bedrooms
- 1024 bedrooms
- 05+ bedrooms
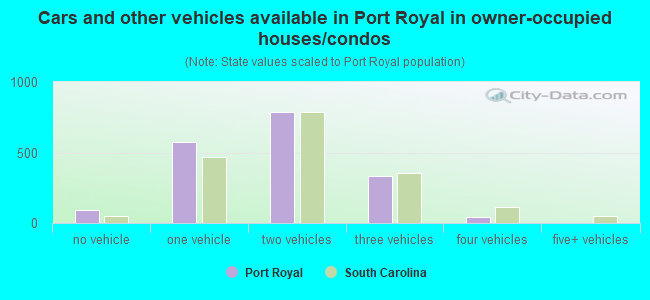
- Cars and other vehicles available in Port Royal in owner-occupied houses/condos
- 92no vehicle
- 5711 vehicle
- 7862 vehicles
- 3333 vehicles
- 454 vehicles
- 05+ vehicles
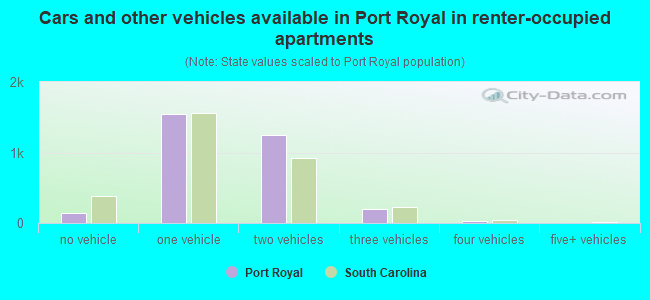
- Cars and other vehicles available in Port Royal in renter-occupied apartments
- 144no vehicle
- 1,5451 vehicle
- 1,2422 vehicles
- 1943 vehicles
- 344 vehicles
- 05+ vehicles
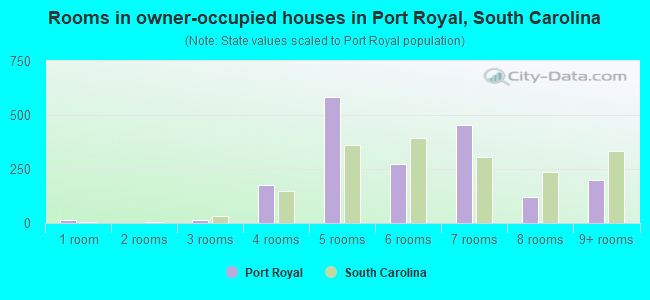
- Rooms in owner-occupied houses in Port Royal, South Carolina
- 151 room
- 02 rooms
- 153 rooms
- 1774 rooms
- 5825 rooms
- 2716 rooms
- 4527 rooms
- 1198 rooms
- 1979+ rooms
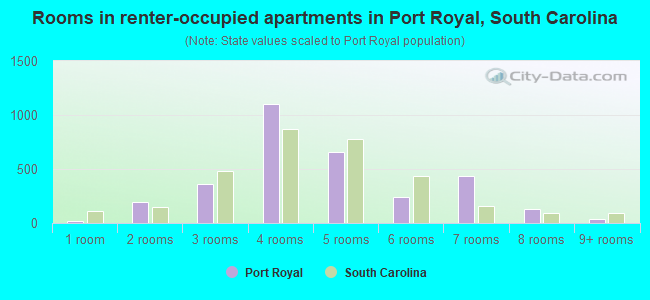
- Rooms in renter-occupied apartments in Port Royal, South Carolina
- 141 room
- 1922 rooms
- 3613 rooms
- 1,0984 rooms
- 6545 rooms
- 2446 rooms
- 4317 rooms
- 1328 rooms
- 339+ rooms
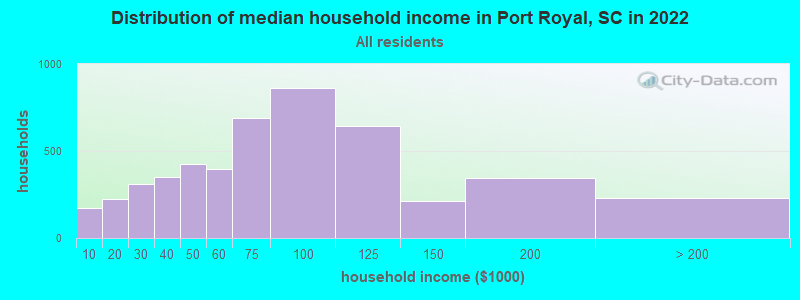
Port Royal, SC household income distribution

- 171Less than $10,000
- 222$10,000 to $19,999
- 309$20,000 to $29,999
- 353$30,000 to $39,999
- 424$40,000 to $49,999
- 397$50,000 to $59,999
- 690$60,000 to $74,999
- 864$75,000 to $99,999
- 641$100,000 to $124,999
- 212$125,000 to $149,999
- 345$150,000 to $199,999
- 231$200,000 or more
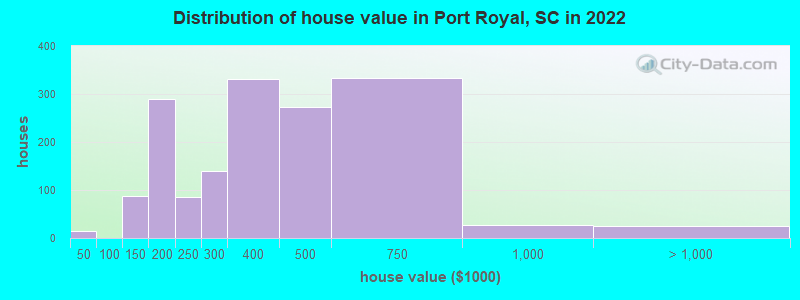
Home value of owner - occupied houses in 2022 in Port Royal, SC
-
- 14$25,000 to $29,999
- 30$100,000 to $124,999
- 57$125,000 to $149,999
- 116$150,000 to $174,999
- 171$175,000 to $199,999
- 85$200,000 to $249,999
- 138$250,000 to $299,999
- 330$300,000 to $399,999
- 273$400,000 to $499,999
- 333$500,000 to $749,999
- 26$750,000 to $999,999
- 25$1,500,000 to $1,999,999
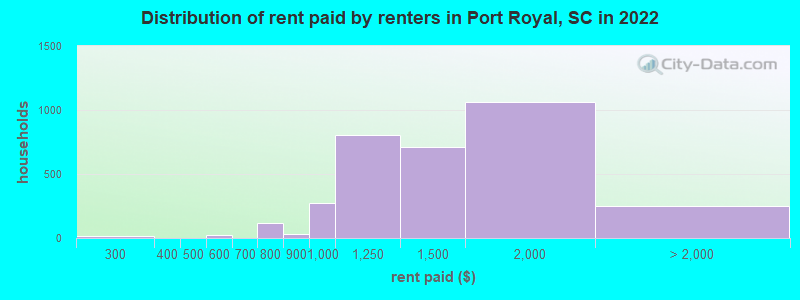
Rent paid by renters in 2022 in Port Royal, SC
-
- 14$200 to $249
- 2$350 to $399
- 23$500 to $549
- 119$700 to $749
- 33$800 to $899
- 273$900 to $999
- 801$1,000 to $1,249
- 713$1,250 to $1,499
- 1,063$1,500 to $1,999
- 77$2,000 to $2,499
- 45$2,500 to $2,999
- 128No cash rent
Percentage of workers working in this county: 95.2%
Number of people working at home: 1,290 (14.2% of all workers)
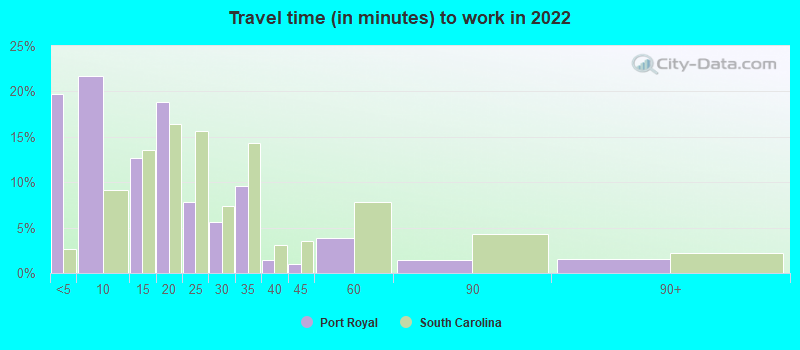
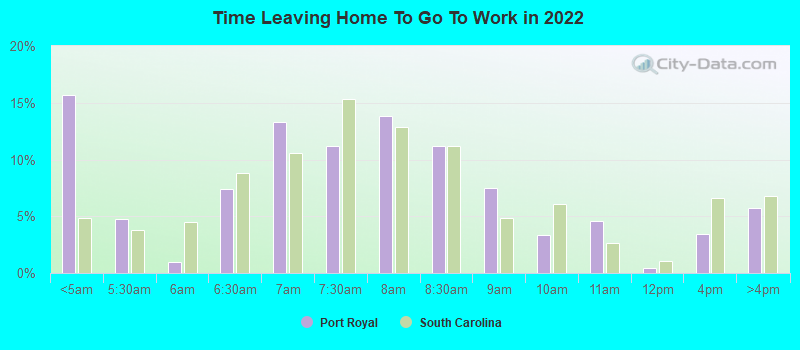
Travel time to work (commute)
- Less than 5 minutes: 2,442
- 5 to 9 minutes: 2,004
- 10 to 14 minutes: 1,142
- 15 to 19 minutes: 1,186
- 20 to 24 minutes: 439
- 25 to 29 minutes: 51
- 30 to 34 minutes: 696
- 35 to 39 minutes: 46
- 40 to 44 minutes: 14
- 45 to 59 minutes: 304
- 60 to 89 minutes: 115
- 90 or more minutes: 52
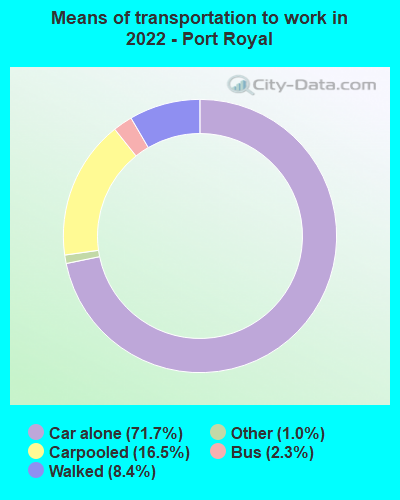
Means of transportation to work:
- Drove a car alone: 5,637 (61.8%)
- Carpooled: 1,358 (14.9%)
- Bus: 170 (1.9%)
- Ferryboat: 3 (0.0%)
- Taxi: 88 (1.0%)
- Walked: 612 (6.7%)
- Worked at home: 1,290 (14.1%)
- Unemployment by race in 2022
- Unemployment rate for White non-Hispanic residents
- 2.0%Females
- Unemployment rate for Black residents
- 1.3%Females
- Unemployment rate for two or more race residents
- 5.9%Females
- Unemployment rate for Hispanic or Latino residents
- 8.5%Females
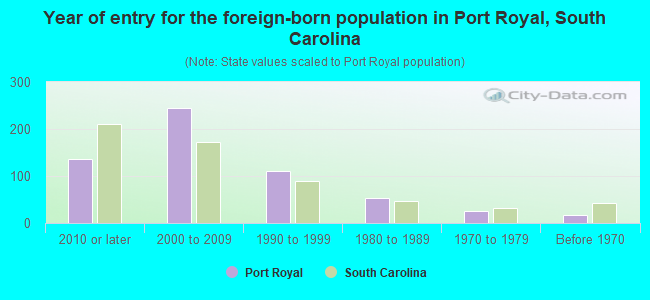
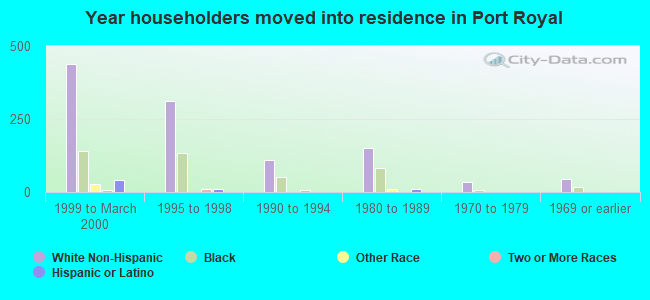
- Year of entry for the foreign-born population in Port Royal, South Carolina
- 1372010 or later
- 2452000 to 2009
- 1111990 to 1999
- 531980 to 1989
- 261970 to 1979
- 18Before 1970
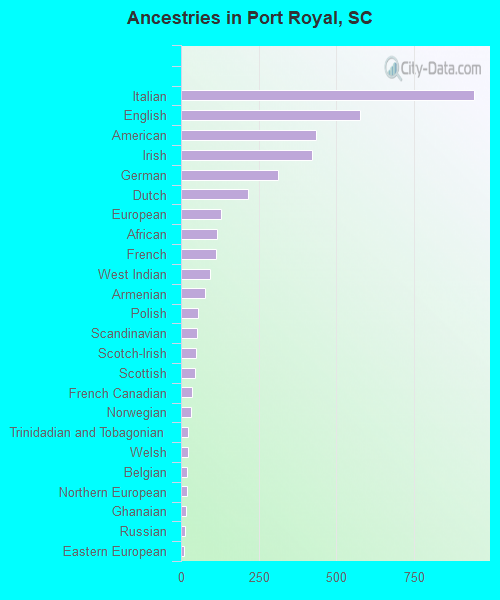
First ancestries reported:
- Italian: 944 (13.5%)
- English: 575 (8.2%)
- American: 433 (6.2%)
- Irish: 422 (6.0%)
- German: 312 (4.5%)
- Dutch: 217 (3.1%)
- European: 129 (1.8%)
- African: 115 (1.6%)
- French: 113 (1.6%)
- West Indian: 92 (1.3%)
- Armenian: 78 (1.1%)
- Polish: 55 (0.8%)
- Scandinavian: 53 (0.8%)
- Scotch-Irish: 47 (0.7%)
- Scottish: 44 (0.6%)
- French Canadian: 37 (0.5%)
- Norwegian: 32 (0.5%)
- Trinidadian and Tobagonian: 23 (0.3%)
- Welsh: 21 (0.3%)
- Belgian: 20 (0.3%)
- Northern European: 20 (0.3%)
- Ghanaian: 16 (0.2%)
- Russian: 14 (0.2%)
- Eastern European: 11 (0.2%)
- Jamaican: 8 (0.1%)
Most common places of birth for foreign-born residents (%):
| Port Royal: | 43.7% (269) |
| South Carolina: | 22.5% (60,774) |
| Port Royal: | 8.6% (53) |
| South Carolina: | 4.8% (12,834) |
| Port Royal: | 7.5% (46) |
| South Carolina: | 3.4% (9,058) |
| Port Royal: | 6.8% (42) |
| South Carolina: | 0.4% (1,080) |
| Port Royal: | 4.4% (27) |
| South Carolina: | 2.6% (7,073) |
| Port Royal: | 3.6% (22) |
| South Carolina: | 0.8% (2,055) |
| Port Royal: | 3.1% (19) |
| South Carolina: | 0.2% (540) |
| Port Royal: | 2.8% (17) |
| South Carolina: | 0.4% (1,092) |
| Port Royal: | 2.0% (12) |
| South Carolina: | 1.5% (3,987) |
| Port Royal: | 1.8% (11) |
| South Carolina: | 2.3% (6,308) |
| Port Royal: | 1.6% (10) |
| South Carolina: | 0.1% (165) |
Place of birth for U.S.-born residents:
- This state: 3,413
- Other state: 10,971
- Northeast: 2,321
- Midwest: 2,262
- South: 4,889
- West: 1,753
73.0% of Port Royal residents lived in the same house 1 years ago.
Out of people who lived in different houses, 10.8% lived in this county.
Out of people who lived in different counties, 26.4% lived in South Carolina.
| Port Royal: | 73.0% |
| State average: | 86.5% |
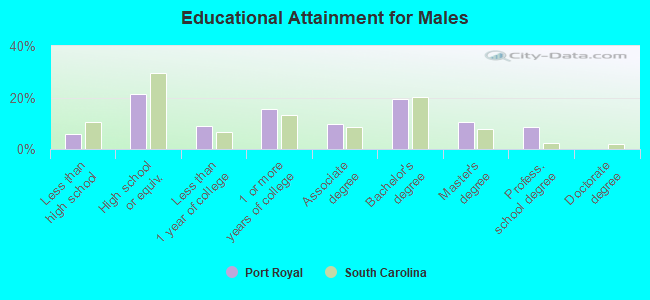
Education attainment for males 25 years and older:
- No schooling: 10
- Nursery to 4th grade: 0
- 5th and 6th grade: 68
- 7th and 8th grade: 0
- 9th grade: 15
- 10th grade: 54
- 11th grade: 69
- 12th grade, no diploma: 17
- High school graduate (or equivalency): 835
- Less than 1 year of college: 349
- Some college more than 1 year, no degree: 607
- Associate degree: 374
- Bachelor's degree: 751
- Master's degree: 415
- Professional school degree: 333
- Doctorate degree: 0
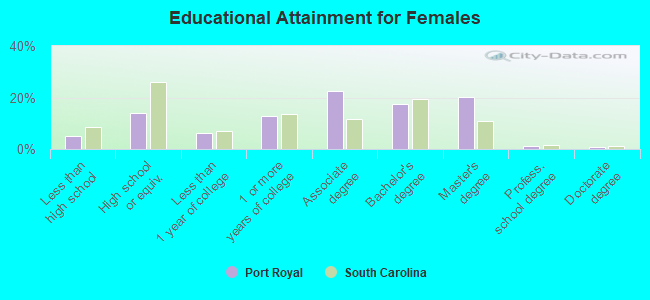
Education attainment for females 25 years and older:
- No schooling: 34
- Nursery to 4th grade: 0
- 5th and 6th grade: 18
- 7th and 8th grade: 45
- 9th grade: 87
- 10th grade: 15
- 11th grade: 0
- 12th grade, no diploma: 0
- High school graduate (or equivalency): 559
- Less than 1 year of college: 245
- Some college more than 1 year, no degree: 518
- Associate degree: 904
- Bachelor's degree: 704
- Master's degree: 812
- Professional school degree: 41
- Doctorate degree: 26
Housing units in structures:
- One, detached: 2,132
- One, attached: 703
- Two: 99
- 3 or 4: 409
- 5 to 9: 436
- 10 to 19: 623
- 20 to 49: 557
- 50 or more: 224
- Mobile homes: 108
- Boats, RVs, vans, etc.: 21
Median worth of mobile homes: $178,850
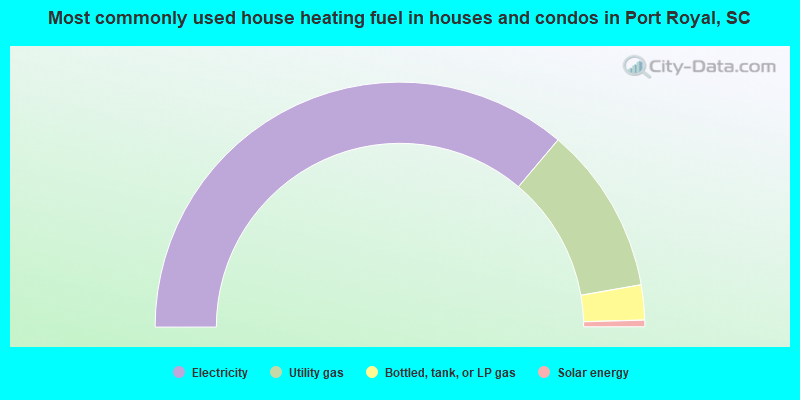
- 72.4%Electricity
- 22.2%Utility gas
- 4.6%Bottled, tank, or LP gas
- 0.9%Solar energy
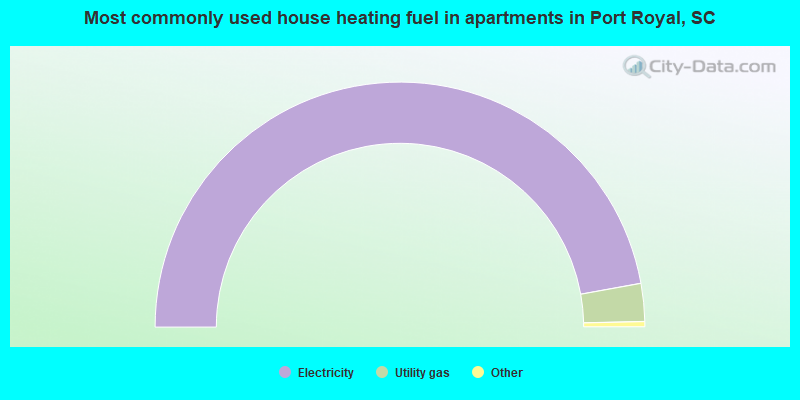
- 94.3%Electricity
- 5.0%Utility gas
- 0.4%No fuel used
- 0.3%Bottled, tank, or LP gas
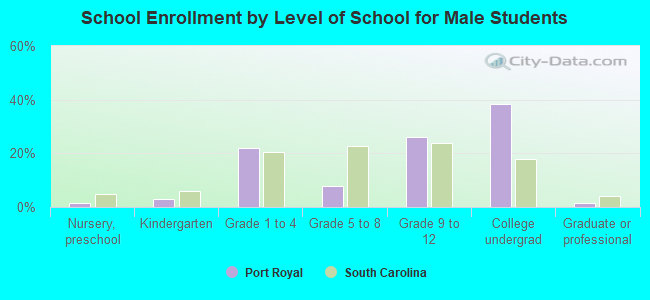
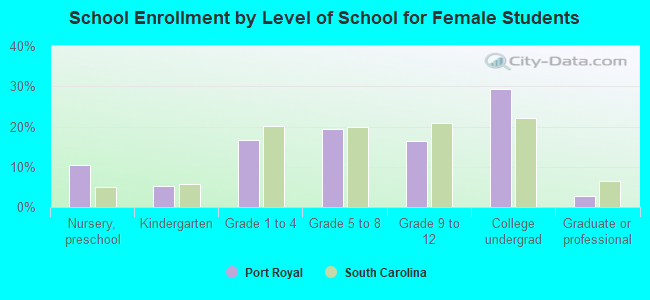
Private vs. public school enrollment:
| Here: | 14.6% |
| South Carolina: | 14.4% |
| Here: | 7.9% |
| South Carolina: | 11.1% |
| Here: | 7.3% |
| South Carolina: | 21.9% |