Portsmouth, OH (Ohio) Houses and Residents
| Portsmouth: | $94,998 |
| Ohio: | $204,100 |
Total population: 20,326 (Urban population: 20,157 (all inside urban clusters), Rural population: 679 (all nonfarm))
Houses: 8,475 (7,073 occupied: 3,577 owner occupied, 3,952 renter occupied)
| % of renters here: | 52% |
| State: | 33% |
Housing density: 787 houses/condos per square mile
Median price asked for vacant for-sale houses and condos in 2022: $64,134.
Median contract rent in 2022: $524 (lower quartile is $348, upper quartile is $574)
Median rent asked for vacant for-rent units in 2022: $1,081
Median gross rent in Portsmouth, OH in 2022: $655
Housing units in Portsmouth with a mortgage: 1,571 (109 second mortgage, 0 home equity loan, 90 both second mortgage and home equity loan)
Houses without a mortgage: 29
Median household income for houses/condos with a mortgage: $75,673
Median household income for apartments without a mortgage: $43,009
Median monthly housing costs: $643
Compare current foreclosures in Portsmouth, OH:
| Photo | Address | Area | Beds / Baths | Price | Details |
|---|---|---|---|---|---|

|
#1
Linden Ave
Portsmouth, OH 45662
|
1,848 sq. feet
|
2 baths 4 beds |
$46,800
|
show details |

|
#2
Argonne Rd
Portsmouth, OH 45662
|
780 sq. feet
|
1 baths 2 beds |
$109,900
|
show details |

|
#3
Auburn Ave
Portsmouth, OH 45662
|
1,248 sq. feet
|
1 baths 2 beds |
$44,900
|
show details |

|
#4
Hogan St
Portsmouth, OH 45662
|
957 sq. feet
|
1 baths 3 beds |
show details | |

|
#5
Shenandoah Ct
Portsmouth, OH 45662
|
1,328 sq. feet
|
2 baths 3 beds |
show details | |

|
#6
7th St
Portsmouth, OH 45662
|
1,607 sq. feet
|
1 baths 3 beds |
show details | |

|
#7
Grant St
Portsmouth, OH 45662
|
975 sq. feet
|
1 baths 3 beds |
show details | |

|
#8
State Route 139
Portsmouth, OH 45662
|
1,539 sq. feet
|
1 baths 2 beds |
show details | |

|
#9
Rhodes Ave
Portsmouth, OH 45662
|
874 sq. feet
|
1 baths 2 beds |
show details | |

|
#10
Woodland Ave
Portsmouth, OH 45662
|
782 sq. feet
|
1 baths 2 beds |
show details |
| Photo | Address | Area | Beds / Baths | Price | Details |
|---|---|---|---|---|---|

|
#11
5th St
Portsmouth, OH 45662
|
700 sq. feet
|
1 baths 2 beds |
show details | |

|
#12
Munn St
Portsmouth, OH 45662
|
960 sq. feet
|
1 baths 3 beds |
show details | |

|
#13
Mabert Rd
Portsmouth, OH 45662
|
1,988 sq. feet
|
2 baths 3 beds |
show details | |

|
#14
Wanda Rd
Portsmouth, OH 45662
|
1,440 sq. feet
|
1 baths 3 beds |
show details | |

|
#15
Milldale Rd
Portsmouth, OH 45662
|
1,120 sq. feet
|
1 baths 3 beds |
show details | |

|
#16
Pleasant Ave
Portsmouth, OH 45662
|
840 sq. feet
|
1 baths 2 beds |
show details | |

|
#17
Layton Dr
Portsmouth, OH 45662
|
1,200 sq. feet
|
1 baths 3 beds |
show details | |

|
#18
High St
Portsmouth, OH 45662
|
1,584 sq. feet
|
1 baths 2 beds |
show details | |

|
#19
23rd St
Portsmouth, OH 45662
|
1,296 sq. feet
|
1 baths 3 beds |
show details | |

|
#20
Stedman Ave
Portsmouth, OH 45662
|
1,482 sq. feet
|
1 baths 3 beds |
show details |
| Photo | Address | Area | Beds / Baths | Price | Details |
|---|---|---|---|---|---|

|
#21
3rd St
Portsmouth, OH 45662
|
1,560 sq. feet
|
1 baths 4 beds |
show details | |

|
#22
Gallia St
Portsmouth, OH 45662
|
960 sq. feet
|
1 baths 3 beds |
show details | |

|
#23
Shump Rd
Portsmouth, OH 45662
|
1,152 sq. feet
|
2 baths 3 beds |
show details | |

|
#24
Rhodes Ave
Portsmouth, OH 45662
|
960 sq. feet
|
2 baths 4 beds |
show details | |

|
#25
23rd St
Portsmouth, OH 45662
|
1,296 sq. feet
|
1 baths 3 beds |
show details | |

|
#26
Kentland Ave
Portsmouth, OH 45662
|
1,248 sq. feet
|
2 baths 3 beds |
show details | |

|
#27
Summit St
Portsmouth, OH 45662
|
848 sq. feet
|
1 baths 2 beds |
show details | |

|
#28
Pleasant St
Portsmouth, OH 45662
|
1,280 sq. feet
|
1 baths 3 beds |
show details | |

|
#29
Canterbury Rd
Portsmouth, OH 45662
|
2,746 sq. feet
|
2 baths 4 beds |
show details | |

|
#30
Milldale Rd
Portsmouth, OH 45662
|
- sq. feet
|
2 baths 3 beds |
show details |
| Photo | Address | Area | Beds / Baths | Price | Details |
|---|---|---|---|---|---|

|
#31
Gallia St Apt 206
Portsmouth, OH 45662
|
- sq. feet
|
- baths - beds |
show details | |

|
#32
Pershing Ave
Portsmouth, OH 45662
|
- sq. feet
|
- baths - beds |
show details | |

|
#33
Ruhlman Ave
Portsmouth, OH 45662
|
- sq. feet
|
- baths - beds |
show details | |

|
#34
Richards Rd
Portsmouth, OH 45662
|
- sq. feet
|
- baths - beds |
show details | |

|
#35
Timmonds Ave
Portsmouth, OH 45662
|
- sq. feet
|
- baths - beds |
show details | |

|
#36
Kentland Ave
Portsmouth, OH 45662
|
- sq. feet
|
- baths - beds |
show details | |

|
#37
25th St
Portsmouth, OH 45662
|
- sq. feet
|
- baths - beds |
show details | |

|
#38
29th St # 5
Portsmouth, OH 45662
|
- sq. feet
|
- baths - beds |
show details | |

|
#39
Gallia St Apt 315
Portsmouth, OH 45662
|
- sq. feet
|
- baths - beds |
show details | |

|
#40
Swauger Valley Rd
Portsmouth, OH 45662
|
- sq. feet
|
- baths - beds |
show details |
| Photo | Address | Area | Beds / Baths | Price | Details |
|---|---|---|---|---|---|

|
#41
Greenbriar Rd Unit
Portsmouth, OH 45662
|
- sq. feet
|
- baths - beds |
show details | |

|
#42
Shela Blvd # 5
Portsmouth, OH 45662
|
- sq. feet
|
- baths - beds |
show details | |

|
#43
Bertha Ave Lot 29
Portsmouth, OH 45662
|
- sq. feet
|
- baths - beds |
show details | |

|
#44
5th St Apt 415
Portsmouth, OH 45662
|
- sq. feet
|
- baths - beds |
show details | |

|
#45
Harrisonville Ave
Portsmouth, OH 45662
|
- sq. feet
|
- baths - beds |
show details | |

|
#46
15th St
Portsmouth, OH 45662
|
- sq. feet
|
- baths - beds |
show details | |

|
#47
Elliott Hill Rd
Portsmouth, OH 45662
|
- sq. feet
|
- baths - beds |
show details | |

|
#48
Slocum Heights Rd
Portsmouth, OH 45662
|
- sq. feet
|
- baths - beds |
show details | |

|
#49
Swauger Valley Rd
Portsmouth, OH 45662
|
- sq. feet
|
- baths - beds |
show details | |

|
Check over 1 million property listings on Foreclosure.com!
|
browse all offers | |||

Latest news about housing in Portsmouth, OH collected exclusively by city-data.com from local newspapers, TV, and radio stations

 | 500,000,000 Huge Win for Middletown/Ohio (37 replies) |
| About Youngstown, OH (62 replies) |
| Ohio's most Hallmark-like small town (20 replies) |
| Moving from Southern California to Ohio (100 replies) |
| What would be the best, most inexpensive way to buid a large home? (21 replies) |
| Future of the Columbus Crew? (82 replies) |

Median year apartment built: 1943
Household type by relationship:
Households: 17,755- Male householders: 3,092 (1,200 living alone), Female householders: 3,863 (1,530 living alone)
2,120 spouses (2,111 opposite-sex spouses), 597 unmarried partners, (569 opposite-sex unmarried partners), 4,448 children (4,150 natural, 88 adopted, 209 stepchildren), 845 grandchildren, 168 brothers or sisters, 437 parents, 54 foster children, 237 other relatives, 725 non-relatives
- In group quarters: 1,164
Size of family households: 1,929 2-persons, 990 3-persons, 613 4-persons, 304 5-persons, 93 6-persons, 108 7-or-more-persons.
Size of nonfamily households: 3,239 1-person, 197 2-persons, 88 3-persons, 10 4-persons.
1,551 married couples with children.
1,645 single-parent households (135 men, 1,510 women).
97.2% of residents of Portsmouth speak English at home.
0.7% of residents speak Spanish at home (68% speak English very well, 32% speak English well).
0.6% of residents speak other Indo-European language at home (67% speak English very well, 33% speak English well).
0.9% of residents speak Asian or Pacific Island language at home (44% speak English very well, 22% speak English well, 4% speak English not well, 29% don't speak English at all).
0.1% of residents speak other language at home (100% speak English very well).
Foreign born population: 741 (4.2%)
(37.8% of them are naturalized citizens)
| Here: | 6.5 |
| State: | 6.7 |
| Here: | 4.6 |
| State: | 4.4 |

- Bedrooms in owner-occupied houses and condos in Portsmouth, Ohio
- 0no bedroom
- 541 bedroom
- 7052 bedrooms
- 2,0633 bedrooms
- 5774 bedrooms
- 1795+ bedrooms

- Bedrooms in renter-occupied apartments in Portsmouth, Ohio
- 154no bedroom
- 7881 bedroom
- 1,7102 bedrooms
- 1,0753 bedrooms
- 2154 bedrooms
- 115+ bedrooms

- Cars and other vehicles available in Portsmouth in owner-occupied houses/condos
- 114no vehicle
- 1,3591 vehicle
- 1,3342 vehicles
- 6173 vehicles
- 1124 vehicles
- 415+ vehicles

- Cars and other vehicles available in Portsmouth in renter-occupied apartments
- 849no vehicle
- 1,9011 vehicle
- 1,0302 vehicles
- 1583 vehicles
- 144 vehicles
- 05+ vehicles

- Rooms in owner-occupied houses in Portsmouth, Ohio
- 01 room
- 02 rooms
- 303 rooms
- 2284 rooms
- 7845 rooms
- 8366 rooms
- 6807 rooms
- 5218 rooms
- 4999+ rooms

- Rooms in renter-occupied apartments in Portsmouth, Ohio
- 1221 room
- 1102 rooms
- 5993 rooms
- 1,0024 rooms
- 8655 rooms
- 5856 rooms
- 3357 rooms
- 2288 rooms
- 1069+ rooms


Portsmouth, OH household income distribution

- 912Less than $10,000
- 1,637$10,000 to $19,999
- 941$20,000 to $29,999
- 653$30,000 to $39,999
- 606$40,000 to $49,999
- 715$50,000 to $59,999
- 637$60,000 to $74,999
- 585$75,000 to $99,999
- 305$100,000 to $124,999
- 244$125,000 to $149,999
- 254$150,000 to $199,999
- 184$200,000 or more
Home value of owner - occupied houses in 2022 in Portsmouth, OH
-
- 106Less than $10,000
- 20$10,000 to $14,999
- 55$15,000 to $19,999
- 136$20,000 to $24,999
- 71$25,000 to $29,999
- 37$30,000 to $34,999
- 133$35,000 to $39,999
- 126$40,000 to $49,999
- 338$50,000 to $59,999
- 267$60,000 to $69,999
- 115$70,000 to $79,999
- 120$80,000 to $89,999
- 229$90,000 to $99,999
- 408$100,000 to $124,999
- 394$125,000 to $149,999
- 235$150,000 to $174,999
- 130$175,000 to $199,999
- 388$200,000 to $249,999
- 49$250,000 to $299,999
- 49$300,000 to $399,999
- 100$400,000 to $499,999
- 10$500,000 to $749,999
- 7$750,000 to $999,999
Rent paid by renters in 2022 in Portsmouth, OH
-
- 177Less than $100
- 100$100 to $149
- 303$200 to $249
- 139$250 to $299
- 148$300 to $349
- 164$350 to $399
- 195$400 to $449
- 134$450 to $499
- 510$500 to $549
- 456$550 to $599
- 331$600 to $649
- 64$650 to $699
- 203$700 to $749
- 170$750 to $799
- 127$800 to $899
- 46$900 to $999
- 47$1,000 to $1,249
- 19$1,500 to $1,999
- 9$2,000 to $2,499
- 8$3,000 to $3,499
- 17$3,500 or more
- 246No cash rent


Percentage of workers working in this county: 83.0%
Number of people working at home: 354 (5.8% of all workers)
Travel time to work (commute)
- Less than 5 minutes: 720
- 5 to 9 minutes: 1,345
- 10 to 14 minutes: 1,327
- 15 to 19 minutes: 835
- 20 to 24 minutes: 247
- 25 to 29 minutes: 219
- 30 to 34 minutes: 569
- 35 to 39 minutes: 46
- 40 to 44 minutes: 247
- 45 to 59 minutes: 290
- 60 to 89 minutes: 494
- 90 or more minutes: 142
Means of transportation to work:
- Drove a car alone: 10,539 (83.2%)
- Carpooled: 1,075 (8.5%)
- Bus: 2 (0.0%)
- Taxi: 29 (0.2%)
- Bicycle: 50 (0.4%)
- Walked: 259 (2.0%)
- Worked at home: 354 (2.8%)

- Unemployment by race in 2022
- Unemployment rate for White non-Hispanic residents
- 9.1%Males
- 7.0%Females
- Unemployment rate for Black residents
- 6.3%Males
- 1.6%Females
- Unemployment rate for two or more race residents
- 23.3%Males
- 16.6%Females

- Year of entry for the foreign-born population in Portsmouth, Ohio
- 842010 or later
- 1382000 to 2009
- 261990 to 1999
- 151980 to 1989
- 241970 to 1979
- 51Before 1970

First ancestries reported:
- English: 1,597 (23.4%)
- American: 1,087 (15.9%)
- German: 1,072 (15.7%)
- Irish: 503 (7.4%)
- Belgian: 149 (2.2%)
- Scotch-Irish: 113 (1.7%)
- European: 103 (1.5%)
- Scottish: 68 (1.0%)
- Italian: 66 (1.0%)
- Dutch: 57 (0.8%)
- French: 48 (0.7%)
- Austrian: 24 (0.4%)
- French Canadian: 23 (0.3%)
- British: 22 (0.3%)
- Hungarian: 20 (0.3%)
- Greek: 14 (0.2%)
- Norwegian: 14 (0.2%)
- Slovene: 14 (0.2%)
- Ghanaian: 14 (0.2%)
- Trinidadian and Tobagonian: 14 (0.2%)
- Icelander: 13 (0.2%)
- Welsh: 11 (0.2%)
- West Indian: 11 (0.2%)
- African: 10 (0.1%)
- Polish: 9 (0.1%)
- Haitian: 8 (0.1%)
- Lithuanian: 6 (0.09%)
- Egyptian: 5 (0.07%)
- Eastern European: 5 (0.07%)
- British West Indian: 1 (0.01%)
Most common places of birth for foreign-born residents (%):
| Portsmouth: | 21.4% (106) |
| Ohio: | 7.8% (44,796) |
| Portsmouth: | 18.6% (92) |
| Ohio: | 3.1% (17,818) |
| Portsmouth: | 15.6% (77) |
| Ohio: | 6.2% (35,703) |
| Portsmouth: | 10.5% (52) |
| Ohio: | 1.0% (5,553) |
| Portsmouth: | 10.3% (51) |
| Ohio: | 0.5% (3,090) |
| Portsmouth: | 4.2% (21) |
| Ohio: | 0.3% (1,793) |
| Portsmouth: | 4.0% (20) |
| Ohio: | 1.0% (5,979) |
| Portsmouth: | 2.4% (12) |
| Ohio: | 1.8% (10,561) |
| Portsmouth: | 2.2% (11) |
| Ohio: | 0.1% (502) |
Place of birth for U.S.-born residents:
- This state: 14,571
- Other state: 2,608
- Northeast: 342
- Midwest: 328
- South: 1,691
- West: 227
82.2% of Portsmouth residents lived in the same house 1 years ago.
Out of people who lived in different houses, 40.2% lived in this county.
Out of people who lived in different counties, 76.5% lived in Ohio.
| Portsmouth: | 82.2% |
| State average: | 87.8% |
Education attainment for males 25 years and older:
- No schooling: 200
- Nursery to 4th grade: 11
- 5th and 6th grade: 45
- 7th and 8th grade: 140
- 9th grade: 28
- 10th grade: 188
- 11th grade: 127
- 12th grade, no diploma: 158
- High school graduate (or equivalency): 2,215
- Less than 1 year of college: 526
- Some college more than 1 year, no degree: 709
- Associate degree: 369
- Bachelor's degree: 595
- Master's degree: 267
- Professional school degree: 104
- Doctorate degree: 31

Education attainment for females 25 years and older:
- No schooling: 138
- Nursery to 4th grade: 21
- 5th and 6th grade: 0
- 7th and 8th grade: 158
- 9th grade: 135
- 10th grade: 267
- 11th grade: 161
- 12th grade, no diploma: 100
- High school graduate (or equivalency): 2,151
- Less than 1 year of college: 592
- Some college more than 1 year, no degree: 877
- Associate degree: 457
- Bachelor's degree: 1,086
- Master's degree: 252
- Professional school degree: 41
- Doctorate degree: 47


Housing units in structures:
- One, detached: 6,088
- One, attached: 79
- Two: 565
- 3 or 4: 277
- 5 to 9: 450
- 10 to 19: 278
- 20 to 49: 342
- 50 or more: 306
- Mobile homes: 84
Median worth of mobile homes: $16,082
Housing units lacking complete kitchen facilities in 2022: 3.3%
House/condo owner moved in on average 18 years ago
Renter moved in on average 3 years ago

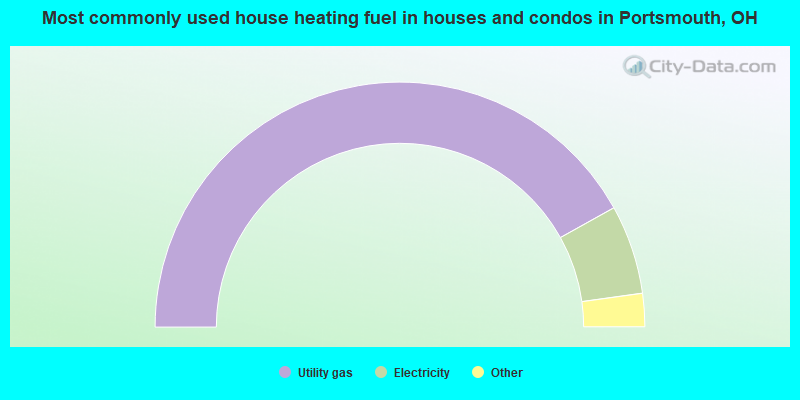
- 83.9%Utility gas
- 11.8%Electricity
- 2.6%Bottled, tank, or LP gas
- 1.0%Other fuel
- 0.4%Fuel oil, kerosene, etc.
- 0.3%Wood
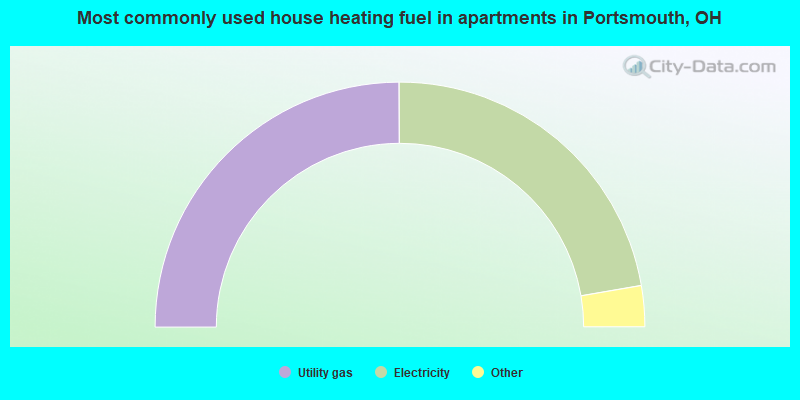
- 49.9%Utility gas
- 44.7%Electricity
- 2.4%Bottled, tank, or LP gas
- 1.6%Wood
- 0.9%No fuel used
- 0.5%Other fuel
Private vs. public school enrollment:
| Here: | 12.8% |
| Ohio: | 16.0% |
| Here: | 20.4% |
| Ohio: | 13.1% |
| Here: | 3.8% |
| Ohio: | 22.3% |


